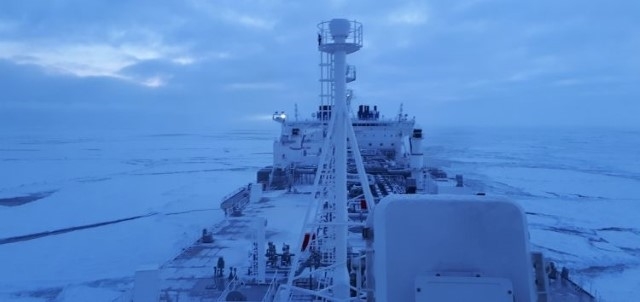
AWI sea-ice physicists have erected an ice camp to investigate melt ponds on Arctic sea ice. Credit: Photo : Alfred-Wegener-Institut / Mar Fernandez
Two recent papers enrich our understanding of interactions between oceans, ice and dissolved methane. The latest one is described in a Science Daily article Wandering greenhouse gas Climate models need to take into account the interaction between methane, the Arctic Ocean and ice by E. Damm et al. of Alfred Wegener Institute March 16, 2018. Excerpts with my bolds.
On the seafloor of the shallow coastal regions north of Siberia, microorganisms produce methane when they break down plant remains. If this greenhouse gas finds its way into the water, it can also become trapped in the sea ice that forms in these coastal waters. As a result, the gas can be transported thousands of kilometres across the Arctic Ocean and released in a completely different region months later.

AWI geochemist Dr Ellen Damm tested the waters of the High North for the greenhouse gas methane. In an expedition to the same region four years later, she had the chance to compare the measurements taken at different times, and found significantly less methane in the water samples.
Ellen Damm, together with Dr Dorothea Bauch from the GEOMAR Helmholtz Centre for Ocean Research in Kiel and other colleagues, analysed the samples to determine the regional levels of methane, and the sources. By measuring the oxygen isotopes in the sea ice, the scientists were able to deduce where and when the ice was formed. To do so, they had also taken sea-ice samples. Their findings: the ice transports the methane across the Arctic Ocean. And it appears to do so differently every year.
“As more seawater freezes it can expel the brine contained within, entraining large quantities of the methane locked in the ice,” explains AWI researcher Ellen Damm. As a result, a water-layer is formed beneath the ice that contains large amounts of both salt and methane. Yet the ice on the surface and the dense saltwater below, together with the greenhouse gas it contains, are all pushed on by the wind and currents. According to Thomas Krumpen, “It takes about two and a half years for the ice formed along the coast of the Laptev Sea to be carried across the Arctic Ocean and past the North Pole into the Fram Strait between the east cost of Greenland and Svalbard.” Needless to say, the methane trapped in the ice and the underlying saltwater is along for the ride.
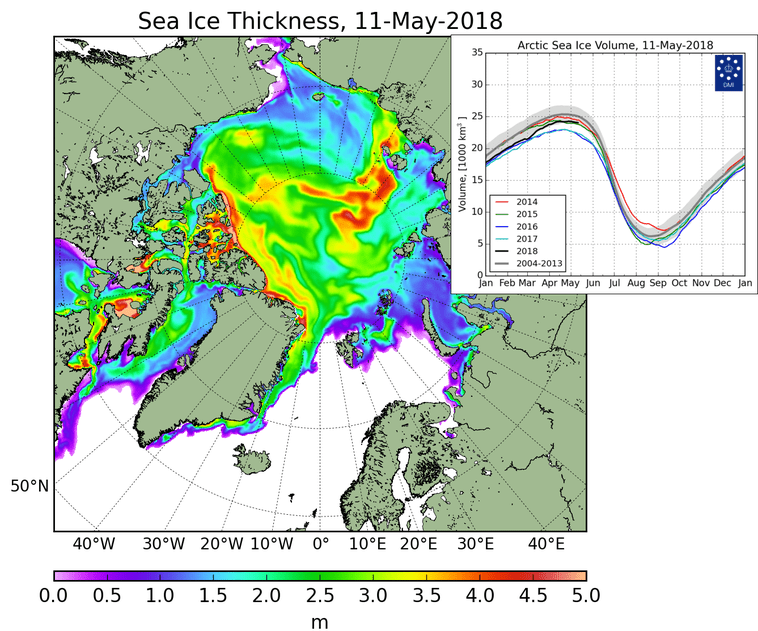
The rising temperatures produced by climate change are increasingly melting this ice. Both the area of water covered by sea ice and the thickness of the ice have been decreasing in recent years, and thinner ice is blown farther and faster by the wind. “In the past few years, we’ve observed that ice is carried across the Arctic Ocean faster and faster,” confirms Thomas Krumpen. And this process naturally means major changes in the Arctic’s methane turnover. Accordingly, quantifying the sources, sinks and transport routes of methane in the Arctic continues to represent a considerable challenge for the scientific community.
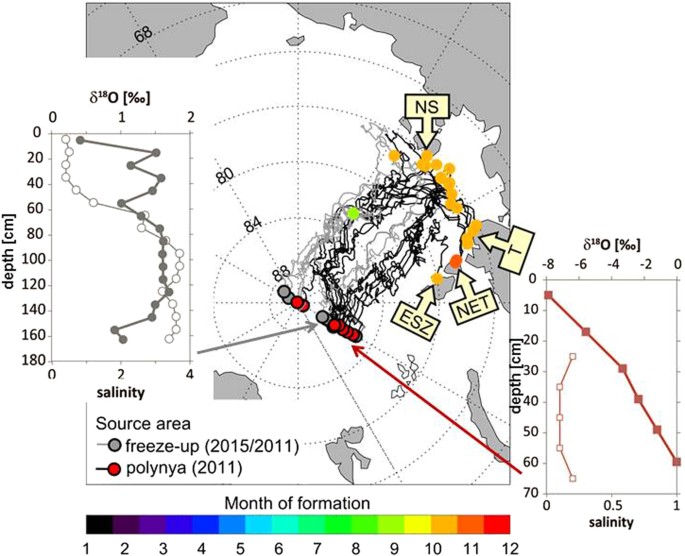
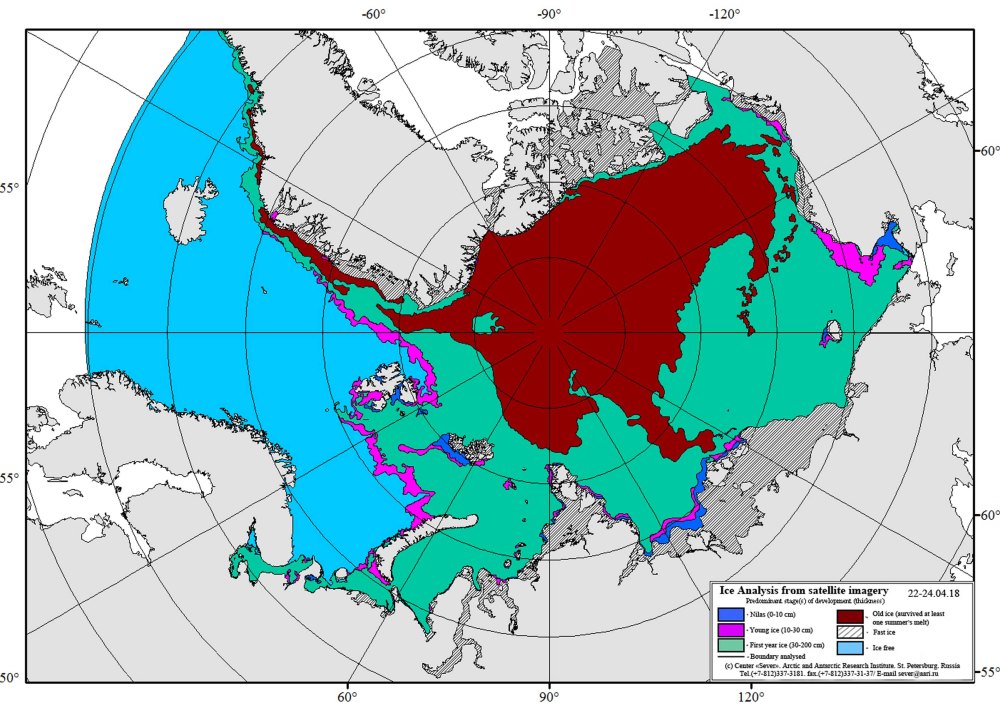
Sea ice drift trajectories leading to the 60°E section and δ18O isotopic composition (filled symbols) and salinity (open symbols) in sea ice at this section. Backward drift trajectories from the 60°E section show the sea ice formation areas, i.e. off shore within the Laptev Sea and in the coastal polynya areas. Trajectories were calculated based on a combination of sea ice motion and concentration products from passive microwave satellite data. The colour of the end node indicates the source area of sampled sea ice. Trajectories with red end nodes were formed in polynyas, namely the New Siberian (NS) Polynya, Taymyr (T) Polynya, Northeastern Taymyr (NET) Polynya and East Severnaya Zemlya (ESZ) Polynya. Grey end nodes refer to trajectories that were formed during freeze-up further offshore. The colour coding of the start node characterizes the month of formation (primarily October) of the individual trajectories. The δ18O ice isotopic composition reflects the δ18O composition of the water column from which each segment of the ice core was formed. Light values below about −4‰ indicate formation in coastal polynyas while values above −2‰ indicate freeze-up formation offshore. Salinity of the ice cores is in all cases below 4. The map is generated with IDL (Interactive Data Langue), software for analysis and visualization of data provided by Harris Geospatial Solutions (http://www.harrisgeospatial.com).
The paper itself is The Transpolar Drift conveys methane from the Siberian Shelf to the central Arctic Ocean
Abstract: Methane sources and sinks in the Arctic are poorly quantified. In particular, methane emissions from the Arctic Ocean and the potential sink capacity are still under debate. In this context sea ice impact on and the intense cycling of methane between sea ice and Polar surface water (PSW) becomes pivotal. We report on methane super- and under-saturation in PSW in the Eurasian Basin (EB), strongly linked to sea ice-ocean interactions.
In the southern EB under-saturation in PSW is caused by both inflow of warm Atlantic water and short-time contact with sea ice. By comparison in the northern EB long-time sea ice-PSW contact triggered by freezing and melting events induces a methane excess. We reveal the Transpolar Drift Stream as crucial for methane transport and show that inter-annual shifts in sea ice drift patterns generate inter-annually patchy methane excess in PSW.
Using backward trajectories combined with δ18O signatures of sea ice cores we determine the sea ice source regions to be in the Laptev Sea Polynyas and the off shelf regime in 2011 and 2015, respectively. We denote the Transpolar Drift regime as decisive for the fate of methane released on the Siberian shelves.
From the study conclusions: Our study is focused on sea ice-ocean interaction, while the role of sea ice–air fluxes and oxidation as pathways of methane in the Arctic need further investigation.
Our study confirms that methane release from sea ice is coupled to the ice freeze and melt cycle. Hence the intensity of freeze events in winter and the amount of summer sea ice retreat primarily triggers how much methane is released during transport within the TDS in the central Arctic.
To which extent the interior Arctic Ocean might act as a final or just a temporal sink, i.e. with final efflux to the atmosphere, is another open question. Furthermore, sea ice retreat, thinning, and decreasing multiyear and increasing first-year sea ice will have, yet, unconsidered consequences for the sea ice-air exchange and the source-sink balance of the greenhouse gas methane in the Arctic. In addition to the potential source capacity for efflux from the northern Eurasian Basin, the potential sink capacity of the southern EB for atmospheric methane might be enhanced if the volume of inflowing AW increases and the region becomes seasonally ice free in the future.
How the Ocean Processes Methane
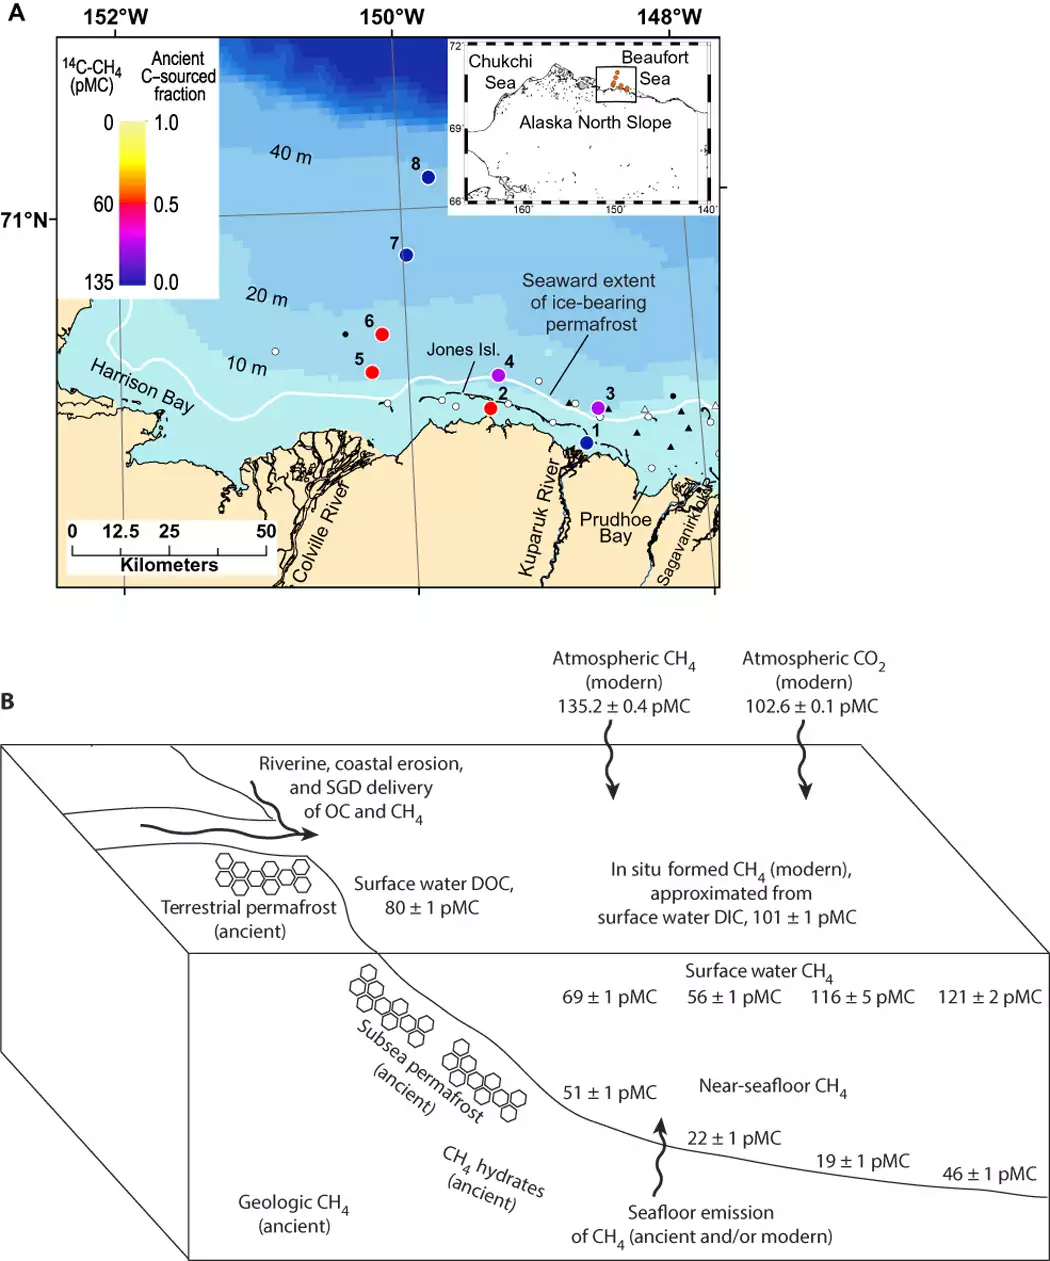
Another study looks at ancient stored methane in the Arctic in relation to ongoing natural fluxes that were the focus of the above research. The paper is described in a Science Daily article Release of ancient methane due to changing climate kept in check by ocean waters by Katy J. Sparrow, John D. Kessler et al. 2018

Trapped in ocean sediments near continents lie ancient reservoirs of methane called methane hydrates. These ice-like water and methane structures encapsulate so much methane that many researchers view them as both a potential energy resource and an agent for environmental change. In response to warming ocean waters, hydrates can degrade, releasing the methane gas. Scientists have warned that release of even part of the giant reservoir could significantly exacerbate ongoing climate change.
However, methane only acts as a greenhouse gas if and when it reaches the atmosphere — a scenario that would occur only if the liberated methane travelled from the point of release at the seafloor to the surface waters and the atmosphere.
A team of scientists conducted fieldwork just offshore of the North Slope of Alaska, near Prudhoe Bay. Sparrow calls the spot “ground zero” for oceanic methane emissions resulting from ocean warming. In some parts of the Arctic Ocean, the shallow regions near continents may be one of the settings where methane hydrates are breaking down now due to warming processes over the past 15,000 years. In addition to methane hydrates, carbon-rich permafrost that is tens of thousands of years old — and found throughout the Arctic on land and in seafloor sediments — can produce methane once this material thaws in response to warming. With the combination of the aggressive warming occurring in the Arctic and the shallow water depths, any released methane has a short journey from emission at the seafloor to release into the atmosphere.
“We do observe ancient methane being emitted from the seafloor to the overlying seawater, confirming past suspicions,” Kessler says. “But, we found that this ancient methane signal largely disappears and is replaced by a different methane source the closer you get to the surface waters.” The methane at the surface is instead from recently produced organic matter or from the atmosphere.
“We found that very little ancient methane reaches surface waters even in the relatively shallow depths of 100 feet. Exponentially less methane would be able to reach the atmosphere in waters that are thousands of feet deep at the very edge of the shallow seas near continents, which is the area of the ocean where the bulk of methane hydrates are,” Sparrow says. “Our data suggest that even if increasing amounts of methane are released from degrading hydrates as climate change proceeds, catastrophic emission to the atmosphere is not an inherent outcome.”
Full text of study is Limited contribution of ancient methane to surface waters of the U.S. Beaufort Sea shelf
Summary
It seems our knowledge of Arctic methane is incomplete but growing. It is good news to understand how ancient methane released from sediment is neutralized by ocean processes before it can be released. And it is also good that methane captured by shelf sea ice is transported to the North Pole.
Footnote:
The news releases repeat the erroneous claim that methane (CH4) is 25 times more powerful GHG than CO2. That exaggerated number comes from comparing the two gases on a mass basis. Because CH4 has a lesser atomic weight, a kilogram will have more molecules than the same mass of CO2. But radiative activity depends on the volume, not the mass.
More background on CH4 as a GHG: Much Ado About Methane
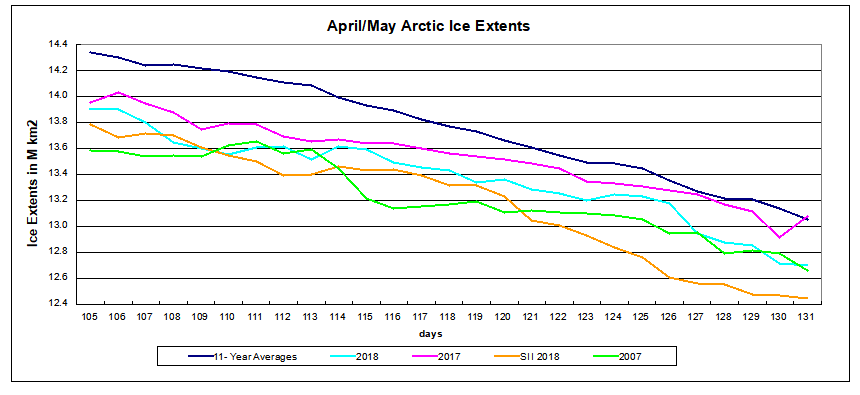


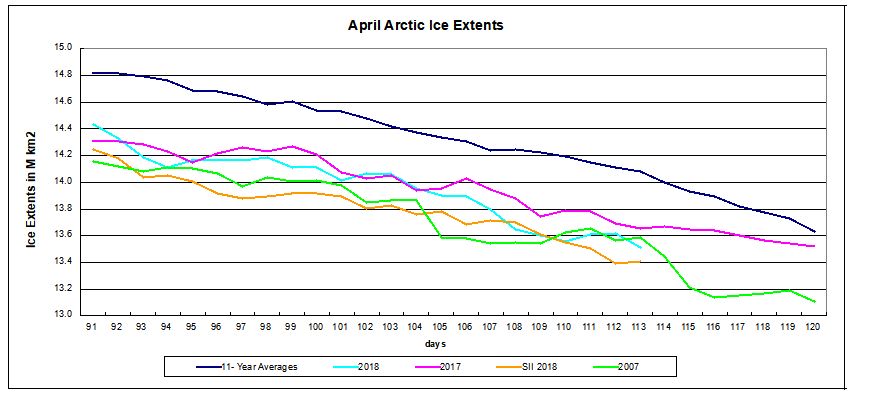

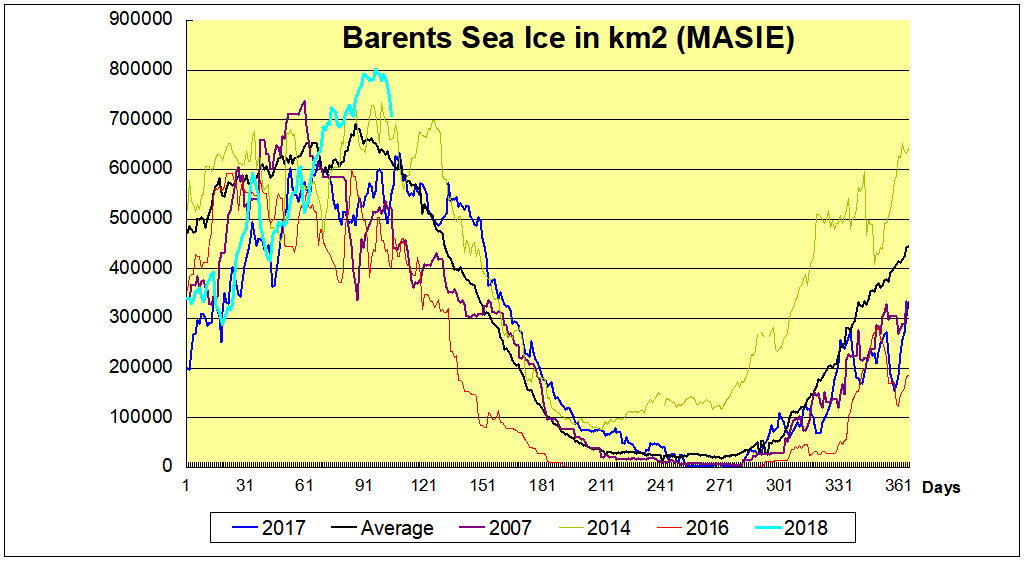

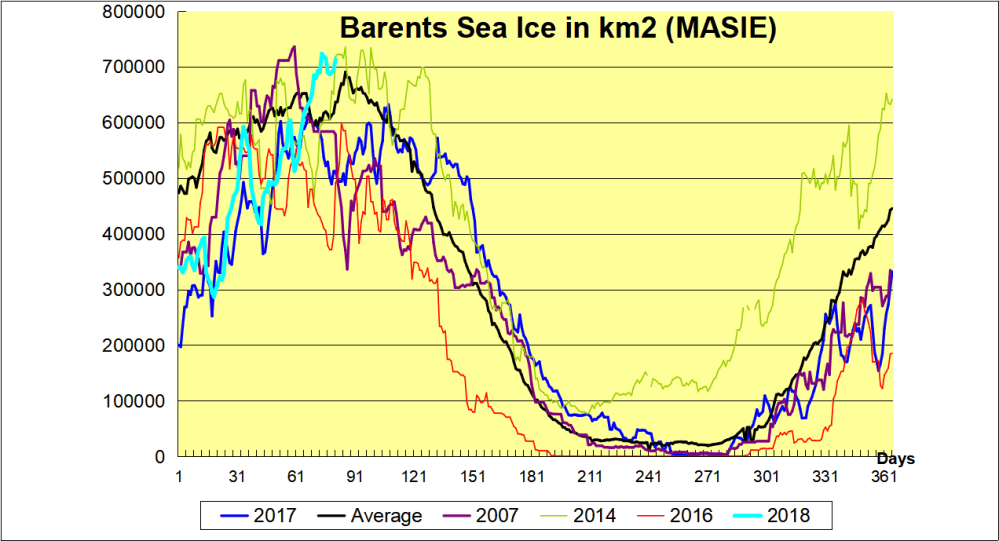
 The month of March saw rapid ice growth in Barents Sea. It is in a strategic location at the gateway where warm Atlantic water from the gulf stream flows into the Arctic, 90% of all incoming water. In 31 days, the extent went from 513k km2 to 790k km2, a gain of 278k km2, or 54%. As the graph below shows, Barents ice today is unusual in the last 12 years.
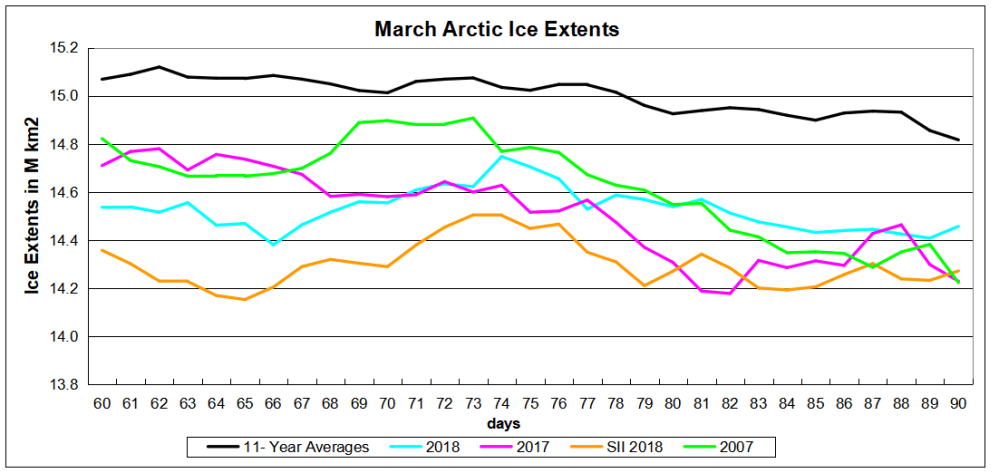
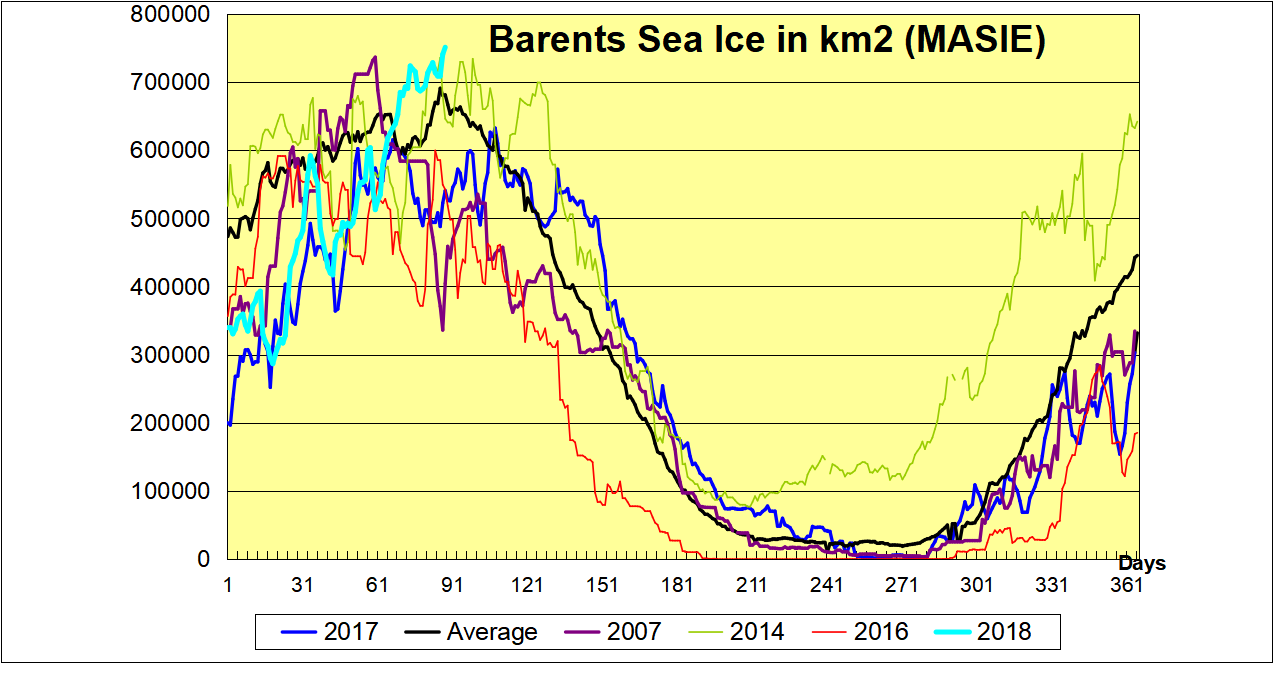
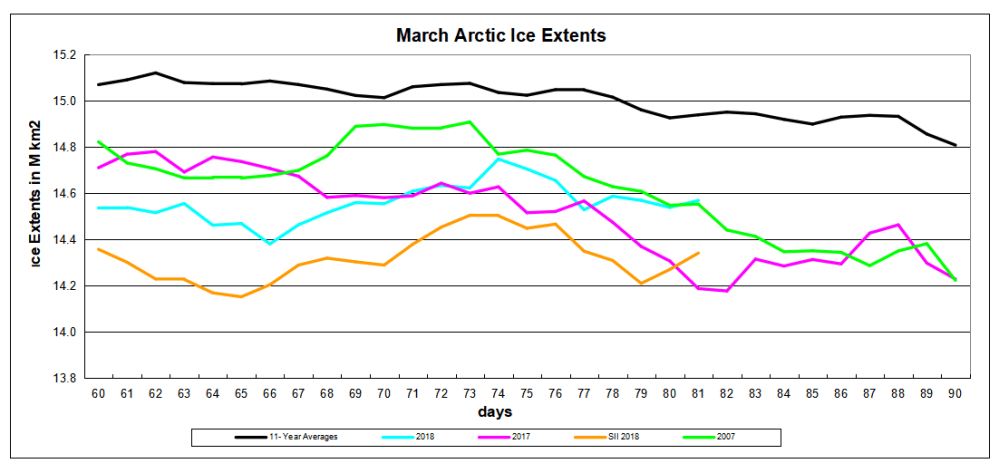
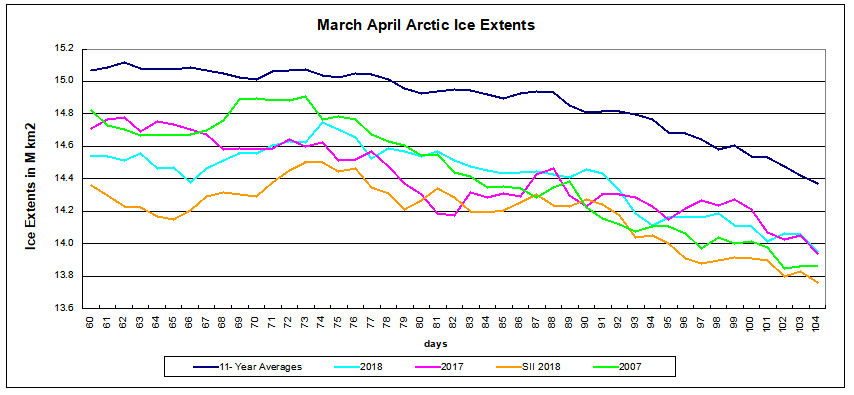
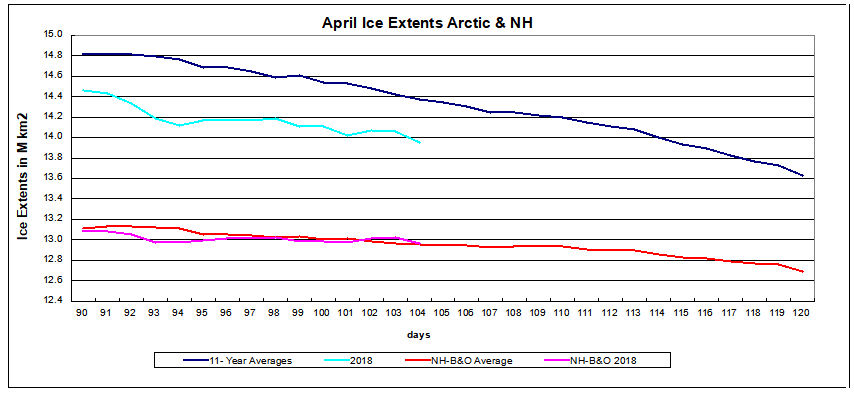
 After a slow beginning this month, Arctic ice advanced to set a late annual maximum, and is now holding on to its gains the last four days. The image above shows the last week, setting new 2018 maximums on day 74 for NH overall, as well in Barents Sea. The graph below shows that as of yesterday, Barents is well above the 11 year average, and matching 2014 the highest year in the decade.