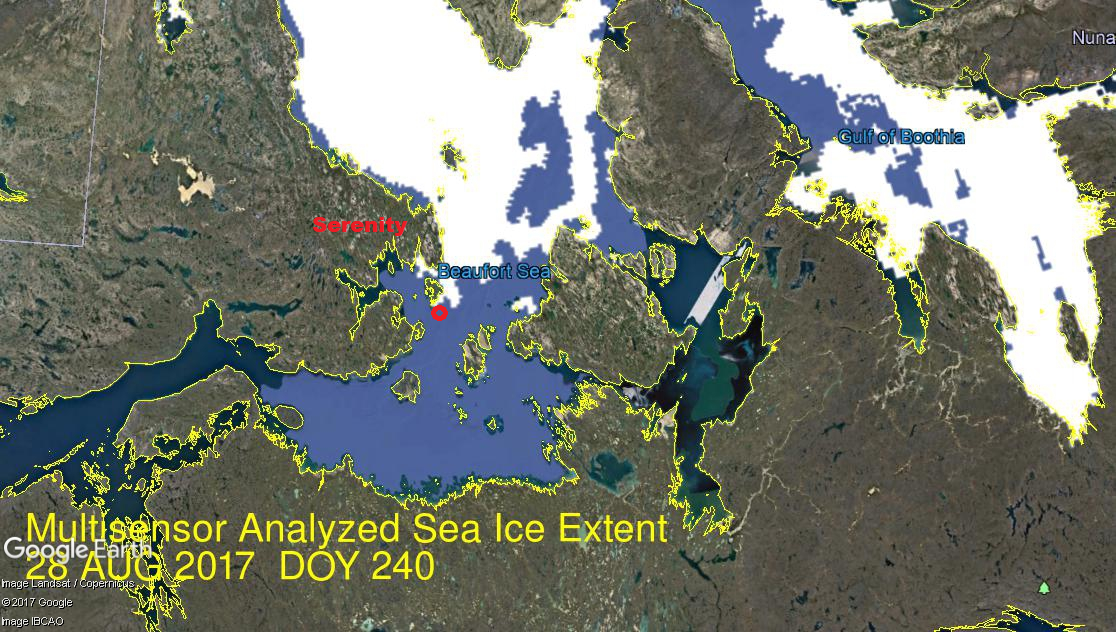
Serenity on the Ice Edge
Click on image to enlarge.
The location of Crystal Serenity and her icebreaker as of 14:00 EST today with the ice chart from MASIE for yesterday. It looks like they are up against it now.
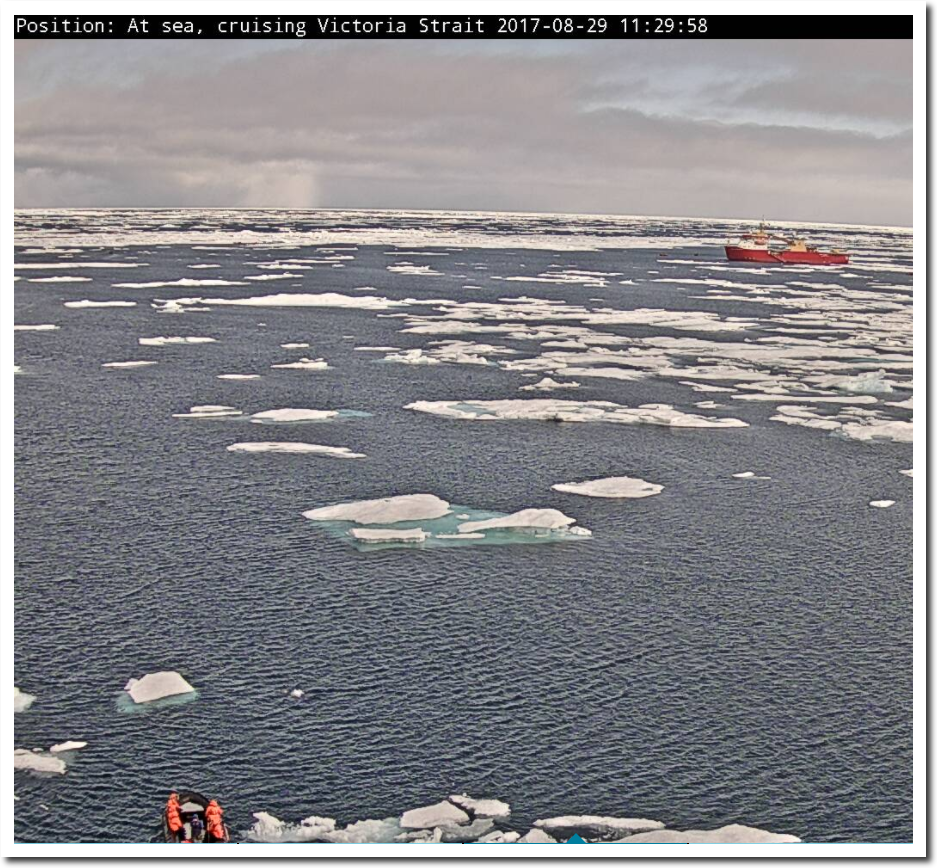
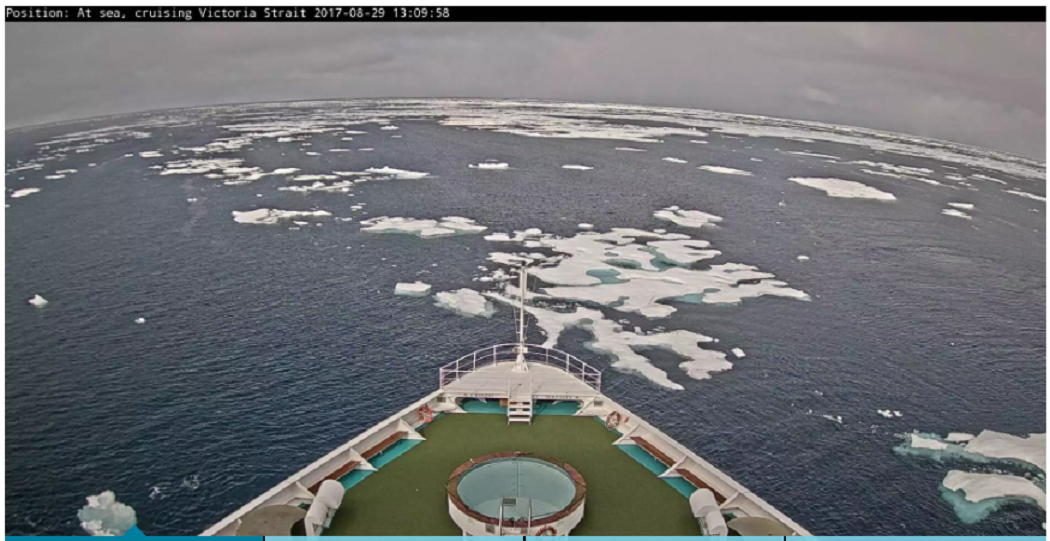
Serenity ship cam h/t Tony Heller
Click on image to enlarge.
The location of Crystal Serenity and her icebreaker as of 14:00 EST today with the ice chart from MASIE for yesterday. It looks like they are up against it now.
Serenity ship cam h/t Tony Heller
Click on image to enlarge.
The image above shows ice extents for yesterday, day 239, from 2007 to 2017. Particularly interesting is the variation in the CAA (Canadian Arctic Archipelago), crucial for the Northwest Passage. (The region is located just north of the word “Sea” in gold.) Note that 2016 was a fine year for cruising with the passage completely open at this date. That was not the case in 2014, and this year also has places frozen solid.

Crystal Serenity is going through the Northwest Passage again this year, having left Seward Alaska on Aug. 15, 2017. She arrives at Cambridge Bay today, having traveled in the wake of icebreaker RRS Ernest Shackleton. The next part of the voyage could be challenging.

The graph of August NH ice extents shows 2017 has moved above the decadal average in recent days. (Ten-year average is for 2007 to 2016 inclusive)
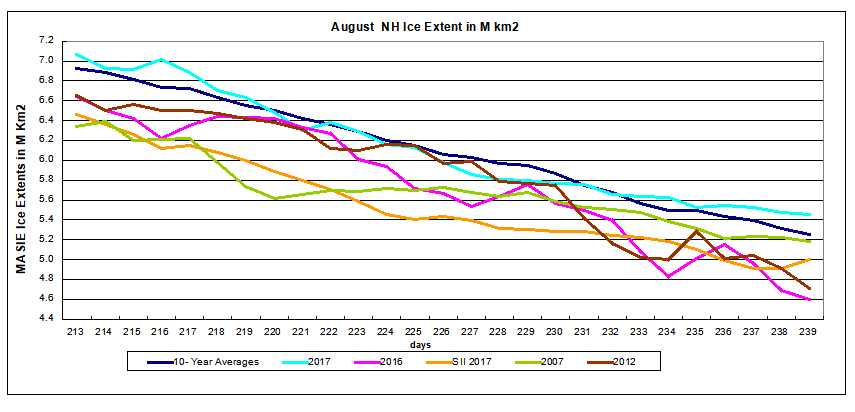
This year is now 850k km2 greater than 2016 and exceeds the 10 year average by 200k km2. SII (Sea Ice Index) 2017 is also 450k km2 lower. A previous post Beware the Arctic Storms of August discussed how late summer storms have dramatic impacts, and the graph shows both 2012 and 2016 plummeting in the last ten days. By the end of the month in four days, those two years will go below 4.4M km2.
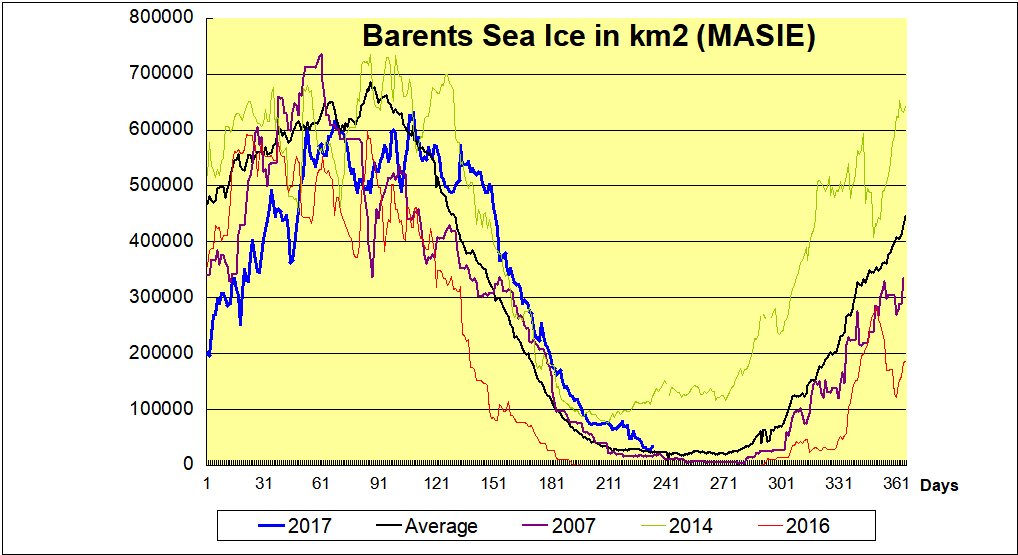
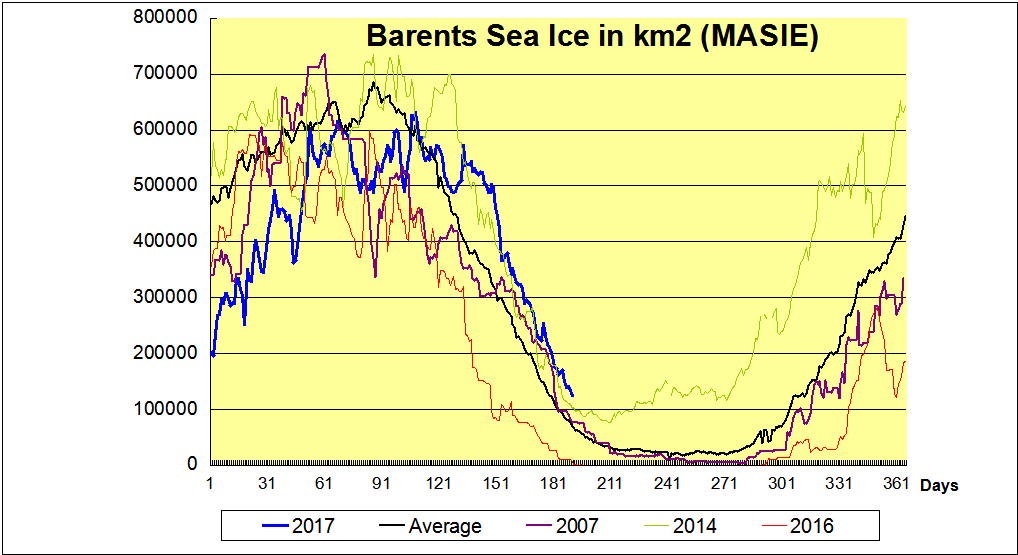
By the way, Barents is still above average and holding steady near 50k km2.

The black line is average for the last 11 years. 2007 in purple appears close to an average year. 2014 had the highest annual extent in Barents Sea, due to higher and later maximums, holding onto ice during the summer, and recovering quickly. In contrast, 2016 was the lowest annual extent, melting out early and recovering later. 2017 in blue started out way behind, but grew rapidly to reach average, and then persisted longer to exceed even 2014. It will be important to see when the recovery of ice begins.
For more on why Barents Sea matters see Barents Icicles

Footnote
Some people unhappy with the higher amounts of ice extent shown by MASIE continue to claim that Sea Ice Index is the only dataset that can be used. This is false in fact and in logic. Why should anyone accept that the highest quality picture of ice day to day has no shelf life, that one year’s charts can not be compared with another year? Researchers do this, including Walt Meier in charge of Sea Ice Index. That said, I understand his interest in directing people to use his product rather than one he does not control. As I have said before:
MASIE is rigorous, reliable, serves as calibration for satellite products, and continues the long and honorable tradition of naval ice charting using modern technologies. More on this at my post Support MASIE Arctic Ice Dataset

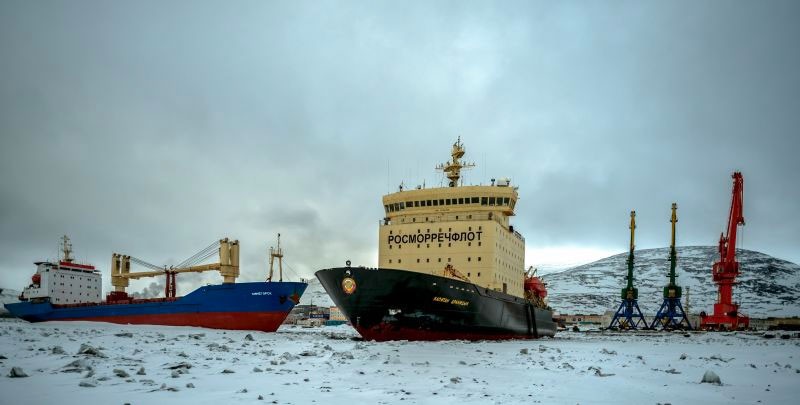
Crystal Serenity and escort near Cambridge Bay in 2016.

Its strong, ultra-lightweight steel reinforced hull makes it the largest commercial ship to receive Arc7 certification and allows it to sail through ice up to 2.1 meters thick.
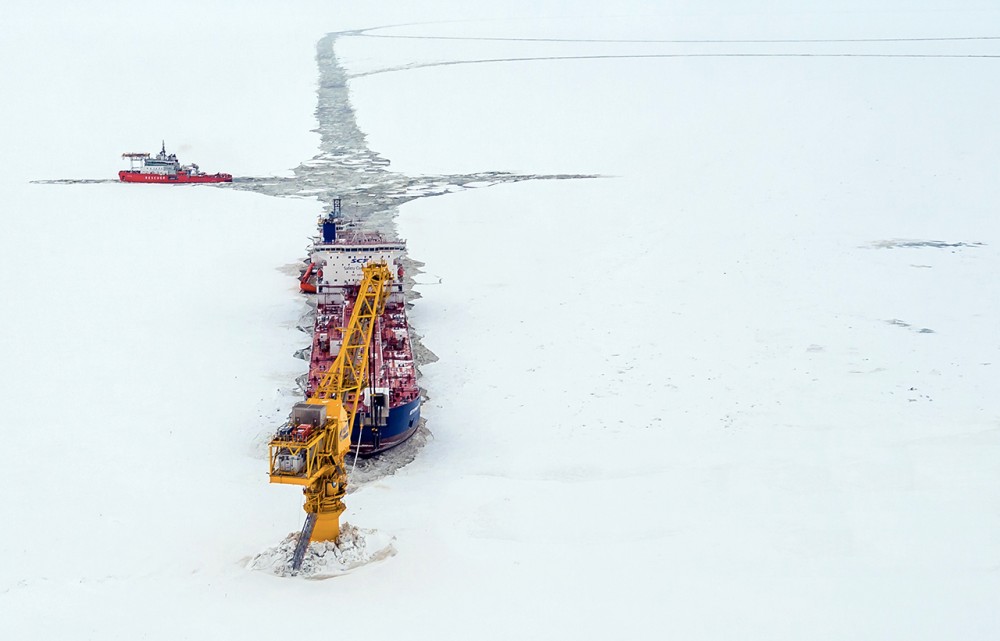
Alarmist media like the Guardian are claiming this event signals the demise of Arctic ice, when in fact it is a triumph of modern technology over natural challenges. Headlines are announcing a tanker transited the Northern Sea Route (NSR) without icebreaker escort, neglecting to mention that the vessel in question is an icebreaker that functions as a tanker.

Operated by Sovcomflot on behalf of Total, Novatek, CNPC and the Silk Road Fund, this 300 meter long carrier has a capacity of 172,600 cubic meters of LNG.
From Total Inaugurates the Northern Sea Route with LNG Carrier Christophe de Margerie
It’s on its way! After loading its cargo at the Snøhvit LNG export terminal in Norway, in which Total has an 18.4% interest, the Christophe de Margerie is taking the Northern Sea Route to Boryeong in South Korea, where it will deliver a cargo for Total Gas & Power. It’s the first unescorted merchant LNG vessel ever to take this route, which makes it possible to reach Asia via the Bering Strait in 15 days versus 30 days via the Suez Canal.

This technological feat was made possible through the participation of Total teams to the design of these next-generation LNG carriers. Compilations of technology, they efficiently transport large quantities of LNG year-round, without requiring escort icebreakers during the period from July to November. The Christophe de Margerie is the first of a total of 15 planned LNG carriers that will be gradually deployed.
They have been specially designed for Yamal LNG, a flagship Total project (20%) in northern Russia to develop the giant onshore South Tambey gas and condensate field with the construction of a liquefaction plant. Ultimately, close to 16.5 million tons of LNG a year will transit through the port of Sabetta, built specifically for the project.
Energy companies are planning for ice and are building equipment to deal with it. It is not evidence of global warming but human ingenuity.
Click on image to enlarge.
The image above shows ice extents for day 233 from 2007 to 2017. Particularly interesting is the variation in the CAA (Canadian Arctic Archipelago), crucial for the Northwest Passage. (The region is located just north of the words “Ice Extent” in gold.) Note that 2016 was a fine year for cruising with the passage completely open at this date. That was not the case in 2014, and this year is also frozen solid.
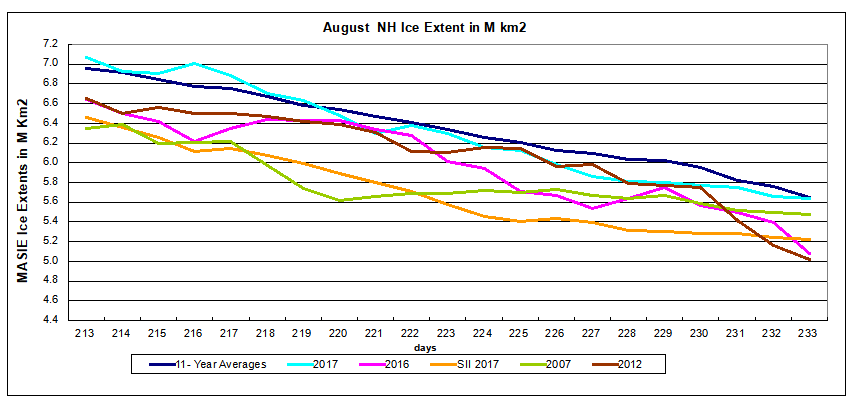
The graph of August NH ice extents shows 2017 virtually tied with the decadal average as of yesterday. This year is now 550k km2 greater than 2016 and exceeds 2007 by 250k km2. SII (Sea Ice Index) 2017 is also 400k km2 lower. A previous post Beware the Arctic Storms of August discussed how late summer storms have dramatic impacts, and the graph shows both 2012 and 2016 plummeting in the last five days. By the end of the month in nine days, those two years will go below 4.4M km2.
The Table compares 2017 day 233 ice extents with the decadal average and 2007. it is evident that this year’s extents are in surplus on the Canadian side and Central Arctic, offset by deficits on the Pacific side.
| Region | 2017233 | Day 233 Average |
2017-Ave. | 2007234 | 2017-2007 |
| (0) Northern_Hemisphere | 5634884 | 5652704 | -17820 | 5388004 | 246880 |
| (1) Beaufort_Sea | 569472 | 643245 | -73773 | 731647 | -162175 |
| (2) Chukchi_Sea | 285855 | 399788 | -113934 | 222895 | 62959 |
| (3) East_Siberian_Sea | 386603 | 517871 | -131268 | 81989 | 304614 |
| (4) Laptev_Sea | 308812 | 244158 | 64655 | 295384 | 13428 |
| (5) Kara_Sea | 65151 | 86439 | -21288 | 161780 | -96628 |
| (6) Barents_Sea | 33482 | 22883 | 10599 | 18656 | 14826 |
| (7) Greenland_Sea | 184582 | 222908 | -38326 | 335976 | -151394 |
| (8) Baffin_Bay_Gulf_of_St._Lawrence | 92400 | 37803 | 54597 | 51008 | 41392 |
| (9) Canadian_Archipelago | 494273 | 353728 | 140546 | 325028 | 169245 |
| (10) Hudson_Bay | 34936 | 43613 | -8677 | 61078 | -26141 |
| (11) Central_Arctic | 3178159 | 3079193 | 98966 | 3101306 | 76853 |
By the way, Barents is still above average and just added some ice.
The black line is average for the last 11 years. 2007 in purple appears close to an average year. 2014 had the highest annual extent in Barents Sea, due to higher and later maximums, holding onto ice during the summer, and recovering quickly. In contrast, 2016 was the lowest annual extent, melting out early and recovering later. 2017 in blue started out way behind, but grew rapidly to reach average, and then persisted longer to exceed even 2014. It will be important to see when the recovery of ice begins.
For more on why Barents Sea matters see Barents Icicles
Summary and Outlook

As discussed above, weather these few weeks will determine the fate of ice extents. Here is the Arctic Oscillation and Polar Vortex Analysis and Forecast from August 21, 2017 by Dr. Judah Cohen from Atmospheric and Environmental Research (AER).
The AO is currently neutral (Figure 1), reflective of mostly mixed geopotential height anomalies across the Arctic and mixed geopotential height anomalies across the mid-latitudes of the NH (Figure 2). Geopotential height anomalies are also mixed across Greenland and Iceland (Figure 2), and therefore the NAO is also neutral. However blocking/high pressure will strengthen first across Northern Canada and eventually across Greenland forcing the AO/NAO into negative territory over the next two weeks.

New snowfall is also predicted over the Arctic sea ice over the coming two weeks, a sign that the Arctic sea ice melt season is coming to an end. It was never in doubt that once again Arctic sea ice would be well below normal this summer. However predicted new snowfall will retard sea ice melt and a new record low minimum seems unlikely. The trajectory of sea ice extent seems similar to 2007, 2011, 2015 and 2016 and will likely bottom out close to those group of years. If the melt season ends early then there is even an outside chance it could even match the years of 2008 and 2010.
Footnote
Some people unhappy with the higher amounts of ice extent shown by MASIE continue to claim that Sea Ice Index is the only dataset that can be used. This is false in fact and in logic. Why should anyone accept that the highest quality picture of ice day to day has no shelf life, that one year’s charts can not be compared with another year? Researchers do this, including Walt Meier in charge of Sea Ice Index. That said, I understand his interest in directing people to use his product rather than one he does not control. As I have said before:
MASIE is rigorous, reliable, serves as calibration for satellite products, and continues the long and honorable tradition of naval ice charting using modern technologies. More on this at my post Support MASIE Arctic Ice Dataset

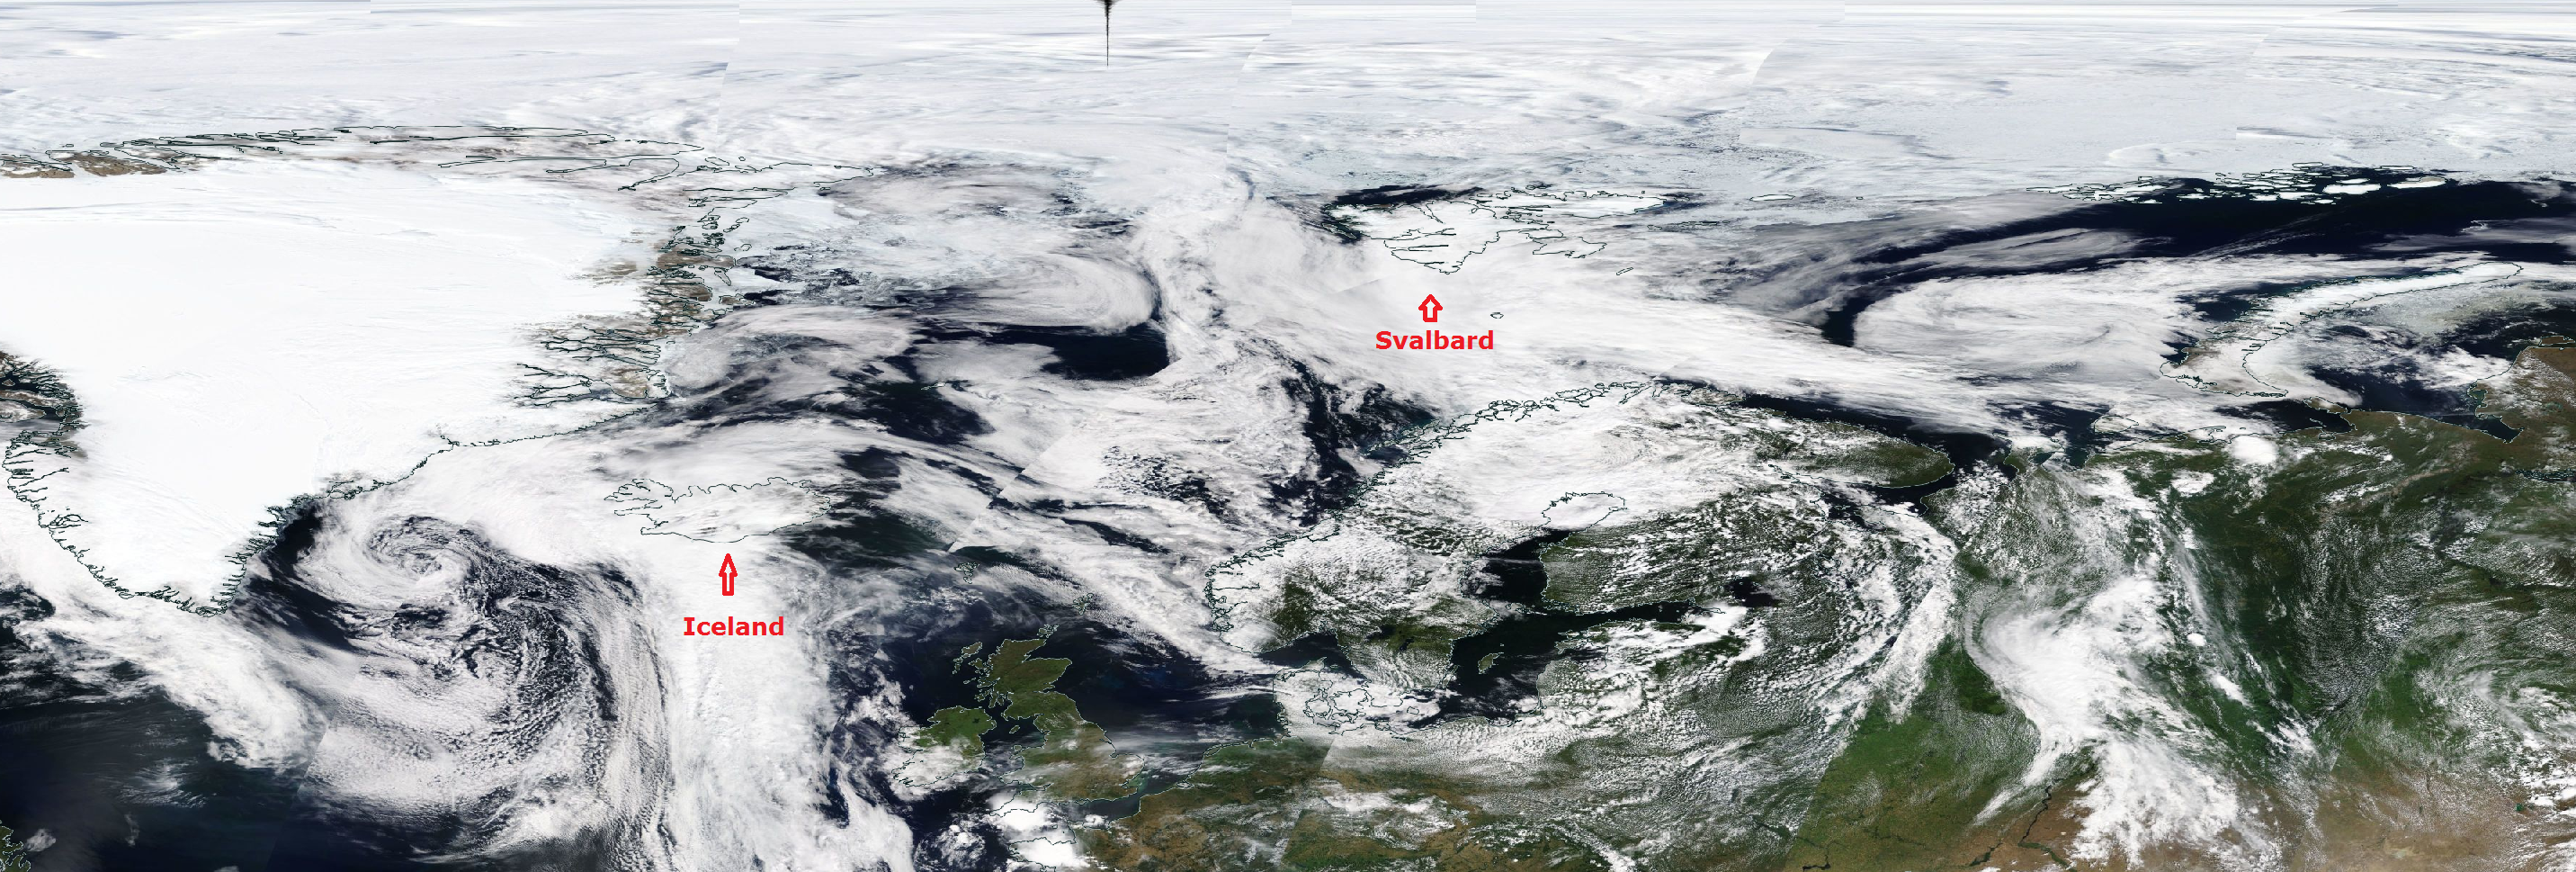
The Great Arctic Cyclone August 2012
The next two weeks will determine where this year’s minimum will rank compared to recent years. And much will depend upon storm activity which breaks up ice edges, compacts ice chunks and transports ice out through Fram Strait where it melts in the warmer Norwegian Sea.
We have two recent examples in 2012 and 2016. The Great Arctic Cyclone of 2012 produced the lowest minimum of the decade. The NASA photo of the storm is above. The image below presents the impact of the 2012 storm upon ice extents from mid-August to mid-September annual minimum. (Click on image to enlarge.)
In contrast, a more normal, non-stormy year is represented by 2014. Progression of ice extents for 2014 is shown below.
Then again in 2016 several sizable Arctic storms struck late August. The image below shows cyclonic winds (center left) over the Arctic Ocean on August 22, 2016.

The storms effect on 2016 sea ice appears in the image below.

Summary
Arctic ice extents these three years were not far apart mid-August, but they ended the melt season quite differently. The Great Arctic Cyclone made 2012 the lowest of the decade, bottoming out at 3.4M km2. 2016 August storms also produced a low annual minimum of 4.2M km2. In contrast, the absence of major storms in 2014 resulted in a much higher September minimum of 5.13M km2. All of these compare to 2007 minimum of 4.05M km2, with no major storms reported.
It is difficult to extract a climate signal out of fluctuating ice extent minimums when they are so dependent on the vagaries of weather events. It also means that anything can happen in the next few weeks.

Arctic sunset to occur in the next weeks. Nunavut is already having Civil Twilight, meaning the sun is less than 6 degrees below the horizon during the night.
The extent of Arctic ice fell to a new wintertime low in March 2017. But springtime ice persisted and extents since June are hanging around the decadal average. Below shows the last 27 days through yesterday, August 11, 2017.
For this period 2017 was mostly average or higher, continuing into August. This year is now almost 300k km2 greater than 2016 and exceeds 2007 by 600k km2. SII 2017 is also 600k km2 lower.
As we shall see, this year’s extents are in surplus on the Atlantic side, offset by deficits on the Pacific side. The image compares day 223 with the same day in 2007.

The Table compares 2017 day 223 ice extents with the decadal average and 2007.
| Region | 2017223 | Day 223 Average |
2017-Ave. | 2007223 | 2017-2007 |
| (0) Northern_Hemisphere | 6295153 | 6338630 | -43477 | 5690646 | 604507 |
| (1) Beaufort_Sea | 646803 | 740583 | -93779 | 767724 | -120921 |
| (2) Chukchi_Sea | 342601 | 479258 | -136657 | 261771 | 80831 |
| (3) East_Siberian_Sea | 411714 | 663564 | -251849 | 207590 | 204124 |
| (4) Laptev_Sea | 430221 | 329873 | 100349 | 310764 | 119458 |
| (5) Kara_Sea | 140411 | 123400 | 17011 | 215854 | -75443 |
| (6) Barents_Sea | 60001 | 28883 | 31118 | 15996 | 44005 |
| (7) Greenland_Sea | 236735 | 253185 | -16450 | 286393 | -49658 |
| (8) Baffin_Bay_Gulf_of_St._Lawrence | 207230 | 71011 | 136219 | 83942 | 123288 |
| (9) Canadian_Archipelago | 527348 | 439371 | 87977 | 361883 | 165465 |
| (10) Hudson_Bay | 70437 | 87621 | -17184 | 94262 | -23825 |
| (11) Central_Arctic | 3220493 | 3120642 | 99851 | 3083211 | 137282 |
Deficits to average are in the BCE region, and surpluses appear almost everywhere else. Ice is particularly strong in Laptev, Baffin, CAA and the Central Arctic.
The graph below shows Barents this year continues to be above average but fell behind the record year of 2014. After pausing at 70K km2, it dipped to 50k km2, then bounced back to 60k yesterday.

The black line is average for the last 11 years. 2007 in purple appears close to an average year. 2014 had the highest annual extent in Barents Sea, due to higher and later maximums, holding onto ice during the summer, and recovering quickly. In contrast, 2016 was the lowest annual extent, melting out early and recovering later. 2017 in blue started out way behind, but grew rapidly to reach average, and then persisted longer to exceed even 2014. It will be important to see when the recovery of ice begins.
For more on why Barents Sea matters see Barents Icicles
We are about 50 days away from the annual Arctic ice extent minimum, which typically occurs on or about day 260 (mid September). Some take any year’s slightly lower minimum as proof that Arctic ice is dying, but the image below shows day 260 over the last 10 years. The Arctic heart is beating clear and strong.

Click on image to enlarge.
Over this decade, the Arctic ice minimum has not declined, but looks like fluctuations around a plateau since 2007. By mid-September, all the peripheral seas have turned to water, and the residual ice shows up in a few places. The table below indicates where we can expect to find ice this next September.
| Arctic Regions | 2007 | 2010 | 2012 | 2014 | 2015 | 2016 | Average |
| Central Arctic Sea | 2.67 | 3.16 | 2.64 | 2.98 | 2.93 | 2.92 | 2.91 |
| BCE | 0.50 | 1.08 | 0.31 | 1.38 | 0.89 | 0.52 | 0.87 |
| LKB | 0.29 | 0.24 | 0.02 | 0.19 | 0.05 | 0.28 | 0.17 |
| Greenland & CAA | 0.56 | 0.41 | 0.41 | 0.55 | 0.46 | 0.45 | 0.46 |
| B&H Bays | 0.03 | 0.03 | 0.02 | 0.02 | 0.10 | 0.03 | 0.03 |
| NH Total | 4.05 | 4.91 | 3.40 | 5.13 | 4.44 | 4.20 | 4.45 |
BCE (Beaufort, Chukchi and East Siberian) on the Asian side are quite variable as the largest source of ice other than the Central Arctic itself. Greenland Sea and CAA (Canadian Arctic Archipelago) together hold almost 0.5M km2 of ice at minimum, fairly consistently. LKB are the European seas of Laptev, Kara and Barents, a smaller source of ice, but a difference maker some years, as Laptev was in 2016. Baffin and Hudson Bays are almost inconsequential.
For context, note that the average maximum has been 15M, so on average the extent shrinks to 30% of the March high before growing back the following winter.

Icebreaker “Kapitan Dranitsyn” has been trapped in Pevek along with two cargo vessels since early January. Photo: Rosmorport May30, 2017
In July, the Northern Sea Route (NSR) starts to open for commercial shipping. As previously reported here Arctic Ice Takes Revenge, a convoy of Russian cargo ships including icebreakers were trapped by January ice and were stranded in Pevek. May 30 they were able to leave port, but making it home to Arkhangelsk is still uncertain since plenty of ice remains in Eastern Siberian and Laptev seas.
More about the NSR shipping situation at the end of this post.
The image below shows the evolution of ice extents since 2007 along the Northern Sea Route. The principal challenge for shipping is Laptev sea, and secondarily East Siberian and Kara seas.

Click on image to enlarge.
The graph below shows Arctic ice extents comparing 2017 to the eleven-year average, to 2016 and 2007, as well as SII estimates.
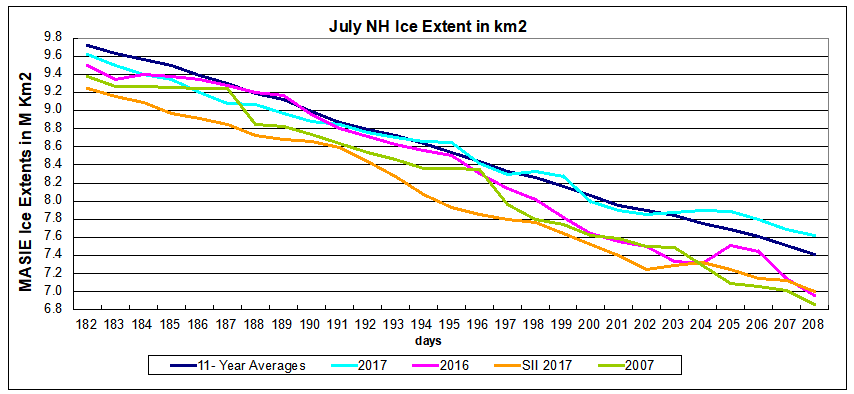
This year ice extents are ~200k km2 higher than average at day 208, 660k km2 greater than 2016, and 760k km2 surplus above 2007. MASIE, with its higher resolution mapping shows 600k km2 more ice than Sea Ice Index (SII).
The table below presents the ice extents in various regions of the Arctic Ocean.
| Region | 2017208 | Day 208 Average |
2017-Ave. | 2007208 | 2017-2007 |
| (0) Northern_Hemisphere | 7616280 | 7412179 | 204101 | 6854322 | 761958 |
| (1) Beaufort_Sea | 817086 | 800703 | 16383 | 731315 | 85771 |
| (2) Chukchi_Sea | 501448 | 576407 | -74959 | 410291 | 91157 |
| (3) East_Siberian_Sea | 655273 | 859194 | -203922 | 611838 | 43435 |
| (4) Laptev_Sea | 595803 | 493098 | 102705 | 346484 | 249320 |
| (5) Kara_Sea | 234885 | 216677 | 18208 | 263819 | -28935 |
| (6) Barents_Sea | 74162 | 33989 | 40173 | 38450 | 35713 |
| (7) Greenland_Sea | 429112 | 337523 | 91590 | 350141 | 78971 |
| (8) Baffin_Bay_Gulf_of_St._Lawrence | 351594 | 169554 | 182040 | 226232 | 125362 |
| (9) Canadian_Archipelago | 584766 | 603827 | -19062 | 585307 | -542 |
| (10) Hudson_Bay | 153623 | 172129 | -18506 | 114225 | 39398 |
| (11) Central_Arctic | 3217386 | 3146830 | 70556 | 3174877 | 42508 |
The only sizeable 2017 deficits to decadal average are in Chukchi and East Siberian seas. Ice surpluses this year offset the losses, especially in Laptev, Greenland Sea, Baffin Bay and the Central Arctic. Barents has been holding steady at the highest minimum of the decade, set by 2014. 2007 is eclipsed by 2017 in almost every region.
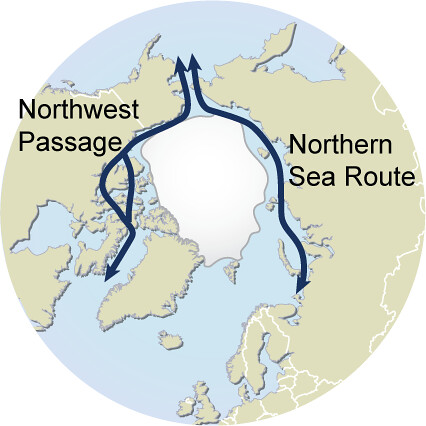
Varying Views of the Northern Sea Route

Text in image refers to events in 2013
Northern Sea Route Information Office
According to the data provided by the Northern Sea Route Information Office, traffic volume in 2016 has increased by 35% in comparison with 2015. However the traffic remained low with only 19 vessels using the route, far from the record set in 2013 with 71 vessels. Steep downturn started in 2014, the amount of cargo transported in transit dropping 77 per cent compared to the previous year.
The navigation season for transit passages on NSR starts approximately at the beginning of July and lasts through to the second half of November. There are no specific dates for commencement and completion of navigation; it all depends on particular ice conditions. In 2011 the navigation season on the NSR seaways for large vessels constituted 141 days in total, i.e. more than 4.5 months. In recent years quite easy ice conditions have been observed and that offers more considerable opportunities for operation at the NSR seaways. All NSR seaways are currently located in the area of one-year ice. In the arctic conditions one-year ice grows approximately up to 1.6 metres. Arktika-type icebreaker can open passages through up to 2.3m thick ice. In early July, at the beginning of navigation ice is not pressurized. The ice is broken and easily moved through. . . Therefore, in the current ice conditions vessels can navigate from July until December.
Malte Humpert, the strategic director and founder of the Arctic Institute
The NSR will not become a major shipping route. Not today and not in 2030 – or even 2050. As long as there is winter ice, which makes the Arctic Ocean unnavigable for part of the year, it will not be suitable for regular transit traffic.
There may be occasional voyages, as we have seen over the past few years, delivering timber from Finland to Canada, or Norwegian fish and LNG to Japan or iron ore to China. But the NSR will not see containerized cargo on which global trade operates. There are a host of reasons for that, the biggest ones being lack of schedule reliability and seasonability of the route, lack of ports of call and increased insurance premiums on the NSR over Suez.
As a comparison: the Suez Canal sees around 18,000 transits per year, the Panama Canal around 15,000, the Straits of Malacca around 65,000.
In the past five years taken together, the NSR saw around 200 transits, with most vessels being tiny compared to the giant container ships and bulk carriers passing through the world’s shipping hubs.
The 259 meters long, 34 meter wide «Shturman Albanov» in early May arrived in Murmansk with another load of oil from Novy Port, the new oil field in the Yamal Peninsula. It marked the 5th million ton of oil delivered from the field, operator Gazprom Neft informs.
In the course of the last 12 months, a total of 196 shiploads of oil have made from Yamal to Murmansk. Shipping company Sovcomflot now has three brand new Arc7 ice class tankers dedicated to shipments from the new Arctic field.
Source: NASA Worldview July 18, 2017. Click on image to enlarge.
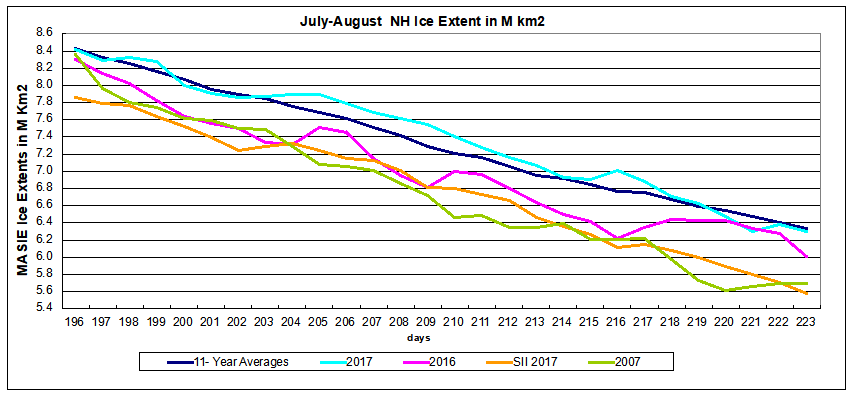
July is showing again the resilience of Arctic ice this year. The graph below shows 2017 extents for the first 19 days of July compared to the average for the previous 11 years, to 2016, to 2007 and the SII (Sea Ice Index) estimates for 2017.
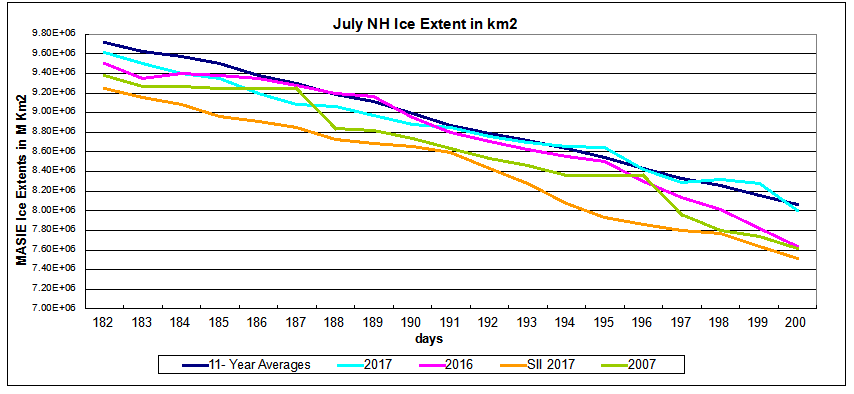
The graph shows 2017 holding to the decadal average and just yesterday dropping below 8M km2, one day ahead of average. Meanwhile the other extents are much lower than 2017: 2016 is down 357k km2, 2007 is 379k km2 down, and SII shows 2017 480k km2 less than MASIE day 200.
As we shall see, this year’s extents are in surplus on the Atlantic side, offset by deficits on the Pacific side and in Hudson Bay. The image shows the evolution of Arctic ice from 2007 to this year for day 200.
Click on image to enlarge.
The Table compares 2017 day 200 ice extents with the decadal average and 2007
| Region | 2017200 | Day 200 Average |
2017-Ave. | 2007200 | 2017-2007 |
| (0) Northern_Hemisphere | 7997823 | 8064957 | -67133 | 7618029 | 379795 |
| (1) Beaufort_Sea | 806596 | 819503 | -12906 | 797272 | 9324 |
| (2) Chukchi_Sea | 514591 | 619294 | -104704 | 488952 | 25638 |
| (3) East_Siberian_Sea | 744800 | 937942 | -193142 | 707353 | 37447 |
| (4) Laptev_Sea | 666317 | 584009 | 82308 | 455463 | 210854 |
| (5) Kara_Sea | 321934 | 310630 | 11304 | 377648 | -55714 |
| (6) Barents_Sea | 74053 | 45893 | 28160 | 55933 | 18120 |
| (7) Greenland_Sea | 478308 | 388587 | 89721 | 375816 | 102492 |
| (8) Baffin_Bay_Gulf_of_St._Lawrence | 371429 | 238537 | 132893 | 278443 | 92986 |
| (9) Canadian_Archipelago | 624373 | 685089 | -60717 | 686749 | -62376 |
| (10) Hudson_Bay | 172045 | 258697 | -86652 | 170690 | 1355 |
| (11) Central_Arctic | 3222235 | 3173093 | 49143 | 3221912 | 323 |
2007 overall ice extent on day 200 was lower by 380k km2, 2017 showing surpluses everywhere except Kara and CAA (Canadian Arctic Archipelago). Compared to the decadal average, the 2017 larger deficits are in the Pacific ( Chukchi and East Siberian) and in Canada (Hudson Bay and CAA). These are offset by above average extents elsewhere, especially in Laptev, Greenland, Baffin and Central Arctic. Barents is still surplus to average, but has now fallen behind 2014 as the highest in the last decade.
The black line is average for the last 11 years. 2007 in purple appears close to an average year. 2014 had the highest annual extent in Barents Sea, due to higher and later maximums, holding onto ice during the summer, and recovering quickly. In contrast, 2016 was the lowest annual extent, melting out early and recovering later. 2017 in blue started out way behind, but grew rapidly to reach average, and then persisted longer to exceed even 2014 before falling behind just recently.
For more on why Barents Sea matters see Barents Icicles

The extent of Arctic ice fell to a new wintertime low in March 2017. But springtime ice persisted and June and July are hanging around the decadal average.
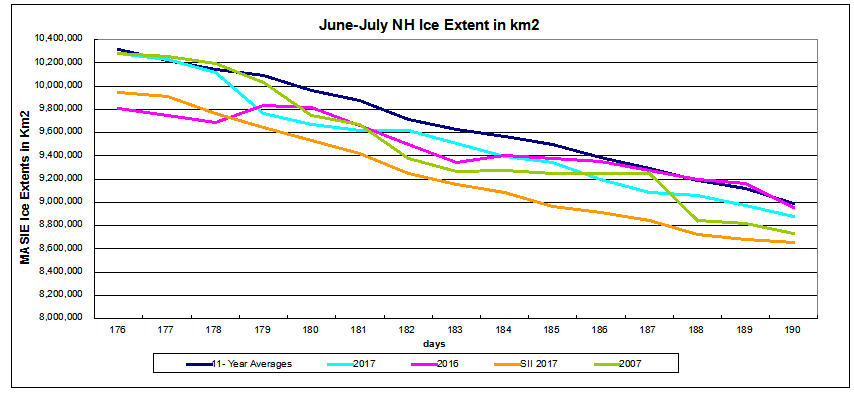
The graph shows the last two weeks ending day 190, July 9, 2017. 2016 and 2017 are nearly average and lower than 9M km2, while 2007 is about 150k km2 down, and SII 2017 even lower. The recent drop was largely due to Hudson Bay going to open water in just ten days (images at Ten Days in Hudson Bay).
As we shall see, this year’s extents are in surplus on the Atlantic side, offset by deficits on the Pacific side and in Hudson Bay. The image compares day 190 with one year ago.
The Table compares 2017 day 190 ice extents with the decadal average and 2007
| Region | 2017190 | Day 190 Average |
2017-Ave. | 2007190 | 2017-2007 |
| (0) Northern_Hemisphere | 8877716 | 8991896 | -114181 | 8732146 | 145570 |
| (1) Beaufort_Sea | 825960 | 866156 | -40196 | 860404 | -34443 |
| (2) Chukchi_Sea | 563718 | 683345 | -119626 | 609005 | -45287 |
| (3) East_Siberian_Sea | 868691 | 1000309 | -131618 | 871751 | -3060 |
| (4) Laptev_Sea | 719324 | 674515 | 44809 | 647038 | 72285 |
| (5) Kara_Sea | 538340 | 437243 | 101097 | 499369 | 38971 |
| (6) Barents_Sea | 125872 | 69548 | 56324 | 77180 | 48692 |
| (7) Greenland_Sea | 563021 | 450768 | 112253 | 475611 | 87410 |
| (8) Baffin_Bay_Gulf_of_St._Lawrence | 419134 | 364194 | 54941 | 379529 | 39606 |
| (9) Canadian_Archipelago | 702592 | 750592 | -48000 | 743621 | -41030 |
| (10) Hudson_Bay | 306542 | 499414 | -192873 | 360041 | -53499 |
| (11) Central_Arctic | 3243319 | 3183825 | 59494 | 3205488 | 37831 |
The deficits in BCE (Beaufort, Chukchi, East Siberian) are offset by surpluses elsewhere. 2017 would be above average were it not for the 193k km2 deficit in Hudson Bay.
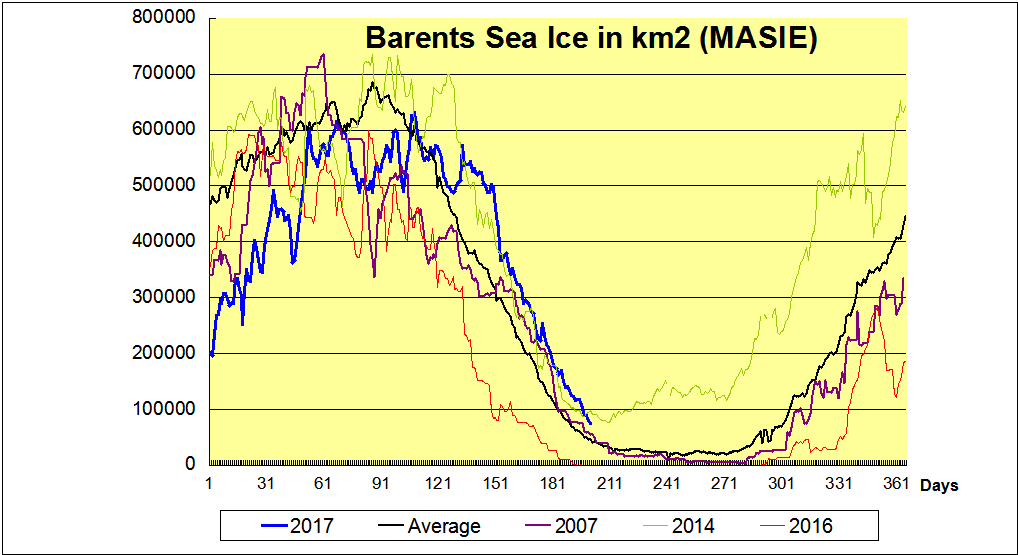
The graph below shows Barents this year continues to be above average matching the record year of 2014. It will be interesting to see if 2017 hits its minimum around day 210 like 2014 did.
The black line is average for the last 11 years. 2007 in purple appears close to an average year. 2014 had the highest annual extent in Barents Sea, due to higher and later maximums, holding onto ice during the summer, and recovering quickly. In contrast, 2016 was the lowest annual extent, melting out early and recovering later. 2017 in blue started out way behind, but grew rapidly to reach average, and then persisted longer to exceed even 2014. It may yet beat out 2014 as the highest in the last 11 years.
For more on why Barents Sea matters see Barents Icicles
