Resurging Arctic Ice Dec. 14

The regrowth of Arctic ice extent was slower than usual until recently. After showing resilience in September, ending higher than 2007, ice growth lagged in October, but is now rapidly ramping up toward the averages.  The map above shows the lack of ice is mainly in Hudson Bay and Barents Sea.  Kara, Bering and Chukchi seas have all rebounded and everything else is locked in ice.

arctic-ice-dec-13-2016

In the last 24 days, 2016 ice extent has grown by 123k km2 per day, compared to the 10-year average 79k km2 per day.  As of day 348, 2016 ice extent is ~3% less than average (2006 to 2015).  The chart also shows the variability of ice extent over the years during this season.  2015 was the highest ice recovery rate in the last decade, while 2007 was the slowest.  The chart also shows 2016 Sea Ice Index (SII) from NOAA has been lagging behind by more than 300k km2.

The table below shows this year compared to average and to 2007 for day 348.

Region 2016348 Day 348
Average
2016-Ave. 2007348 2016-2007
 (0) Northern_Hemisphere 11762663 12168943 -406279 11501915 260748
 (1) Beaufort_Sea 1070445 1069448 997 1062676 7769
 (2) Chukchi_Sea 937738 937789 -51 725062 212676
 (3) East_Siberian_Sea 1087137 1083777 3361 1053584 33553
 (4) Laptev_Sea 897845 897832 12 897845 0
 (5) Kara_Sea 742906 866952 -124046 800920 -58014
 (6) Barents_Sea 271463 352281 -80818 236964 34499
 (7) Greenland_Sea 494089 559862 -65773 488595 5494
 (8) Baffin_Bay_Gulf_of_St._Lawrence 846064 813794 32270 793616 52448
 (9) Canadian_Archipelago 853214 853007 207 852556 658
 (10) Hudson_Bay 820629 1085867 -265238 1217263 -396634
 (11) Central_Arctic 3200307 3211105 -10799 3186190 14116
 (12) Bering_Sea 227611 250748 -23137 54836 172775
 (13) Baltic_Sea 11782 10418 1364 2898 8884
 (14) Sea_of_Okhotsk 297235 166142 131093 127576 169659
 (15) Yellow_Sea 0 1278 -1278 0 0
 (16) Cook_Inlet 3055 6601 -3546 48 3007

Most of the deficit to average is in Kara, Barents, Greenland Sea and Hudson Bay.  Central Arctic, CAA, Bering Sea and BCE are all average, while Okhotsk and Baffin Bay are showing surpluses.  Presently 2016 ice extent is 260k km2 greater than 2007 with large surpluses in BCE, Baffin, Bering and Okhotsk Seas.  Only Hudson Bay and Kara were larger in 2007.

There is no need to panic over Arctic ice this year, or any year.  It fluctuates according to its own ocean-ice-atmospheric processes and we can only watch and be surprised since we know so little about how it all works.  Judah Cohen at AER thinks the much greater snowfall in October will make for a very cold winter.  We shall see.

cohen-schematic

https://rclutz.wordpress.com/2016/07/06/warm-is-cold-and-down-is-up/


Surging Arctic Ice Nov. 30

The growth of Arctic ice extent has been slower than usual this year.  After showing resilience in September, ending higher than 2007, ice growth lagged in October, and is only now ramping up toward the averages.  The map above shows the lack of ice is mainly in Hudson Bay, and the slow freezing of Kara and Barents Seas.  Everything else is locked in ice, except for some open water in Bering and Chukchi.

arctic-ice-nov-30-2016

In the last five weeks, 2016 ice growth has surged twice, firstly from day 303 to 314, and then the current surge the last 10 days starting day 325.  The chart also shows the variability of ice extent over the years during this season.  2015 was the highest ice recovery rate in the last decade, while 2006 was the lowest.  The chart also shows Sea Ice Index (SII) from NOAA is lagging over 300k km2 behind.

There is no need to panic over Arctic ice this year, or any year.  It fluctuates according to its own ocean-ice-atmospheric processes and we can only watch and be surprised since we know so little about how it all works.  Judah Cohen at AER thinks the much greater snowfall in October will make for a very cold winter.  We shall see.

cohen-schematic

https://rclutz.wordpress.com/2016/07/06/warm-is-cold-and-down-is-up/


Today’s Arctic Compares with 150 years ago

Imagery date refers to Google Earth capture of land forms. Ice extent is for August 31, 2016 from MASIE. Serenity is docked at Devon Island. Click to zoom in.

Imagery date refers to Google Earth capture of land forms. Ice extent is for August 31, 2016 from MASIE. Serenity is docked at Devon Island. Click to zoom in.

Researchers found that ice conditions in the 19th century were remarkably similar to today’s, observations falling within normal variability. The study is Accounts from 19th-century Canadian Arctic Explorers’ Logs Reflect Present Climate Conditions (here) by James E. Overland, Pacific Marine Environmental Laboratory/NOAA, Seattle,Wash., and Kevin Wood, Arctic Research Office/NOAA, Silver Spring, Md.   H/t GWPF

Overview

This article demonstrates the use of historical instrument and descriptive records to assess the hypothesis that environmental conditions observed by 19th-century explorers in the Canadian archipelago were consistent with a Little Ice Age as evident in proxy records.  We find little evidence for extreme cold conditions.

It is clear that the first-hand observations of 19th-century explorers are not consistent with the hypothesized severe conditions of a multi-decadal Little Ice Age. Explorers encountered both warm and cool seasons, and generally typical ice conditions, in comparison to 20th-century norms.

Analysis

There were more than seventy expeditions or scientific enterprises of various types dispatched to the Canadian Arctic in the period between 1818 and 1910. From this number, we analyzed 44 original scientific reports and related narratives; many from expeditions spanning several years. The majority of the data come from large naval expeditions that wintered over in the Arctic and had the capacity to support an intensive scientific effort. A table listing the expeditions and data types is located at http://www.pmel.noaa.gov/arctic/history. The data cover about one-third of the possible number of years depending on data type, and every decade is represented.

Our analysis focuses on four indicators of climatic change: summer sea ice extent, annual sea ice thickness, monthly mean temperature, and the onset of melt and freeze as estimated from daily mean temperature. Historical observations in these four categories were compared with modern reference data; the reference period varied, depending on data availability.  Both sea ice extent and the onset of melt and freeze were compared to the 30- year reference period 1971–2000; monthly means are compared to the 50-year period 1951–2000. Modern sea ice thickness records are less continuous, and some terminate in the 1980s; the reference period is therefore based on 19 to 26 years of homogeneous record.

arctic-explorers-fig1

Fig.1.

(a) Proxy record of standardized summer air temperature variation derived from ice cores taken on Devon Island. This proxy record suggests that a significantly colder climate prevailed in the 19th century. Shading indicates temperatures one standard deviation warmer or colder than average for the reference period 1901–1960 [Overpeck,1998].

(b) Historical monthly mean temperature observations compared to the 20th-century reference period 1951–2000. Sixty-three percent of 343 monthly mean temperatures recorded on 19th-century expeditions between 1819 and 1854 fall within one standard deviation of the reference mean at nearby stations (reference data from Meteorological Service of Canada,2002; and National Climatic Data Center,2002).

(c) Onset of melt observed by expeditions between 1820 and 1906 expressed as departures from the mean for the reference period 1971–2000. The period of melt transition observed by 19th century explorers is not inconsistent with modern values.

(d) Onset of freeze observed between 1819 and 1905 compared to the reference period 1971–2000. The onset of freeze transition is frequently consistent with modern values,but in some cases occurred earlier than usual. The incidence of an early onset of freeze represents the largest departure from present conditions evident in the historical records examined in this study. Melt and freeze transition dates for the reference period 1971–2000 were calculated from temperature data extracted from the Global Daily Climatology Network data base (National Climate Data Center, 2002).

arctic-explorers-fig2

Fig.2. The ship tracks and winter-over locations of Arctic discovery expeditions from 1818 to 1859 are surprisingly consistent with present sea ice climatology (contours represented by shades of blue). The climatology shown reflects percent frequency of sea ice presence on 10 September which is the usual date of annual ice minimum for the reference period 1971–2000 (Canadian Ice Service,2002). On a number of occasions,expeditions came within 150 km of completing the Northwest Passage, but even in years with unfavorable ice conditions, most ships were still able to reach comparatively advanced positions within the Canadian archipelago. By 1859, all possible routes comprising the Northwest Passage had been discovered.

Summary

As stated here before, Arctic ice is part of a self-oscillating system with extents expanding and retreating according to processes internal to the ocean-ice-atmosphere components. We don’t know exactly why 19th century ice extent was less than previously or less than the 1970s, but we can be sure it wasn’t due to fossil fuel emissions.

arctic-explorers-fig3rev

Explorers encountered both favorable and unfavorable ice conditions. This drawing from the vicinity of Beechey Island illustrates the situation of the H.M.S.Resolute and the steam-tender Pioneer on 5 September 1850 [from Facsimile of the Illustrated Arctic News,courtesy of Elmer E.Rasmuson Library,Univ.of AlaskaFairbanks].

October Arctic Ice Report and Outlook

google-2016305

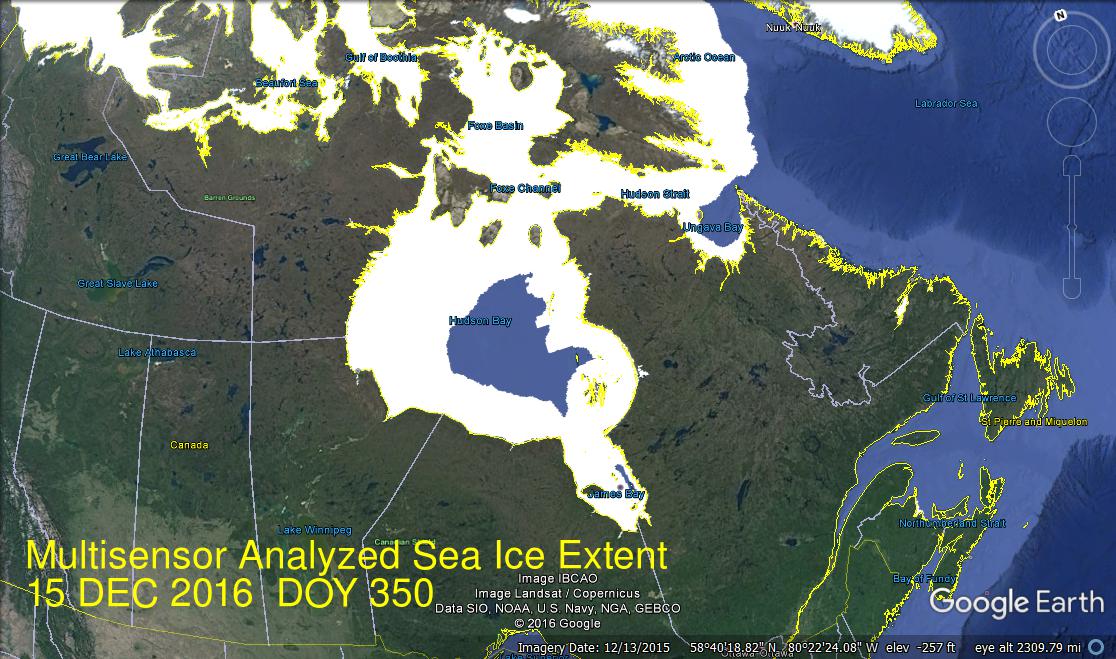
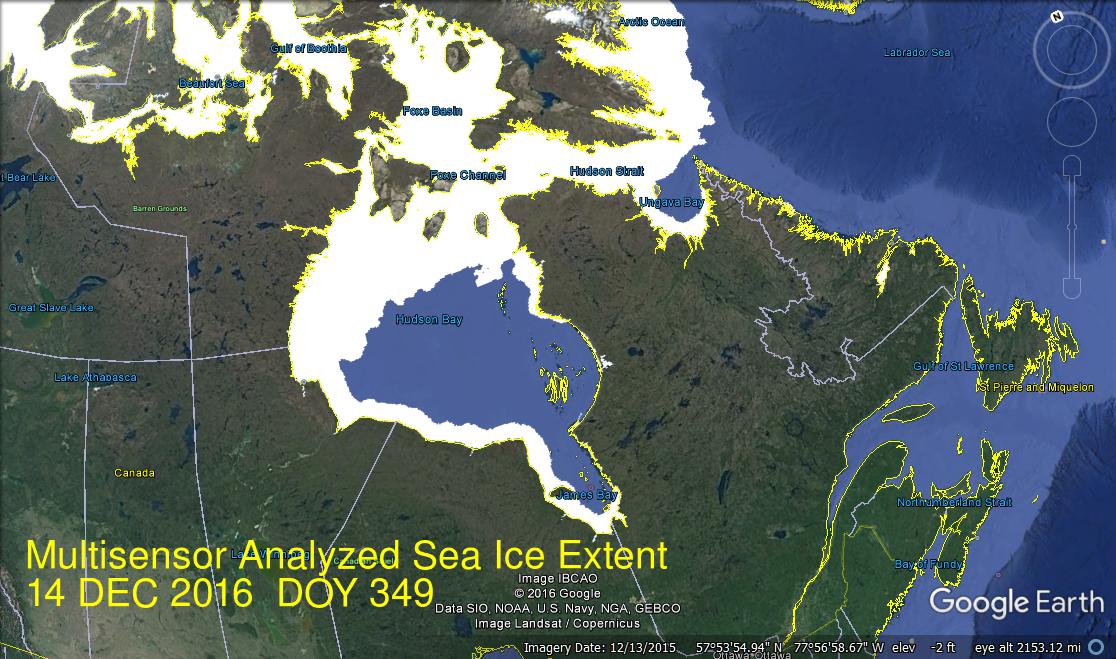
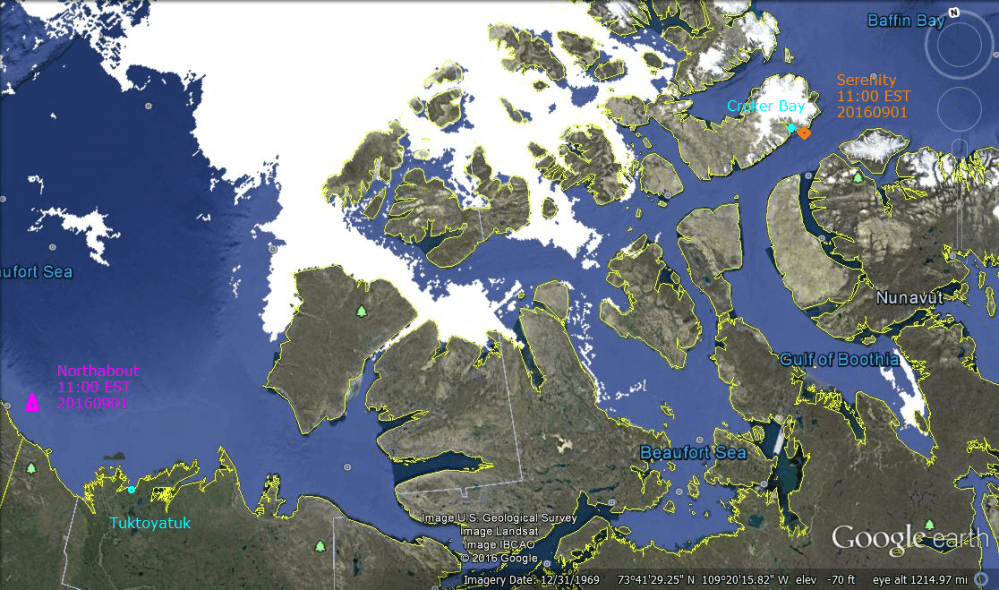
Imagery date refers to Google Earth capture of land forms. MASIE ice extent for October 31, 2016 is displayed. Click to zoom in.

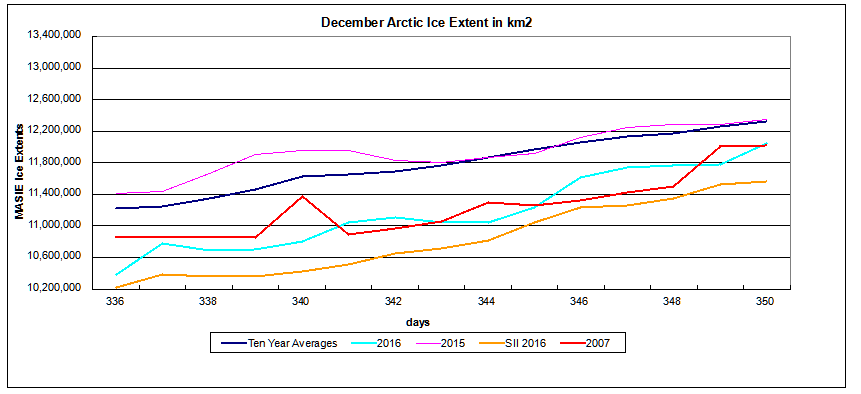
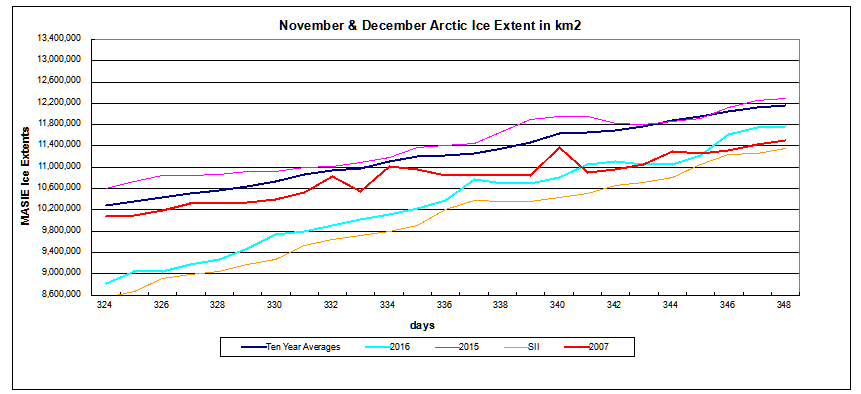
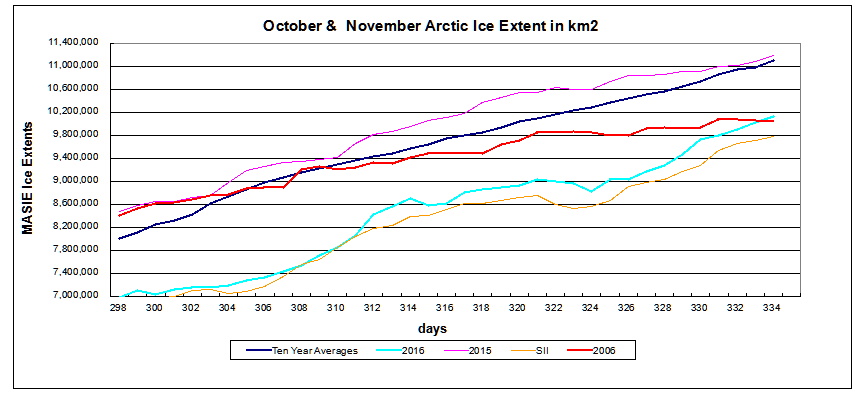
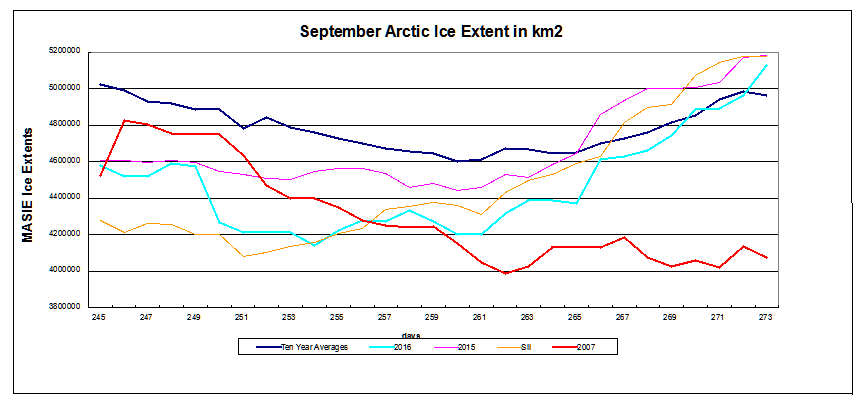
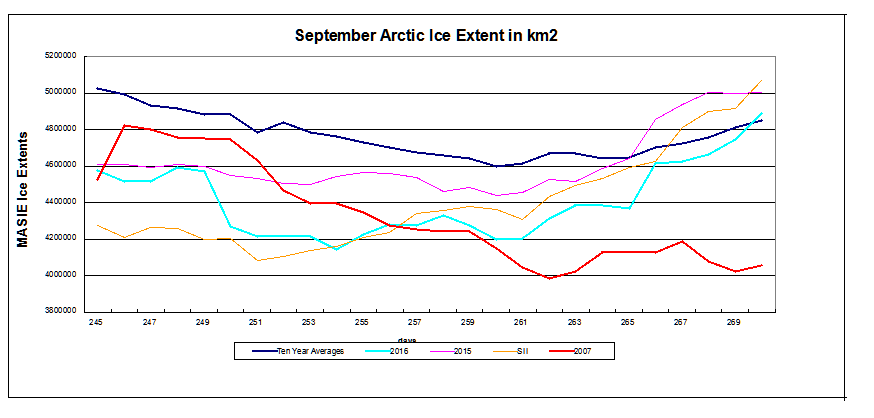
After showing resilience in September, Arctic ice growth faltered in October. The graph shows MASIE ice extents in 2016 in comparison with other years and with SII.

masie-2016-day305

Last year was above average recovery, while both SII and MASIE showed October 2016 well below average, and dropping down to 2007 levels.  Interestingly, MASIE and SII show virtually the same October average extent at 6.1M km2. This amount is 10% below the MASIE Oct. ten-year average, but that figure is 21% below SII ten-year average for Oct.

6.1M km2 is still higher than 2007 by 260k km2 despite the slower recovery this year. There is an anomaly in the 2007 record: a leap of almost 800k km2 on day 303, including E. Siberian Sea adding 460k km2 to more than double its ice extent on that day. Kara also jumped up 50% adding 100k km2. More about those two seas below.

The table shows by region the differences from ten-year MASIE averages for day 305, October 31.

Region 2016305 Day 305 Average 2016-Ave.
 (0) Northern_Hemisphere 7283405 8865912 -1582506
 (1) Beaufort_Sea 769445 998163 -228718
 (2) Chukchi_Sea 276157 506472 -230315
 (3) East_Siberian_Sea 600113 1001404 -401291
 (4) Laptev_Sea 897773 897591 182
 (5) Kara_Sea 162641 559477 -396837
 (6) Barents_Sea 24522 120163 -95641
 (7) Greenland_Sea 319983 446472 -126489
 (8) Baffin_Bay_Gulf_of_St._Lawrence 262586 260072 2514
 (9) Canadian_Archipelago 728911 782867 -53956
 (10) Hudson_Bay 76561 90864 -14303
 (11) Central_Arctic 3155443 3190140 -34696

Clearly in the table and in the image at the top, ice is missing mostly in the BCE region on the Asian side (Beaufort, Chukchi, E. Siberian) and in Kara and Barents on the European side.

What’s Up with Arctic Ice

For some answers let’s turn first to Dr. Judah Cohen of AER.  His analysis is thorough and interesting (here).  Excerpts:

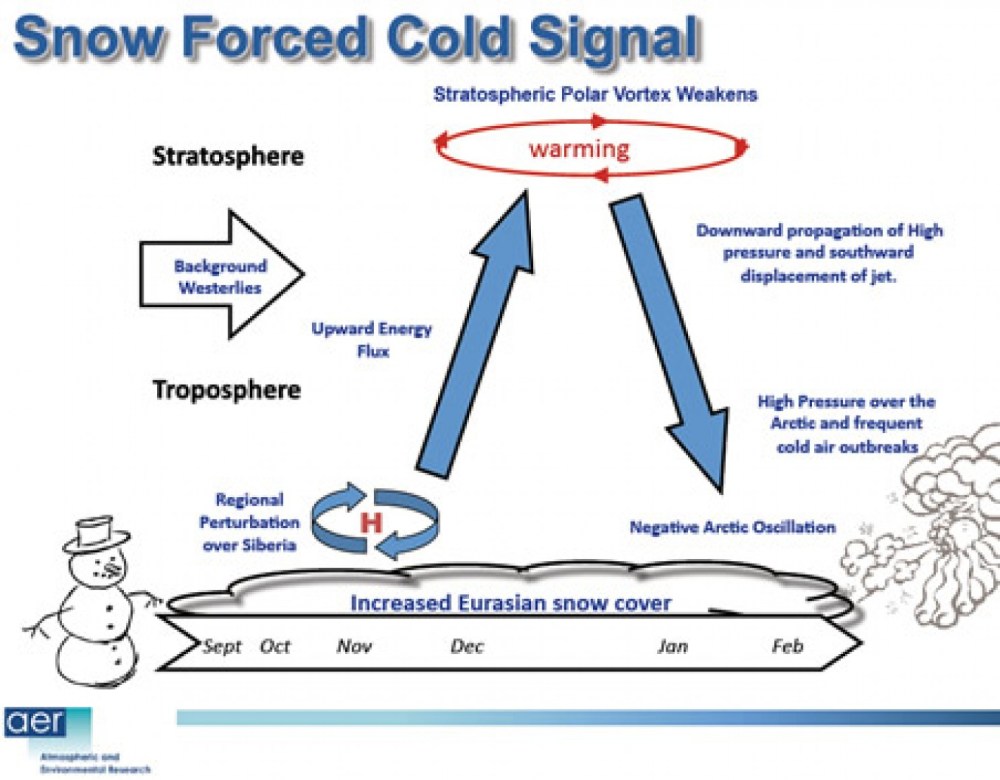
Arctic sea ice reached its annual minimum on September 10th. Despite an initial spurt of ice growth, overall Arctic sea ice has been expanding at an anemic rate. One area to note on the North Atlantic side is in the Barents-Kara Seas, where negative sea ice anomalies have been growing (Figure 13). Recent research has shown that regional anomalies are important and the sea ice region most highly correlated with the winter AO is the Barents-Kara seas region where low Arctic sea ice favors a negative winter AO. Given that sea ice is running well below normal, this currently favors further expansion Eurasian snow cover in the coming weeks, followed by a strengthened Siberian high and a weakened polar vortex/negative AO this upcoming winter.

Sea ice anomalies also remain well below normal in the East Siberian, Chukchi and Beaufort seas. This could favor positive geopotential height anomalies near Alaska forcing downstream troughing and cold weather across eastern North America.

Additional context is provided by Ted Scambos in an article at Discover Magazine (here).  Excerpts below.

An animation of satellite images shows differences in sea ice in the Beaufort Sea off Alaska’s coast between Oct. 14, 2014 and Oct. 12, 2016. The first image, captured by the Terra satellite in 2014, shows extensive snow cover around Alaska’s Brooks Range (to the left), and sea ice forming offshore. The second image, from the Aqua satellite in 2016, shows the same region — mostly snow- and ice-free. (Images: NASA Worldview. Animation: Tom Yulsman)

An animation of satellite images shows differences in sea ice in the Beaufort Sea off Alaska’s coast between Oct. 14, 2014 and Oct. 12, 2016. The first image, captured by the Terra satellite in 2014, shows extensive snow cover around Alaska’s Brooks Range (to the left), and sea ice forming offshore. The second image, from the Aqua satellite in 2016, shows the same region — mostly snow- and ice-free. (Images: NASA Worldview. Animation: Tom Yulsman)

Arctic sea ice has been been growing much more slowly than average during October. Its geographic extent is now in a rough tie with 2007 and 2012 for the lowest in the satellite record for this point in the year.

According to Ted Scambos, a senior research scientist at the National Snow and Ice Data Center, two big Arctic storms in August contributed significantly to the very low minimum extent in September. They probably did this by “breaking up the ice and stirring a trace of warmth up from deeper levels (5-10 meters below the surface),” Scambos says.

Not too long after the storminess subsided, the surface water refroze fairly quickly, accounting for the rapid expansion of sea ice after the low point in September sea ice

That rapid freeze-up happened in the heart of the Arctic Ocean, where temperatures would normally be coldest. Meanwhile, more at the periphery — particularly in the Barents, Kara and Laptev seas — “the ice edge has barely changed,” says Julienne Stroeve, who also serves as a senior research scientist at NSIDC.

Sea ice has expanded somewhat in the Beaufort Sea, off Alaska’s north coast. But the edge is still far short of the long term average in the region.

Arctic Oscillation Index (relative air pressures) hovered around neutral before dropping strongly negative mid Oct., about when ice growth stalled.

Why has Arctic sea ice been growing so slowly in the past couple of weeks? Once again, Scambos thinks the warm sea surface temperatures that have been retarding ice growth also have been warming the air directly above the water. 

“It is not surprising that it is extremely warm in the weeks following near-record minimums [in sea ice extent], because open water beneath the atmosphere buffers the air temperature at near the freezing point for several weeks until several centimeters of ice are formed,” Scambos says. “In this case, I would say that the high air temperature anomaly is an effect, not a cause, of slow sea ice growth, and that the leading cause is ocean temperature.”

What’s the Winter Outlook

Dr. Judah Cohen provides his seasonal forecast here.

Snow cover advance across Eurasia continued consistently above normal for the entire month of October. Also because much of the advance has occurred at latitudes south of 60°N, the snow advance index is also well above normal. Above normal snow cover extent, especially south of 60°N, favors a strengthened Siberian high and a weakened polar vortex/negative AO this upcoming winter with cold temperatures across the continents of the NH.

Predicted winter surface temperature anomalies for the United States Dec-Jan-Feb 2016/17 in degrees Fahrenheit. The model is forecasting colder than normal temperatures for much of the Eastern United States, with warmer than normal temperatures for the Western United States. The model uses October Siberian snow cover, sea level pressure anomalies, predicted El Niño/Southern Oscillation anomalies, and observed September Arctic sea ice anomalies. October Siberian snow cover has so far this month advanced at an above normal rate. This is an indication of an increased probability of a weakened polar vortex or a sudden stratospheric warming, and a predominantly negative Arctic Oscillation during the winter and cold temperatures – especially east of the Mississippi. This is a preliminary forecast and not the official winter forecast as the model requires full monthly values for snow cover and sea level pressure anomalies. The forecast will be updated next month. Current forecast produced on October 19, 2016.

Summary

Both Cohen and Scambos explanations are consistent with the lack of ice both in BCE on the Asian side (Beaufort, Chukchi, E. Siberian), and in Kara and Barents on the European side.

Warm ocean water reduces ice extents, the air is warmed and moistened, and then snowfall increases. The conditions for winter ice formation are shaping up, though somewhat later than usual, perhaps because of August storm activity.

Lastly, it’s important to realize that two weeks is a short period of time, and Arctic sea ice could start forming up at a more normal rate for this time of year. In fact, that’s what Scambos predicts: “Now I expect that sea ice growth will take a more typical path (typical for the past 5-8 years, at least).”

One more time: Remember the 3 Ws when it comes to Arctic ice extents.  Firstly it’s the Water, and then the Wind circulation, and the Weather.  Air temperatures are an effect not the cause.

For more on this see:

Arctic Sea Ice: Self-Oscillating System

Arctic Not a Refrigerator

Sept. Arctic Ice Beats Expectations

August 2016 was the final report of the Sea Ice Prediction Network (SIPN) before the actual September monthly extent is reported by NOAA Sea Ice Index (SII). The report (here) gave this overview:

This month the median pan-Arctic extent Outlook for September 2016 sea ice extent is 4.4 million square kilometers (km2) with quartiles of 4.2 and 4.7 million km2, which is slightly higher than July’s value (4.3 million km2) (See Figure 1 in the full report, below). If the median Outlook should agree with the observed estimate come September, this year would be the third lowest September in the satellite record. The spread in the Outlook contributions narrowed slightly from July to August, with an overall range this month of 3.7 to 5.2 million km2.

arctic-ice-sept-2016

The chart shows the September monthly sea ice extents from NOAA and MASIE. Both datasets show 4.5 M km2, above what was predicted, about 200k km2 higher than 2007.

In MASIE, September 2016 finished as the fourth lowest, ahead of 2012, 2007 and 2008, slightly behind 2011.

Some had anticipated a late Arctic cyclone might again produce a lower number, as it did in 2012. But as the chart shows, 2012 is looking increasingly like an outlier, interrupting a steady recovery of ice extents since 2007.

Arctic Ice on the Up and Up


Despite what you may be hearing, Arctic ice is not presently declining, a big disappointment to fear mongers. Something happened to cause a rapid decline in the decade 1998 to 2007, but since then the ice has been stable or slightly rising.

The analysis below comes from the MASIE dataset, whose managers have no stated position on global warming, climate change, or the future of Arctic ice. They simply report daily ice conditions for the safety of ships operating in Arctic seas. It is the highest resolution, most accurate report of daily ice conditions. MASIE historical records became available once NSIDC confirmed that the records have reasonable consistency starting with 2006.

Big Picture Shows Recovery from 2007 Low

Arctic ice extents are cyclical with maximums occurring in March and the annual minimums in September. Autumn snowfall and winter weather affect the March ice, and September varies with warm and salty water circulations, cloudiness affecting brightness, and stormy weather breaking and compressing ice. The annual average of ice extent factors in fluctuations over the entire cycle.

Since we are at the end of the melt season, the chart below takes 12 month averages starting Oct. 1 to display average annual ice extents for the last 11 years.

arctic-annual-sept-2016

The minimum occurred in 2007 at ~10.4 M km2 and all years have been higher than that, including 2006, 2012 and 2016 virtually tied at ~10.7 M km2. The trendline is descriptive, not predictive; that is, the line serves only to show the pattern in this brief history, the future could go higher or lower with equal uncertainty.

It should be noted that the variability is quite constrained within +/- 0.4 M km2, or +/- 3% of the annual average. Also 5 years are above average, and 6 years are below.

September Ice Minimums

The chart below shows comparative measures of September ice extents.

masie-2016-day273

The red line is September 2007, which was the lowest in the last 10 years, except for 2012 which was hit by the great Arctic Cyclone.  More importantly, 2007 had the smallest annual average ice extent in the MASIE record (since 2006).  The blue line is the ten-year average for days in September (2006 to 2015 inclusive).  MASIE 2015 is in purple, MASIE 2016 in green, and 2016 NOAA SII (Sea Ice Index) is in yellow.

While the minimums all occurred days 260 to 262, 2007 extents were already trending lower, and presently the other measures are converging above average.  With SII virtually tied with MASIE, that index will also be showing a September average ~ 4.5 M km2.

2016 is now slightly above average, having gone below the average annual minimum (4.6 M km2 on Sept. 16) for 17 days before regaining the lost ice.

The table below shows the locations of ice among the various seas making up the Arctic Ocean. Day 273 is Sept. 30 most years; 2016 being a leap year is one day later. So the official 2016 results will benefit from an additional day of ice extent exceeding 5M km2.

Region 2016273 Day 273 Average 2016-Ave. 2015273 2016-2015
 (0) Northern_Hemisphere 5128960 5014059 114901 5183385 -54426
 (1) Beaufort_Sea 376071 574043 -197972 530396 -154325
 (2) Chukchi_Sea 427460 212714 214746 329362 98098
 (3) East_Siberian_Sea 323001 329489 -6488 265744 57257
 (4) Laptev_Sea 295732 162254 133477 165663 130069
 (5) Kara_Sea 163 43464 -43301 45328 -45166
 (6) Barents_Sea 271 24142 -23871 1445 -1174
 (7) Greenland_Sea 194462 256519 -62057 256733 -62271
 (8) Baffin_Bay_Gulf_of_St._Lawrence 50141 49107 1034 71775 -21635
 (9) Canadian_Archipelago 347668 356314 -8646 352788 -5120
 (10) Hudson_Bay 0 4953 -4953 15485 -15485
 (11) Central_Arctic 3112850 2999948 112902 3147524 -34674

2016 is above average with deficits mainly in Beaufort, Kara, and Greenland seas, offset by surpluses in Chukchi, Laptev and Central Arctic.

Summary

Those claiming global warming is proved by declining Arctic ice are losing that line of evidence. Not only has it stopped declining, the evidence is growing that it varies over quasi-60 year cycles because of changes in water circulations, wind and weather. And some researchers think that the ice may continue to grow up and up in the near future.

For more on Arctic Ice Datasets:

A Tale of Two Indices

Ice House of Mirrors

Footnote:

Crystal Serenity is planning for more future Arctic cruises, while Russia is planning for more icebreakers.

Arctic Ice Resurgent Sept. 27

MASIE: “high-resolution, accurate charts of ice conditions”
Walt Meier, NSIDC, October 2015 article in Annals of Glaciology.

I’ve been waiting for September 30 results to compare the monthly average for this year with previous ones.  But the remarkable rate of refreezing in the Arctic needs reporting.  MASIE counts ice extent using 40% coverage of 4k km2 grid cells, making it the highest resolution dataset.  As well, it incorporates estimates from satellite passive microwave sensors, supplemented with satellite imagery and reports from buoys and ships.

masie-2016-day270

The red line is September 2007, which was the lowest in the last 10 years, except for 2012 which was hit by the great Arctic Cyclone.  More importantly, 2007 had the smallest annual average ice extent in the MASIE record (since 2006).  The blue line is the ten-year average for days in September (2006 to 2015 inclusive).  MASIE 2015 is in purple, MASIE 2016 in green, and 2016 NOAA SII (Sea Ice Index) is in yellow.

While the minimums all occurred days 260 to 262, 2007 extents were already trending lower, and presently the other four measures are converging.  Since the September rate of regaining ice was at a decadal high in 2015, it is remarkable for 2016 to be improving on that.  Since 2007 will end the month close to where it is now, we can project that 2016 monthly average will be considerably higher, likely to exceed also 2008.  With SII virtually tied with MASIE, that index will also be showing a September average well over 4.4M km2.

Summary

With 2016 ice extents surging, we can project that Arctic ice has continued on a flat or slightly increasing trendline with no evidence of a decline since 2007.


Why the Discrepancy between SII and MASIE?

The issue also concerns Walter Meier who is in charge of SII, and as a true scientist, he is looking to get the best measurements possible. He and several colleagues compared SII and MASIE and published their findings last October. The purpose of the analysis was stated thus:

Our comparison is not meant to be an extensive validation of either product, but to illustrate as guidance for future use how the two products behave in different regimes.

The Abstract says:
Passive microwave sensors have produced a 35 year record of sea-ice concentration variability and change. Operational analyses combine a variety of remote-sensing inputs and other sources via manual integration to create high-resolution, accurate charts of ice conditions in support of navigation and operational forecast models. One such product is the daily Multisensor Analyzed Sea Ice Extent (MASIE). The higher spatial resolution along with multiple input data and manual analysis potentially provide more precise mapping of the ice edge than passive microwave estimates. However, since MASIE is based on an operational product, estimates may be inconsistent over time due to variations in input data quality and availability. Comparisons indicate that MASIE shows higher Arctic-wide extent values throughout most of the year, largely because of the limitations of passive microwave sensors in some conditions (e.g. surface melt). However, during some parts of the year, MASIE tends to indicate less ice than estimated by passive microwave sensors. These comparisons yield a better understanding of operational and research sea-ice data products; this in turn has important implications for their use in climate and weather models.

http://www.igsoc.org/annals/56/69/a69a694.pdf

The whole document is informative and worth the read.
For instance MASIE is described thus:

Human analysis of all available input imagery, including visible/infrared, SAR, scatterometer and passive microwave, yields a daily map of sea-ice extent at a 4 km gridded resolution, with a 40% concentration threshold for the presence of sea ice. In other words, if a gridcell is judged by an analyst to have >40% of its area covered with ice, it is classified as ice; if a cell has <40% ice, it is classified as open water.

The fact that MASIE employs human judgment is discomforting to climatologists as a potential source of error, so Meier and others prefer that the analysis be done by computer algorithms. Yet, as we shall see, the computer programs are themselves human inventions and when applied uncritically by machines produce errors of their own.

The passive microwave sea-ice algorithms are capable of distinguishing three surface types (one water and two ice), and the standard algorithms are calibrated for thick first-year and multi-year ice (Cavalieri, 1994). When thin ice is present, the algorithms underestimate the concentration of new and thin ice, and when such ice is present in lower concentrations they may detect only open water. The underestimation of concentration and extent of thin-ice regions has been noted in several evaluation studies. . .Melt is another well-known cause of underestimation of sea ice by passive microwave sensors.

The paper by Meier et al. is a good analysis, as far as it goes. In a post NOAA is Losing Arctic Ice I showed the gory details and brought the comparison up to date.

seal-of-approval-seal

Arctic Plateau Continues

A year ago MASIE results showed clearly that the decline of ice prior to 2007 had stabilized and increased a bit.  The graph below displays the plateau of annual average ice extents based on October 1 to September 30.  In 2 weeks we can add 2016 and see how the trend changes.

arctic-ice-ann-to-sept30

The monthly average extent for September is the climate statistic, since daily reports vary greatly due to weather, ice movements and darkening conditions, just some of the factors making it difficult to measure anything in the Arctic.

Halfway through September, we can compare extents for day 260, the average day for annual minimums. The table below shows MASIE extents in M km2 on day 260 for significant years in the last decade.

Arctic Regions 2007 2012 2014 2015 2016
Central Arctic Sea 2.67 2.64 2.98 2.93 2.92
BCE 0.5 0.31 1.38 0.89 0.52
Greenland & CAA 0.56 0.41 0.55 0.46 0.45
Bits & Pieces 0.32 0.04 0.22 0.15 0.31
NH Total 4.05 3.4 5.13 4.44 4.20

The main difference between 2007 and 2016 is more ice in Central Arctic. 2015 is slightly higher because of BCE (Beaufort, Chukchi, E. Siberian combined), though the Bits and Pieces are higher now, most of it in Laptev this year.

The rate of refreezing in the next 2 weeks should keep 2016 well ahead of 2007. The average gain of ice from now to Sept. 30 is 32k km2 per day, or 412k km2 added to the day 260 extent. In 2007 the rate was the decade’s lowest: only 3k per day for 41k km2 added by end of Sept. Last year 2015 was one of the fastest recoveries, almost twice the average.

Conclusion

It looks likely that 2016 September extent average will finish higher than 2007 and close to 2008 and 2011.  It is unlikely to catch 2015.  But who knows?

No one knows what will happen to Arctic ice.

Except maybe the polar bears.

And they are not talking.

Except, of course, to the admen from Coca-Cola

Arctic Ice Minimum?


20160912google1

Imargery date refers to Google Earth capture of land forms. Ice extents are for Sept. 11, 2016 from MASIE. Click on image to zoom in.

Northabout picked her way through drift ice in the channel and is now at the mouth of Baffin Bay.  The Nunavut gauntlet is behind them, but they will seek a port soon with a storm forecasted in coming days.  Serenity exited some days ago, did some sight-seeing in Baffin Bay and is visiting ports in Greenland.

MASIE images of Arctic ice show a plateau in extent for the first 5 days of September, then a drop to ~4.2M where it has remained except for a further one-day dip on day 254. On average the lowest extent shows on day 260, but it varies a lot, from day 254 in 2009 to day 270 in 2007. So weather makes a difference each year. 2016 is uncertain because a storm is forecast in the days ahead (according to Northabout crew) and the effect on ice extent is unknown.

The decline of ice extent is shown below since August 15 (August being the month of greatest loss of ice).

masie-2016-day255

It is too early to say the annual minimum occurred on Sept. 10, but all the sensitive seas are showing increases yesterday.  Ice extents this month are 340k km2 less than last year.  SII is showing ~200k km2 less ice than MASIE in Sept. The table below shows ice extents in the regions for day 255:

Region 2016255 2015255 Difference
 (0) Northern_Hemisphere 4224212 4563954 -339742
 (1) Beaufort_Sea 184884 484260 -299376
 (2) Chukchi_Sea 273471 173544 99927
 (3) East_Siberian_Sea 159549 263598 -104049
 (4) Laptev_Sea 310839 69273 241566
 (5) Kara_Sea 1723 1869 -146
 (6) Barents_Sea 0 18 -18
 (7) Greenland_Sea 161931 222061 -60131
 (8) Baffin_Bay_Gulf_of_St._Lawrence 18475 57705 -39230
 (9) Canadian_Archipelago 232146 267573 -35427
 (10) Hudson_Bay 0 56252 -56252
 (11) Central_Arctic 2880143 2966659 -86516

Surpluses in Chukchi and Laptev somewhat offset deficits in Beaufort and E. Siberian seas.  Baffin and Hudson Bays are much lower this year, but they have little left to lose compared to 2015.  The most significant issue is Central Arctic being lower than last year, which may yet produce a lower September monthly minimum.  Time will tell.

Summary of Year To Date

Someone asked how the annual average ice extent was coming along this year, so I crunched the numbers.

The graph summarizes the changing extents of Arctic ice as measured by two primary datasets: MASIE (Multi-sensor Analyzed Sea Ice Extent) and SII (Sea Ice Index -solely from satellite passive microwave sensors).

Arctic ice YTD Aug

Measured in M km2, the two highest lines are the monthly average extents reported for the first 8 months of 2016. The two horizontal lines show the YTD average from the 8 months. At the bottom are the deviations from 10 yr. Averages for each month (from each dataset).

It is clear that MASIE was reporting slightly more ice early on, and then the two estimates have been close together since. The deviation below average grew up through May, with SII reporting 1M km2 deficit. As of August, both MASIE and SII are showing ice extent down about 0.5M km2.

The 10 yr. Averages of extents for the YTD (8 months) are exactly 12M km2 in both datasets. So Masie YTD is ~3% below average and SII YTD is ~5% down.

Summary

There will be much to do about Arctic ice death spirals in the weeks ahead as 2016 continues to show lower extents. Most likely the September average will be lower than last year, an event lasting perhaps 2-3 weeks before refreezing brings it back over last year’s minimum. Only someone pushing an agenda would claim such a short phenomenon contained within a single month of the year shows the climate is changing.

For more on making sense of Arctic Ice graphs see Ice House of Mirrors

For those who want to see numbers, the table is below.

Monthly 2006-2015 2016 2006-2015 2016 2016 2016-10yr Ave 2016-10yr Ave
Averages MASIE MASIE SII SII SII Deficit MASIE SII
Jan 13.872 13.922 13.780 13.472 -0.450 0.049 -0.308
Feb 14.785 14.804 14.632 14.210 -0.593 0.019 -0.422
Mar 15.008 14.769 14.886 14.405 -0.364 -0.239 -0.481
Apr 14.308 13.917 14.307 13.694 -0.223 -0.391 -0.613
May 12.767 12.086 12.960 11.900 -0.186 -0.681 -1.060
June 10.952 10.419 11.192 10.353 -0.066 -0.533 -0.839
July 8.401 8.067 8.421 7.920 -0.147 -0.334 -0.501
Aug 6.066 5.531 5.838 5.390 -0.141 -0.535 -0.448
YTD Ave. 12.020 11.689 12.002 11.418 -0.271 -0.331 -0.584

September Minimum Outlook

Historically, where will ice be remaining when Arctic melting stops? Over the last 10 years, on average MASIE shows the annual minimum occurring about day 260. Of course in a given year, the daily minimum varies slightly a few days +/- from that.

For comparison, here are sea ice extents reported from 2007, 2012, 2014 and 2015 for day 260:

Arctic Regions 2007 2012 2014 2015
Central Arctic Sea 2.67 2.64 2.98 2.93
BCE 0.50 0.31 1.38 0.89
Greenland & CAA 0.56 0.41 0.55 0.46
Bits & Pieces 0.32 0.04 0.22 0.15
NH Total 4.05 3.40 5.13 4.44

Notes: Extents are in M km2.  BCE region includes Beaufort, Chukchi and Eastern Siberian seas. Greenland Sea (not the ice sheet). Canadian Arctic Archipelago (CAA).  Locations of the Bits and Pieces vary.

As the table shows, low NH minimums come mainly from ice losses in Central Arctic and BCE.  The great 2012 cyclone hit both in order to set the recent record. The recovery since 2012 shows in 2014, with some dropoff last year, mostly in BCE.

Summary

We are nearing the end of the melt season, and the resulting minimum will depend upon the vagaries of weather between now and September 16 or so.  Early on, 2016 was slightly higher than 2015 in March, lower in May and narrowing the gap late June and late July. Note: 2016 melt season is starting without the Blob, with El Nino over, and a cold blob in the North Atlantic.  The AO has been hovering around neutral, now possibly indicating cloud cover reducing the pace of melting.

Meanwhile we can watch and appreciate the beauty of the changing ice conditions.

Arctic sea ice in summer 2015. This photo was made during an expedition of the German research icebreaker Polarstern into the central Arctic Ocean. Credit: Stefan Hendricks

Footnote:  Regarding the colder than normal water in the North Atlantic

A 2016 article for EOS is entitled Atlantic Sea Ice Could Grow in the Next Decade

Changing ocean circulation in the North Atlantic could lead to winter sea ice coverage remaining steady and even growing in select regions.

The researchers analyzed simulations from the Community Earth System Model, modeling both atmosphere and ocean circulation. They found that decadal-scale trends in Arctic winter sea ice extent are largely explained by changes in ocean circulation rather than by large-scale external factors like anthropogenic warming. (my bold)

From the Abstract of Yeager et al.

We present evidence that the extreme negative trends in Arctic winter sea-ice extent in the late 1990s were a predictable consequence of the preceding decade of persistent positive winter North Atlantic Oscillation (NAO) conditions and associated spin-up of the thermohaline circulation (THC). Initialized forecasts made with the Community Earth System Model decadal prediction system indicate that relatively low rates of North Atlantic Deep Water formation in recent years will result in a continuation of a THC spin-down that began more than a decade ago. Consequently, projected 10-year trends in winter Arctic winter sea-ice extent seem likely to be much more positive than has recently been observed, with the possibility of actual decadal growth in Atlantic sea-ice in the near future. (my bold)

Northabout Racing Against Refreezing

20160909google1

Imagery dat refers to Google Earth capture of land forms. Ice extents are for Sept. 8, 2016 from MASIE. Click on image to zoom in.

As I have said before, I wish the sailors safe passage even though they have been misled by climate alarmists.  Their adventure is life-threatening, though not unprecedented.  More than 200 NWP crossings are recorded since 1906, but who knows whether 2017 or beyond will have as much open water as this year.

From the ship’s log:

N69 02 W 101 30 pressure 1006, water1.7C, Air 2C 0500 UTC 9 Sept local time 22.00 8 Sept, Queen Maud Gulf

A winters start. Low cloud base and dark skies. We slowly edged our way past Cambridge Bay into Queen Maud Gulf, surely named by Amundsen.

Cambridge Bay is the last place we could really over winter the boat so I hope we don’t have to retrace our steps.

We knew Polar Bound was coming our way, many months ago. Skippered by a legend in High Latitude Sailing, David Scott Cowper. He has forgotten what we haven’t even learnt yet. Firstly, he was shown up on our AIS, as we got closer to each other, it was a surreal moment. Two Englishmen chatting away over the radio waves, in the North West Passage. No other boat or Nationality around.

Mad dogs and Englishmen came into my thoughts.

What a shame, David was heading to Cambridge Bay for breakfast and invited us to join him, very unfortunately we are in a race against time before the freeze . Also, we need to get to Baffin Bay before a big storm, don’t tell the ladies that ! Hopefully, we will be in harbour by then.

So, the rest of the day was skirting Islands with big cliffs, until this evening. Now making our way up Victoria Strait, water temps plummeted but the skies have cleared to give beautiful stars. A really clear sky, I can’t think of another night like it. Our Ice Charts show 1/10 ice. As Steve pointed out so sagely, doesn’t sound much, but if you have one large chunk in your way in the dark, it’s going to dent your boat !

I have started to twitch at the thought. The last Ice in the sea at night was the Chukchi sea before Point Barrow, we have all had nightmares ever since.

David

Background on the Polar Ocean Challenge

Update August 14, 2016

It appears that Northabout has found a way around the Laptev wall, and is close to finding open water.  Below the Google Earth image of ice edges from NIC shows how the strait has opened up along with navigable shore lines.

Aug13googleRev

Imagery date refers to Google Earth capture of land forms. Ice edges are provided by MASIE for August 13, 2016.

The Big Picture from August 11, 2016.

masie_August 11rev

The Polar Ocean Challenge involves the sailing ship Northabout circumnavigating the North Pole counterclockwise starting from Bristol UK. The chart above from MASIE shows the two choke points in the itinerary: The Laptev Wall of ice at the beginning and the Nunavut Gauntlet of ice at the end. The image shows If Northabout can get past Laptev, it is relatively clear sailing all the way to Beaufort where Nunavut awaits.

20160809en

The above chart from AARI shows how Northabout has passed through the strait from Kara into Laptev and is in a holding pattern up against the wall.  Caleb has some great photos (here) of the views from the deck, along with some comments respecting the explorers despite their being misled by global warming theorists.

20160809enBaffin

Above is the latest chart from AARI showing the present ice situation at the other end of the trip, the Nunavut Gauntlet.  The white part is without data since the Russians are focused on their side of the ocean, but it does show heavy ice in Beaufort Sea on the right,  Within Nunavut, Parry Channel is well blocked, but with some water around the edges.  If and when Northabout gets here, no one knows what they will face.  They are counting on the passage opening this year, unlike previous years.

An image of the ice and snow extents from NOAA by way of National Ice Center (NIC)

A closeup of Nunavut from that chart shows they have a chance by using the southern route, skipping all but the eastern end of Parry Channel, provided the ice is better not worse than now when they approach.

cursnow_alaskaNOAAnunavut

Footnote:

Another view of the Arctic is available from NIC using Google Earth.  The daily shapefile can be downloaded, and it then opens in Google Earth, which allows you to browse and zoom in on regions of interest.  Here is an image from this source:

20160812google

Note: Imagery date is Google Earth capture of land masses. Ice edges are 20160812 from NIC.