Despite what you may be hearing, Arctic ice is not presently declining, a big disappointment to fear mongers. Something happened to cause a rapid decline in the decade 1998 to 2007, but since then the ice has been stable or slightly rising.
The analysis below comes from the MASIE dataset, whose managers have no stated position on global warming, climate change, or the future of Arctic ice. They simply report daily ice conditions for the safety of ships operating in Arctic seas. It is the highest resolution, most accurate report of daily ice conditions. MASIE historical records became available once NSIDC confirmed that the records have reasonable consistency starting with 2006.
Big Picture Shows Recovery from 2007 Low
Arctic ice extents are cyclical with maximums occurring in March and the annual minimums in September. Autumn snowfall and winter weather affect the March ice, and September varies with warm and salty water circulations, cloudiness affecting brightness, and stormy weather breaking and compressing ice. The annual average of ice extent factors in fluctuations over the entire cycle.
Since we are at the end of the melt season, the chart below takes 12 month averages starting Oct. 1 to display average annual ice extents for the last 11 years.
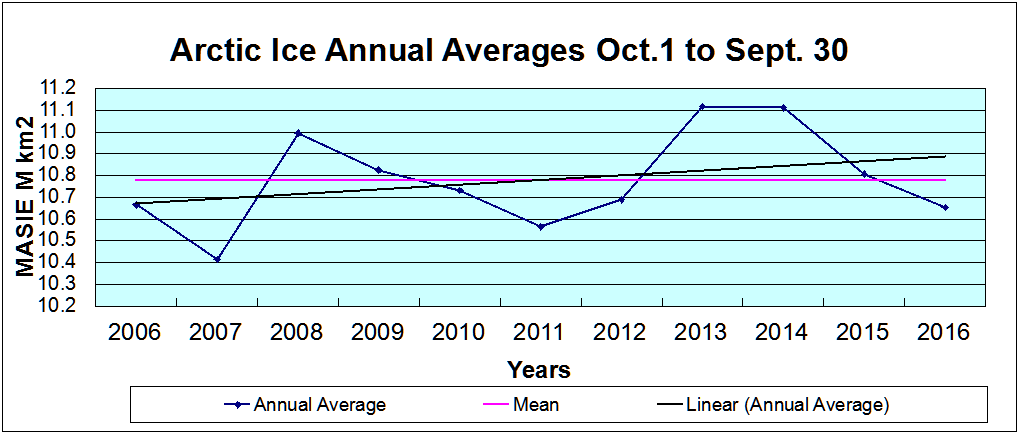
The minimum occurred in 2007 at ~10.4 M km2 and all years have been higher than that, including 2006, 2012 and 2016 virtually tied at ~10.7 M km2. The trendline is descriptive, not predictive; that is, the line serves only to show the pattern in this brief history, the future could go higher or lower with equal uncertainty.
It should be noted that the variability is quite constrained within +/- 0.4 M km2, or +/- 3% of the annual average. Also 5 years are above average, and 6 years are below.
September Ice Minimums
The chart below shows comparative measures of September ice extents.
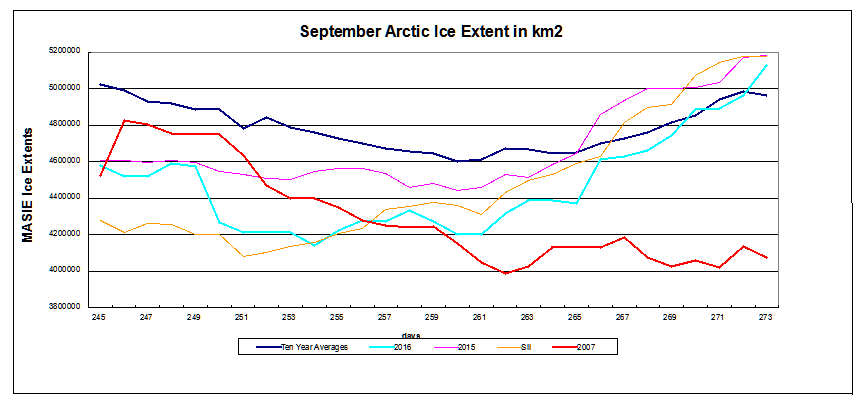
The red line is September 2007, which was the lowest in the last 10 years, except for 2012 which was hit by the great Arctic Cyclone. More importantly, 2007 had the smallest annual average ice extent in the MASIE record (since 2006). The blue line is the ten-year average for days in September (2006 to 2015 inclusive). MASIE 2015 is in purple, MASIE 2016 in green, and 2016 NOAA SII (Sea Ice Index) is in yellow.
While the minimums all occurred days 260 to 262, 2007 extents were already trending lower, and presently the other measures are converging above average. With SII virtually tied with MASIE, that index will also be showing a September average ~ 4.5 M km2.
2016 is now slightly above average, having gone below the average annual minimum (4.6 M km2 on Sept. 16) for 17 days before regaining the lost ice.
The table below shows the locations of ice among the various seas making up the Arctic Ocean. Day 273 is Sept. 30 most years; 2016 being a leap year is one day later. So the official 2016 results will benefit from an additional day of ice extent exceeding 5M km2.
| Region | 2016273 | Day 273 Average | 2016-Ave. | 2015273 | 2016-2015 |
| (0) Northern_Hemisphere | 5128960 | 5014059 | 114901 | 5183385 | -54426 |
| (1) Beaufort_Sea | 376071 | 574043 | -197972 | 530396 | -154325 |
| (2) Chukchi_Sea | 427460 | 212714 | 214746 | 329362 | 98098 |
| (3) East_Siberian_Sea | 323001 | 329489 | -6488 | 265744 | 57257 |
| (4) Laptev_Sea | 295732 | 162254 | 133477 | 165663 | 130069 |
| (5) Kara_Sea | 163 | 43464 | -43301 | 45328 | -45166 |
| (6) Barents_Sea | 271 | 24142 | -23871 | 1445 | -1174 |
| (7) Greenland_Sea | 194462 | 256519 | -62057 | 256733 | -62271 |
| (8) Baffin_Bay_Gulf_of_St._Lawrence | 50141 | 49107 | 1034 | 71775 | -21635 |
| (9) Canadian_Archipelago | 347668 | 356314 | -8646 | 352788 | -5120 |
| (10) Hudson_Bay | 0 | 4953 | -4953 | 15485 | -15485 |
| (11) Central_Arctic | 3112850 | 2999948 | 112902 | 3147524 | -34674 |
2016 is above average with deficits mainly in Beaufort, Kara, and Greenland seas, offset by surpluses in Chukchi, Laptev and Central Arctic.
Summary
Those claiming global warming is proved by declining Arctic ice are losing that line of evidence. Not only has it stopped declining, the evidence is growing that it varies over quasi-60 year cycles because of changes in water circulations, wind and weather. And some researchers think that the ice may continue to grow up and up in the near future.

For more on Arctic Ice Datasets:
Footnote:
Crystal Serenity is planning for more future Arctic cruises, while Russia is planning for more icebreakers.


It is disturbing, very disturbing that you talk about Arctic ice and not Arctic sea ice
LikeLike
Of course it is all sea ice, it goes without saying.
LikeLiked by 1 person
Posted to the 2016 climate/energy/science headline listings http://c3headlines.typepad.com/c3science/
LikeLike
Reblogged this on Climate Collections and commented:
Summary
Those claiming global warming is proved by declining Arctic ice are losing that line of evidence. Not only has it stopped declining, the evidence is growing that it varies over quasi-60 year cycles because of changes in water circulations, wind and weather. And some researchers think that the ice may continue to grow up and up in the near future.
LikeLiked by 1 person
“2016 is now slightly above average, having gone below the average annual minimum (4.6 M km2 on Sept. 16) for 17 days before regaining the lost ice…”

and growing much faster than 2015,
LikeLike
Reblogged this on Climate- Science.
LikeLike