2020 Pacific Ice Rebounds

A previous post reprinted below pointed out how Pacific ice recovers in fits and starts, often see sawing between Bering and Okhotsk Seas.  Now both of them are growing faster than the 13 year average (2007 to 2019 inclusive).  The image above shows how much colder is Alaska this year versus 2019, probably related to Bering icing over.  In the last 9 days, Bering added 100k km2, now up to 85% of last March max.  Okhotsk added 150k km2 up to 67% of last March max.

The graph shows how January 2020 compared to 13 year average and some other years of interest.

This year’s recovery is matching and slightly exceeding average, and ahead of other recent years.  MASIE shows extents slightly higher than SII.

By January there are not many places where Arctic ice extent can grow.  All the Eurasian shelf seas are full, as is the case on the CanAm side: Beaufort, CAA, Hudson Bay covered completely.  Barents  and Greenland Seas have some room to grow, as does Baffin Bay.  But mainly the variability is on the Pacific side, where the usual Bering/Okhotsk see saw is reappearing.

As we have seen in past winters, ice in the Pacific Arctic tends to grow in fits and spurts, often alternating between Bering and Okhotsk Seas.  The above image of the first two weeks of 2020 shows Okhotsk on the left growing ice steadily while Bering waffled back and forth ending with almost the same extent.  Combined the two seas ice extents are slightly below the 13 year average at this time, due to Bering’s slow recovery.

The January graph shows MASIE and SII reporting the same pace of ice recovery and matching 2019.  This is somewhat below the 13 year average (2007 to 2019 inclusive) and higher than 2017 and 2018. The table below shows the distribution of ice extent among the Arctic regions on January 14.

Region 2020014 Day 014 Average 2020-Ave. 2018014 2020-2018
 (0) Northern_Hemisphere 13541376 13776703 -235327 13340428 200948
 (1) Beaufort_Sea 1070655 1070223 432 1070445 210
 (2) Chukchi_Sea 965972 965812 160 965971 1
 (3) East_Siberian_Sea 1087137 1087133 4 1087120 18
 (4) Laptev_Sea 897845 897842 3 897845 0
 (5) Kara_Sea 932936 909656 23280 925247 7689
 (6) Barents_Sea 619526 508236 111290 393026 226500
 (7) Greenland_Sea 483377 610574 -127197 521896 -38519
 (8) Baffin_Bay_Gulf_of_St._Lawrence 1039079 1172487 -133408 1173039 -133960
 (9) Canadian_Archipelago 854282 853058 1225 853109 1174
 (10) Hudson_Bay 1260192 1251600 8592 1260838 -646
 (11) Central_Arctic 3233354 3210543 22811 3194383 38971
 (12) Bering_Sea 414963 521989 -107026 241830 173133
 (13) Baltic_Sea 8863 43903 -35040 24486 -15623
 (14) Sea_of_Okhotsk 651004 626433 24571 696684 -45681

2019 NH ice is 235k km2 below the 13-year average, or 1.7%, and 200k km2 more than 2018 on that date.  The deficits are in Bering, Greenland Sea and Baffin Bay, partly offset by surpluses in Barents, Kara and Okhotsk.

cg524a47d218458

The next month or so will show how the Pacific ice shapes up.

seesaw


Oranges Disprove Global Warming

Paul Noel writes at Quora in response to a question: What are the best arguments of the movement “global warming deniers” to back their version of the story? Excerpts in italics with my bolds.

Well since this question has only been answered by those who want to say no such science exists It has to be answered.

Here is an absolute proof that there is no global warming going on. It absolutely has no denial possible.

In 1899 there was a large swath of the Southern USA that was used for Commercial Citrus Growing. Citrus Trees do not tolerate hard freezing. In fact they are tropical plants with only very slight ability to withstand freezing conditions. Their fruit is even more tender, and so a Commercial Producer cannot tolerate any significant extended freezing. In Florida for example the Citrus producers have methods to withstand FROST. These are pretty amazing. (See photo above)

They literally spray their trees with water so that as the water freezes it prevents the citrus from freezing as the sugar content keeps the freezing point slightly lower than water. This method only works against light freezes of short duration. It often results in having to sell the crop in a rush to juice operations at loss of value.

So Citrus Commercial Production is prevented in all but areas with 365 day growing seasons.

The large swath of growing included about 1/2 of eastern Texas essentially south of Tyler Texas. It included almost all of Louisiana south of Interstate 20. It included Most of Mississippi south of Jackson and across Alabama up to Evergreen. It then extended across Georgia essentially from Columbus to Augusta and then up South Carolina all the way to North Carolina and a coastal strip of North Carolina up to almost Virginia. It also included All of Florida.

Basically this map shows in Zone 8b and slightly into Zone 8a the region that used to raise citrus. Today none can be raised outside of Zone 9b or higher. Actually the only safe in zone 10.

Today due to severe cooling of the environment, it only includes 4 of the most southern counties along the Rio Grande Valley in Texas and the southern part of Florida. Over the past 120 years, this has almost deleted Citrus growing from much of the southern part of North America.

This is the remaining Florida range of Citrus.

There is no remaining commercial citrus in Louisiana, Mississippi, Alabama, Georgia, South Carolina or North Carolina.

Now if you were to pick any location that was better for determining the global temperature you could not do it. This is the focal point for all of the global heat circulation of the world’s oceans. The heat focuses on the Yucatan Channel, goes through into the Gulf of Mexico forms a loop, shearing off much rainfall and heat into the Southeastern USA and subsequently going out the Florida Strait as the Gulf Stream, the world’s largest and warmest ocean current.

As such the temperature and climate of the area is the best representation of the world climate condition.

This is the reason that of the wettest states in the USA 4 of the top 5 are in this area.

#5 Florida
#4 Alabama
#3 Mississippi
#2 Louisiana
(#1 is Hawaii)

Now that is fact. That is solid evidence. Silly claims and graphs cannot refute it.

Now some may point to an occasional remaining group of trees or such , but the fact is that commercial citrus is out of that region. The remnants are proof of exactly what I have said here.

See Also:  Oceans Make Climate: SST, SSS and Precipitation Linked


Unhinged Climate Celebs: Krugman and Cusack

David Simon writes at Real Clear Markets Paul Krugman Is a Global Warming Alarmist. Don’t Be Like Him. Excerpts in italics with my bolds

In 2004, TheGuardian.com reported a secret Pentagon warning about global warming: “major European cities will be sunk beneath rising seas as Britain is plunged into a ‘Siberian’ climate by 2020. Nuclear conflict, mega-droughts, famine and widespread rioting will erupt across the world.”

In 2008, Al Gore announced that “the entire North ‘polarized’ cap will disappear in five years.”

In 2009, U.N. Secretary General Ban Ki-Moon declared that “[t]he world has less than 10 years to halt the global rise in greenhouse gas emissions if we are to avoid catastrophic consequences for people and the planet.”

All wrong.

Yet the supposedly authoritative statements of global warming doom continue. In a January 3, 2020 column titled “Apocalypse becomes normal”, Paul Krugman in his usual understated way told us that “[o]n our current trajectory, Florida as a whole will eventually be swallowed by the sea” and “[m]uch of India will eventually become uninhabitable.”

Krugman makes the same mistake as other false prophets of global warming doom. His and their predictions are works of science fiction because, contrary to scientific principles, they ignore the facts about global warming’s actual impact.

The facts instead show that global warming is a non-problem that warrants no action.

First, the earth’s temperature has been rising at a microscopically slow pace. NASA’s data set for global temperatures goes back to 1880 and shows that since that year, the earth’s temperature has risen by only 1.14° C. An increase of 1.14° C over 139 years translates to an average increase of only 0.008° C per year.

Second, a warmer earth saves lives. In 2015, the prestigious medical journal The Lancet reported that worldwide, cold kills over 17 times more people than heat. A group of 22 scientists examined over 74 million deaths in the United States, China, Brazil, and ten other countries in 1985-2012. They found that cold caused 7.29 percent of these deaths, while heat caused only 0.42 percent. And of these temperature-related deaths, “moderately hot and cold temperatures” caused 88.85 percent of the deaths, while “extreme” temperatures caused only 11.15 percent.

Third, while the earth’s temperature has risen, the number of natural disaster deaths has been sharply declining. In 2019, EMDAT, The International Disaster Database, reported that since the 1920s, the number of people killed annually by natural disasters has declined by over 80 percent. And this happened as the world’s population quadrupled from less than two billion to over seven and half billion.

My Mind is Made Up, Don’t Confuse Me with the Facts. H/T Bjorn Lomborg, WUWT

Fourth, the global air pollution death rate has fallen by almost 50 percent since 1990. In 2019, University of Oxford economist Max Roser and researcher Hannah Ritchie reported in Our World in Data that “since 1990 the number of deaths per 100,000 people have nearly halved.”

Fifth, any impact on the economy is likely to be minimal. In 2019, the National Bureau of Economic Research estimated that if the earth’s temperature rises by 0.01° C per year through 2100 – 25 percent faster than it actually has since 1880 – total U.S. GDP in 2100 will be 1.88 percent lower in 2100 than it would otherwise be.

But the Congressional Budget Office in 2019 projected that in 2100, GDP per person will be about 180 percent higher (based on its projection of a 1.3 percent annual real long-term potential labor force productivity growth rate). So even if the reduction that NBER estimates pans out, GDP per person will still be about 178 percent higher.

In other words, per person income in 2100 will be almost triple today’s level, regardless of global warming.

Finally, restricting carbon emissions to attempt to stop global warming is the wrong path – even the most severe restrictions will have almost zero impact on the earth’s temperature. Climatologist Patrick J. Michaels calculated that if the United States eliminated all carbon emissions – which would not only require Americans to give up fossil fuels, but also to stop breathing (to cease exhaling carbon dioxide) – it would only reduce global warming by a negligible 0.052° C by 2050.

Don’t make the same mistake as Krugman and other false prophets of global warming doom. Check the facts. Global warming has not been harmful and presents no danger to future generations.

And then there’s John Cusack.  Zachary Leeman writes at RT:  Cusack, Bernie’s prophet of doom: Only 10-12 years to stop climate change & ‘predatory capitalism’.  Excerpts is italics with my bolds.

It appears actor John Cusack took the climate change messages in his film ‘2012’ really, really seriously, because he says Earth only has a handful of years left — unless Vermont Senator Bernie Sanders is elected US President.

payn_c16807820190906120100

Introducing Sanders in Exeter, New Hampshire, on Saturday, the 53-year-old actor threw out a doomsday scenario where the world only has a “10 to 12 year window” to reverse the effects of climate change and combat the “predatory capitalism” that is supposedly fueling it.

“The billionaires are getting nervous and all the corporate media is — they hate us, they don’t hate us, they’re confused. And it seems like every conceivable power structure on Earth is trying to kill or derail our movement, but we’re still here,” Cusack announced to the assembled Sanders supporters.

“We know this form of capitalism takes and takes; it takes whatever, whenever, however it wants. It’ll take our lives, it’ll take our labor, our spirit, our air and water, even our earth.”

Cusack’s climate change fear-mongering may have played to the crowd of Bernie supporters, but he isn’t flipping many votes, judging by the wider reaction on social media.

“The self-awareness of @johncusack is undetectable with an electron microscope,” actor and director Nick Searcy tweeted in response to Cusack’s speech.

‘Full Metal Jacket’ actor Adam Baldwin questioned whether Cusack is suggesting war with China with his doomsday prediction, considering the country leads the United States in CO2 emissions.

Others criticized Cusack, who endorsed Sanders for president in February of last year, for his focus on criticizing capitalism and the “one percent of the one percent,” when he has himself become wealthy from his work in capitalist Hollywood.

Tom Elliott tweet: 

Actor John Cusack lecturing those in the bottom 99%

Gosh advice from Hollywood is always welcomed

Footnote:  If you want to talk about predatory capitalism, consider the billions raked in by Big Wind and Big Solar moguls.  See The End of Wind and Solar Parasites

wind-energy-myth


Jan. 19 Arctic Ice Returns to Mean

A previous post noted the Pacific ice see saw had returned, with Bering Sea slow to recover.  The image above shows recovery of Arctic sea ice extent over the month of January 2020. As supported by the table later, the pace of refreezing was slow to begin but has now allowed 2020 to match the 13 year average (2007 to 2019 inclusive). Okohotsk Sea on the left has grown ice extent steadily to be currently at 66% of last March maximum.  Bering on the right waffled back and forth but gained strongly the last few days.

The graph below shows the ice extent growing during January compared to some other years and the 13 year average (2007 to 2019 inclusive).

Note that the  NH ice extent 13 year average increases about 1.2M km2 during January, up to 14.4M km2. MASIE 2020 stated with a slower icing rate, dropping 300k km2 lower than average before catching up to reaching the average on January 19.  Both 2018 and 2017 were lower at this point, while MASIE and SII are tracking closely together.

The table shows where the ice is distributed compared to average.  Deficits in Greenland Sea and Baffin Bay are offset by surpluses in Kara and Barents Seas.  At this point the surplus in Okhotsk exceeds the Bering deficit. Going forward, most of the additional ice extent will in the Pacific Seas.

Region 2020019 Day 019 Average 2020-Ave. 2018019 2020-2018
 (0) Northern_Hemisphere 13933540 13939872  -6332  13431421 502118 
 (1) Beaufort_Sea 1070655 1070223  432  1070445 210 
 (2) Chukchi_Sea 965972 965999  -27  965971
 (3) East_Siberian_Sea 1087137 1087133  1087120 18 
 (4) Laptev_Sea 897845 897842  897845
 (5) Kara_Sea 933810 911944  21867  902003 31807 
 (6) Barents_Sea 646750 502965  143784  286684 360065 
 (7) Greenland_Sea 525324 600387  -75063  453112 72212 
 (8) Baffin_Bay_Gulf_of_St._Lawrence 1155618 1245934  -90317  1355009 -199391 
 (9) Canadian_Archipelago 854282 853058  1225  853109 1174 
 (10) Hudson_Bay 1260192 1257480  2712  1260838 -646 
 (11) Central_Arctic 3239662 3203861  35801  3161866 77796 
 (12) Bering_Sea 443027 570321  -127294  309601 133425 
 (13) Baltic_Sea 9625 52416  -42791  24115 -14491 
 (14) Sea_of_Okhotsk 817160 669235  147925  782693 34467 

Footnote:  Interesting comments on January 13 by Dr. Judah Cohen at his blog regarding the Arctic fluctuations. Excerpts in italics with my bolds.

Arctic sea ice extent

The positive AO is conducive to sea ice growth and Arctic sea ice growth rate continues to grow slowly and remains well below normal but higher than recent winters; the weather pattern remains favorable for further sea ice growth. Negative sea ice anomalies exist in three regions: the Bering Sea, around Greenland-Canadian Archipelagos and Barents-Kara Seas. The anomalies in the North Pacific sector have shrunk (Figure 16), and based on model forecasts negative sea ice anomalies in the Bering Sea can shrink further in the next two weeks. Below normal sea ice in and around Greenland and the Canadian Archipelagos may favor a negative winter NAO, though there are no signs of such a scenario. Based on recent research low sea ice anomalies in the Chukchi and Bering seas favors cold temperatures in central and eastern North America while low sea ice in the Barents-Kara seas favor cold temperatures in Central and East Asia, however this topic remains controversial. Recent research has shown that regional anomalies that are most highly correlated with the strength of the stratospheric PV are across the Barents-Kara seas region where low Arctic sea ice favors a weaker winter PV.

Northern Hemisphere Snow Cover

Despite a strongly postive AO snow cover has advanced across Eurasia and is now near decadal means. And if the snowfall forecasts for Europe ever verify it could advance further. Above normal snow cover extent in October, favors a strengthened Siberian high, cold temperatures across northern Eurasia and a weakened polar vortex/negative AO this upcoming winter followed by cold temperatures across the continents of the NH.

Illustration by Eleanor Lutz shows Earth’s seasonal climate changes. If played in full screen, the four corners present views from top, bottom and sides. It is a visual representation of scientific datasets measuring Arctic ice extents and snow cover.

2020 Pacific Ice See Saw Returns

By January there are not many places where Arctic ice extent can grow.  All the Eurasian shelf seas are full, as is the case on the CanAm side: Beaufort, CAA, Hudson Bay covered completely.  Barents  and Greenland Seas have some room to grow, as does Baffin Bay.  But mainly the variability is on the Pacific side, where the usual Bering/Okhotsk see saw is reappearing.

As we have seen in past winters, ice in the Pacific Arctic tends to grow in fits and spurts, often alternating between Bering and Okhotsk Seas.  The above image of the first two weeks of 2020 shows Okhotsk on the left growing ice steadily while Bering waffled back and forth ending with almost the same extent.  Combined the two seas ice extents are slightly below the 13 year average at this time, due to Bering’s slow recovery.

The January graph shows MASIE and SII reporting the same pace of ice recovery and matching 2019.  This is somewhat below the 13 year average (2007 to 2019 inclusive) and higher than 2017 and 2018. The table below shows the distribution of ice extent among the Arctic regions on January 14.

Region 2020014 Day 014 Average 2020-Ave. 2018014 2020-2018
 (0) Northern_Hemisphere 13541376 13776703 -235327 13340428 200948
 (1) Beaufort_Sea 1070655 1070223 432 1070445 210
 (2) Chukchi_Sea 965972 965812 160 965971 1
 (3) East_Siberian_Sea 1087137 1087133 4 1087120 18
 (4) Laptev_Sea 897845 897842 3 897845 0
 (5) Kara_Sea 932936 909656 23280 925247 7689
 (6) Barents_Sea 619526 508236 111290 393026 226500
 (7) Greenland_Sea 483377 610574 -127197 521896 -38519
 (8) Baffin_Bay_Gulf_of_St._Lawrence 1039079 1172487 -133408 1173039 -133960
 (9) Canadian_Archipelago 854282 853058 1225 853109 1174
 (10) Hudson_Bay 1260192 1251600 8592 1260838 -646
 (11) Central_Arctic 3233354 3210543 22811 3194383 38971
 (12) Bering_Sea 414963 521989 -107026 241830 173133
 (13) Baltic_Sea 8863 43903 -35040 24486 -15623
 (14) Sea_of_Okhotsk 651004 626433 24571 696684 -45681

2019 NH ice is 235k km2 below the 13-year average, or 1.7%, and 200k km2 more than 2018 on that date.  The deficits are in Bering, Greenland Sea and Baffin Bay, partly offset by surpluses in Barents, Kara and Okhotsk.

cg524a47d218458

The next month or so will show how the Pacific ice shapes up.

seesaw


Turtles Vs. Trump

Apologies for the image; I couldn’t find one with turtles wearing lawyers suits.  Again it is ambulance chasers with legal training targeting deep pockets, as explained in USA Today article Trump administration sued for failing to protect green sea turtles from climate change.  Excerpts on this latest example of climate derangement syndrome are in italics with my bolds.

Several environmental groups filed a lawsuit Wednesday claiming several agencies in the Trump administration have failed to protect green sea turtle habitat as required by the Endangered Species Act.

The lawsuit, filed in U.S. District Court for the District of Columbia, says the turtles’ nesting beaches in Florida, Georgia, North Carolina and South Carolina, as well as their ocean habitat, face threats from sea level rise brought on by climate change and plastic pollution, according to a news release from the Center for Biological Diversity, one of the plaintiffs.

Other plaintiffs are the Sea Turtle Oversight Protection and the Turtle Island Restoration Network. The lawsuit asks the court to rule that several federal agencies are in violation of the Endangered Species Act and order them to designate sites – unspecified as yet –as critical habitat for the turtles.

Defendants include:

Interior Department Secretary David Bernhardt
Commerce Secretary Wilbur Ross
Margaret Everson, principal deputy director of the U.S. Fish & Wildlife Service
Chris Oliver, assistant administrator for fisheries at the National Oceanic Atmospheric Administration
National Marine Fisheries Service
A UPS driver started posting dog pictures in 2013:It’s now a viral sensation with 1.6M likes

Climate change, sea level rise
The lawsuit acknowledges that green sea turtle populations have been on a general increase over the last few years, but notes the National Marine Fisheries Service and Fish & Wildlife Service found in 2016 that threats from climate change and sea level rise mean the turtles still need protection under the Endangered Species Act.

The act prohibits federal agencies from authorizing activities that will destroy or harm a listed species’ critical habitat.

Floridians should be proud of how far we’ve come with green sea turtle recovery, but the fight’s not over yet,” said Jaclyn Lopez, Florida director at the Center for Biological Diversity. “Now the feds have to step up and ensure that sea turtles have safe passage to nest on our beaches. These imperiled animals can’t afford any more delays.”

Green turtle populations around the world are listed as either endangered or threatened under the Endangered Species Act.


A 144-pound sea turtle was rescued by Indian River County police after being struck by a boat.

Dipole Down Under

Vijay Jayaraj explains how weather is created around the Indian Ocean in this article Record Heat and Cold Expose Climate Alarmists’ Bias. Excerpts in italics with my bolds and images.

Australia was literally on fire in December. Record heat made headlines in global media. So did the extreme rainfall in east Africa.

You and everybody else on earth can guess what climate alarmists blamed for both: man-made global warming, a.k.a. climate change.

But record cold in northern India at the same time didn’t make headlines in any major media in the United States or the United Kingdom.

Why? Because it didn’t fit expectations.

It’s a perfect example of climate alarmists’ obvious bias that’s seldom brought to light.

In December, east Africa received extremely heavy rainfall, causing widespread floods in Kenya and Djibouti. The floods impacted more than one million people and killed scores already challenged by extreme poverty.

During the same month, Australia recorded all-time highs. Widespread, devastating wildfires made the situation worse.

Climate alarmists predictably claimed these weather events for their propaganda.  Almost all news article about the Australian heat and wildfires ultimately blamed man-made climate change. But more than four-fifths of Australia’s wildfires were caused by arson, not climate change.

And what caused the extreme hot weather was not global warming but a phenomenon called Positive Indian Ocean Dipole (PIOD).

PIOD is a seasonal weather phenomenon that can affect climate in east Africa, south Asia, and Australia all at once.

The same PIOD that caused Australia’s heat (but not its wildfires) caused the year-end floods in east Africa. It also caused extreme cold in northern India in the same month. Largely underreported in global media, the cold continued right through to the end of December.

Delhi, India’s capital, recorded its second-coldest December in 118 years. Intermittent cold waves gripped Punjab, Jammu and Kashmir, Ladakh, Himachal Pradesh, Uttarakhand, and Delhi.

On December 28, the heart of Delhi recorded a minimum of 1.7˚C (35˚F). The temperature likely reached freezing outside the city’s urban heat island effect. The cold wave impacted everyday life for 29 million people in Delhi.

But neither CNN nor BBC headlines ever mentioned it. It runs contrary to their narrative. Winters are supposed to become warmer. Though the mainstream media do link the PIOD to the Australian heat and the east African floods, they never shy away from blaming man-made climate change and find ways to link both.

Now their new theory is that the PIOD itself has become more intense because of climate change. In other words, weather events are non-existent in their dictionary. Each and every extreme weather event is blamed on man-made climate change.

This is what happens when people read every weather event through the preconceived lenses of climate alarmism.

Closer inspection reveals no change in very hot days in Australia since World War I. So hot weather (short term) and hot climate (long term) have nothing to do with the wildfire outbreak.

December’s extremes — heat in Australia, flooding in east Africa, cold in India — all were caused by a strong PIOD, not climate change.

These weather events neither prove nor disprove man-made climate change. But they do expose the bias of climate alarmists who blame them on man-made global warming.

Vijay Jayaraj (M.Sc., Environmental Science, University of East Anglia, England) is a research contributor for the Cornwall Alliance for the Stewardship of Creation.

Footnote:

The real tragedy is that Australian officials keep obsessing over their bogus climate models instead taking seriously real world weather warnings. It is not like they had no advance notice; this was published May 16, 2019, which should have triggered major efforts to reduce the fuel load long before summer.

ABC Online: A positive Indian Ocean Dipole this winter is bad news for drought-hit parts of Australia

Cool seas off WA’s north-west could kick off a climatic phenomenon that may exacerbate a winter drought across central and southern Australia.

See Also Aussies’ Choice:  Burn Cool or Burn Hot

Aussies’ Choice: Burn Cool or Burn Hot

Global Warming is Not to Blame for the Horrific Bush fires in Australia by Jon Gaunt, writing from England on the distorted media coverage, published at Sputnik

There I have said the unsayable but don’t hold your breath, you will not hear that on the MSM biased broadcasters like Sky or BBC.

Of course, this is only my opinion but it is an opinion held by millions and deserves to be heard surely?

I hoped after the media bias over the Brexit debate and the General election that the MSM broadcasters would stop emoting and get back to reporting but alas my optimism was misplaced.

It appears to me that because the BBC and Sky News lost the Remainer narrative and the trash Boris agenda and the British public that they have now switched their attention and propaganda machine to promote climate change danger and the agenda of Greta.

The BBC seem determined and desperate to blame the horrific fires in Australia on their global warming agenda and seem very reluctant to mention that over a hundred people have already been arrested for setting fires.

Arson has always been a feature of these annual bush fires and of course the fires themselves are not a new phenomenon either.

I’m not denying that the extremely hot temperatures and dry weather haven’t contributed to the scale of the disaster but isn’t it a reporter’s job to give all sides of a story?

Like many people I don’t doubt that Global warming is happening but I am not convinced that is man-made and that opinion should be reflected in reports.

This is not a game, people have died and many are missing and hundreds of people have or are going to lose their homes.

This is not a time for sixth form, pig tailed, Greta style politicising and propaganda tricks to push the green agenda.

Which of course always ends at the same destination. With working class people losing their manufacturing jobs and being taxed to the hilt when they start ‘Burger flipping’. Meanwhile preaching pop stars and Royals still fly around the globe in private jets whilst paying to offset their carbon ‘Birkenstock’ footprint.

It is, if you pardon the image, all smoke and mirrors and broadcasters should be ashamed of themselves particularly the State one that we pay for via a compulsory poll tax.

Last night the BBC reported/emoted on the fires and then followed it with a report about the last decade being the second hottest on record. The implication was clear and was almost the media manipulation of a five-year-old.

Do they really think that we are that thick? Unfortunately, I believe that they do. It would appear that to use a football chant, ‘two referendums and one election’ has taught them absolutely nothing.

Aussie PM, Scott Morrison, on a visit to Cobargo a town that has almost been destroyed by the fires, got a real hard time from angry and distraught residents yesterday and rightly so.

He was a complete idiot to go to Hawaii whilst his country burned. However, the visit and the refusal by one firefighter to shake his hand was interpreted by the biased broadcasters as if these people were green activists rather than people who had lost their homes and were bloody angry with the establishment class for ignoring them.

These people telling him he was a “Fu*kwit and to pi** off didn’t strike me as green activists or members of Extinction rebellion, no these were normal people who felt let down and forgotten by the political class. Is that attitude ringing any bells with you?

Have you seen the video of the Australian who has a completely different narrative of what has caused these fires? Although his language is extremely fruity, to say the least, his point is that it is actually green activists that have led to the scale of these fires because they have forced farmers to stop burning their scrubland in the winter months which used to create natural fire breaks. This is a tradition that goes back centuries and was actually practiced by the original indigenous Australian Aboriginal population. This possible cause is echoed all over social media today in many tweets from the affected area today.

But that didn’t stop Caroline Lucas the Green Party’s only MP in the UK from entering the fray with a tweet with a link to an article in (you guessed it) the Guardian saying, ‘This is what Climate Emergency looks like – completely terrifying. Honestly, what further devastation needs to happen before world leaders finally put in place urgent climate action at the scale and speed the science demands?’

However, she has had her fingers burnt with angry exchanges on Twitter from people who actually live in New South Wales.

One British ex-pat, Terry Stone, angrily answered her tweet with the following, ‘You have no clue what is happening here. Green lobby stupid restrictions on controlled burns & removal of dead wood is primary reason these fires cannot be controlled. Listen to multiple generations of land owners and keep your mouth shut, you might learn something.’

Another tweeted, ‘I’m a rural Victoria resident. In addition to less burning off than used to happen, we’re restricted collecting dead wood in forests for our wood burners at home (principal heating) in case we inadvertently squish rare lizard or such. And then millions of animals die instead. Ugh’

Have you heard these views on Sky or the BBC? No of course not because Sky are too busy rabidly pushing the ‘woke’ agenda and today they had the leading climate change purveyor of doom and gloom, George Monbiot from (yes, you’ve guessed it) the Guardian on their programme.

Monbiot condemned, and was unchallenged, the Aussie Pm and stated that the Bush fires were a prime example of climate breakdown and that we need political leaders who are going to leave fossil fuels in the ground. Again, this ludicrous statement went unchallenged. In fact, the person Sky chose to conduct this debate and I use the term really loosely was some sort of PR guy who was on to suggest how Morrison could rebuild his reputation after the disaster. Putting aside the fact that Morrison has just won another election why was a PR man on. Why not use someone like James Delingpole or any other climate change sceptic to challenge Monbiot’s views? Well we all know the answer to that one, don’t we!

Sky News backed up Monbiot’s simplistic ludicrous blame game by reminding viewers and their internet readers that “Rewind a few years and he (Morrison) was brandishing a lump of coal in parliament, taunting those he described as having a “pathological fear of coal” and lauding the fossil fuel he said was powering Australia’s economy and underpinning jobs.” Is this what Sky call impartial and balanced reporting?

But unfortunately for George, Sly News and the climate change fanatics Morrison was correct as Australia is the biggest net exporter of coal and is the world’s fourth-largest producer. Over 175,000 people are either directly or indirectly employed in the industry.

In the real world a leader has to balance these real factors before looking to be loved by the MSM broadcasters and avoid the death stare of Greta!

The BBC and Sky’s simplistic and biased telling of this story is almost turning them into the Greta Broadcasting Corporation where they tell us the problem but only half of the solution.

So, called man made global warming is not the primary villain in this story.

The people who are responsible for: the 17 deaths so far, the hundreds of houses destroyed and lives ruined, the burning alive of half a billion animals and the torching of over 5 Billion hectares of land and forest and thousands of Aussies being evacuated from beaches are not those who dig coal but those who despise those who dig coal or work the land.

See Also Arctic On Fire! Not.

Footnote: So how do you want your bush fires, some small ones now or mega fires later?

Dec. 31 Arctic Ice Hits Average

The image above shows recovery of Arctic sea ice extent over the month of December 2019. As supported by the table later, the pace of refreezing allowed 2019 to match and exceed for a few days the 12 year average (2007 to 2018 inclusive).

The month began with seas on the Eurasian side (left) already ice-covered, so no additional extent came from there.  OTOH Hudson Bay (right) filled in completely, gaining from 445k km2 to 1255k km2, virtually to its max.  Most of the action now is on the Pacific side (bottom) where Chukchi iced over, and Bering (center) and Okhotsk (left) have started to freeze in ernest.

The graph below shows the ice extent growing during December compared to some other years and the 12 year average (2007 to 2018 inclusive).

Note that the  NH ice extent 12 year average increases almost 2M km2 during December, up to 13.1M km2. MASIE 2019 shows a faster icing rate, starting 600k km2 lower than average before reaching and surpassing the average, ending December in a virtual tie with average.  Both 2018 and 2017 were lower at this point, while MASIE and SII are tracking closely together.

Region 2019365 Day 365 Average 2019-Ave. 2017365 2019-2007
 (0) Northern_Hemisphere 12980000 13070435  -90436  12628187 351813 
 (1) Beaufort_Sea 1070655 1070266  389  1070445 210 
 (2) Chukchi_Sea 965972 964161  1811  943883 22090 
 (3) East_Siberian_Sea 1087137 1087134  1087120 18 
 (4) Laptev_Sea 897845 897842  897845
 (5) Kara_Sea 929682 880747  48935  892689 36993 
 (6) Barents_Sea 479642 424886  54756  331819 147823 
 (7) Greenland_Sea 590098 568883  21215  555757 34341 
 (8) Baffin_Bay_Gulf_of_St._Lawrence 851131 1016132  -165001  978074 -126943 
 (9) Canadian_Archipelago 854282 853098  1185  853109 1174 
 (10) Hudson_Bay 1254576 1231781  22795  1260838 -6262 
 (11) Central_Arctic 3228672 3206086  22586  3191526 37147 
 (12) Bering_Sea 362317 439846  -77529  194350 167967 
 (13) Baltic_Sea 8738 32177  -23439  13345 -4607 
 (14) Sea_of_Okhotsk 390113 376320  13793  336595 53518 

The table shows where the ice is distributed compared to average.  Bering Sea and Baffin Bay have the only deficits to average, while other regions are at or above average;  Kara and Barents Seas are in surplus.

Footnote:  Interesting comments recently by Dr. Judah Cohen at his blog regarding the Arctic fluctuations. Excerpts with my bolds.

I have said many times the first thing that you learn as a seasonal forecaster is humility and these are one of those times. What is humbling me at the moment is that I have expected a weakening of the stratospheric polar vortex (PV) based on fall Arctic predictors – extensive Siberian snow cover, more limited Arctic sea ice extent and a relatively warm Arctic. Following the PV weakening or disruption, severe winter weather would be more frequent at least regionally across the mid-latitudes of the Northern Hemisphere (NH). But to be honest it is hard to see from today’s viewpoint how this verifies. And as I have shared on Twitter the new operational GFS, the FV3, has been especially bullish on a strong PV.

The biggest challenge that I see right now is the center of low mid-tropospheric heights currently just north of Alaska and is expected to expand in breadth over the next two weeks enough so to fill the entire Arctic basin. This a fairly class pattern of low heights in the Arctic and high heights in the mid-latitudes resulting in a cold Arctic/warm continents pattern, all consistent with a positive AO. It seems a bit ironic (at least to me) that with the record low sea ice in the Chukchi-Bering seas this fall, the incredibly warm year Alaska just experienced both in part due to persistent ridging in the region, this same region is predicted to now experience an extended period of low heights and below normal temperatures. As an aside, this is something that I had a hard time anticipating even just a few weeks ago. 

So, for now I remain steadfast in the winter forecast that based on high fall snow cover/low Arctic sea ice that they will in tandem perturb the PV. Given the westerly quasi-biennial oscillation (QBO) I expect a scenario somewhere between winter 2016/17 and winter 2017/18. Both of those winters were westerly QBO winters and the most significant disruption of the stratospheric PV took place in February.

Illustration by Eleanor Lutz shows Earth’s seasonal climate changes. If played in full screen, the four corners present views from top, bottom and sides. It is a visual representation of scientific datasets measuring Arctic ice extents.

Greta’s Glittering Generalities

The term “glittering generality” was impressed on me by an English teacher who red-circled several expressions in my essay with the label “GG”. When I asked what was wrong, she told me pretty much what Wikipedia says:

A glittering generality is an emotionally appealing phrase so closely associated with highly valued concepts and beliefs that it carries conviction without supporting information or reason. Such highly valued concepts attract general approval and acclaim.

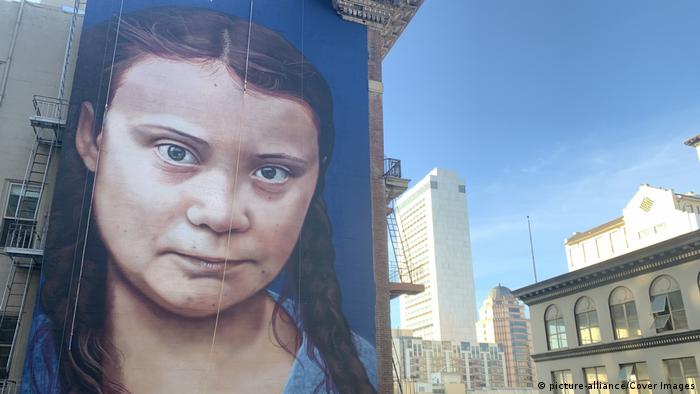
Background on Greta’s Pretences

In September Greta spoke to the UN Climate Summit in NYC and attempted to browbeat the world’s leaders into doing something about global warming/climate change. However, she came off as a whiny, spoiled brat throwing a tantrum in public to get her way. Her speechwriters took note of the negative responses and regrouped for her speech to the Madrid COP. The new approach was to elicite the audience’s concern by appealing to a bunch of glittering generalities. H/T to Patrick Moore for leading in the effort to challenge her platitudes. After all, it is irresponsible to let a child get away with telling falsehoods; that only spurs them on to become liars as adults. And teenage is the critical period to learn the dfference between imaginary things and realities, to engage with life’s school of hard knocks rather than retreat into wishdreams and fantasies, drug-induced or othewise.

Greta Thunberg UN speech at COP25 in full

The title links to a transcript of the climate activist’s message to the UN’s climate conference on Wednesday, December 11, at the United Nations Climate Change Conference COP25 in Madrid, Spain. Excerpts in italics with my bolds, images and comments.

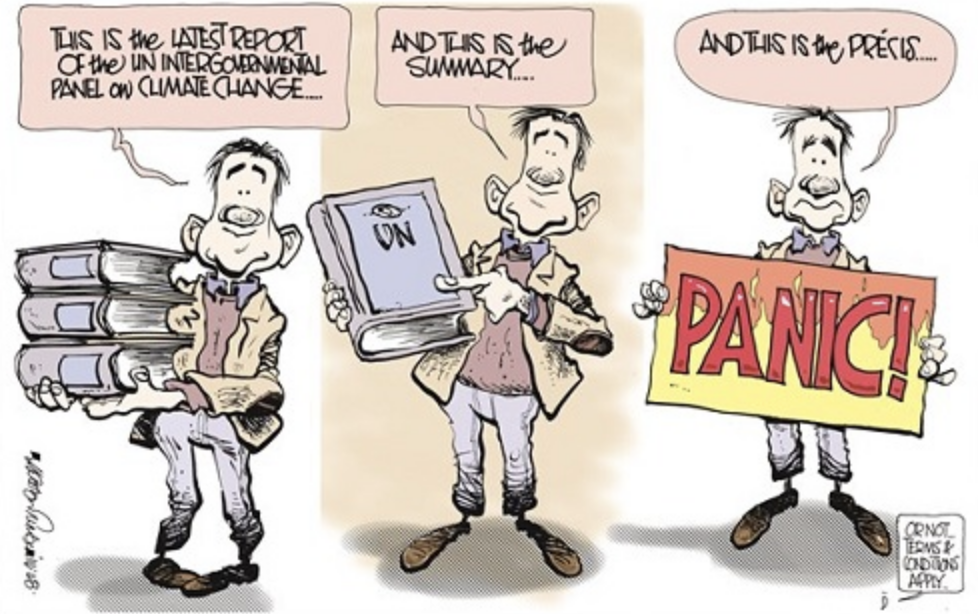
Greta Thunberg: “Hi. A year and a half ago, I didn’t speak to anyone unless I really had to but then I found a reason to speak. Since then, I’ve given many speeches and learned that when you talk in public, you start with something personal or emotional to get everyone’s attention. Say things like, ‘our house is on fire, I wanted to panic or how dare you’.

“But today I will not do that because then those phrases are all that people focus on. They don’t remember the facts, the very reason why I say those things in the first place, we no longer have time to leave out the science.

“For about a year I have been constantly talking about our rapidly declining carbon budgets over and over again. But since that is still being ignored, I will just keep repeating it

“In chapter two, on page 108 in the SR 1.5 IPCC report that came out last year, it says that if we ought to have a 6 percent to 7 percent chance of limiting the global temperature rise to below 1.5C degrees, we had on January 1, 2018, 420 gigatons of CO2 left to emit in that budget. And of course, that number is much lower today as we emit about 42 gigatons of CO2 every year including land use.

“With today’s emissions levels, that remaining budget will be gone within about eight years. These numbers aren’t anyone’s opinions or political views. This is the current best available science.

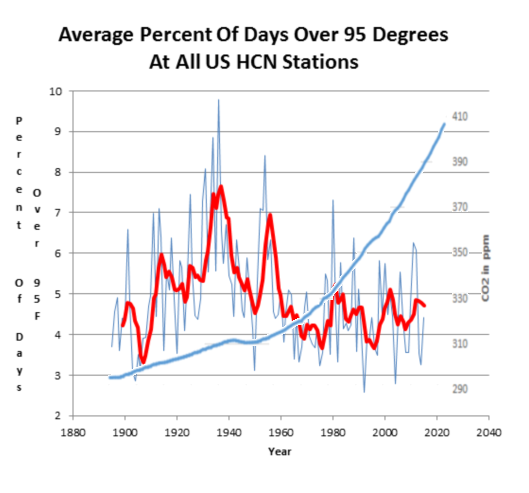
Heat Waves Compared to Atmospheric CO2

“Though many scientists suggest these figures are too moderate. These are the ones that have been accepted through the IPCC, and please note that these figures are global and therefore do not say anything about the aspect of equity, which is absolutely essential to make the Paris Agreement to work on a global scale.

“That means that richer countries need to do their fair share and get down to real zero emissions much faster and then help poorer countries do the same, so people in less fortunate parts of the world can raise their living standards. These numbers also don’t include most feedback loops, nonlinear tipping points, or additional warming hidden by toxic air pollution.

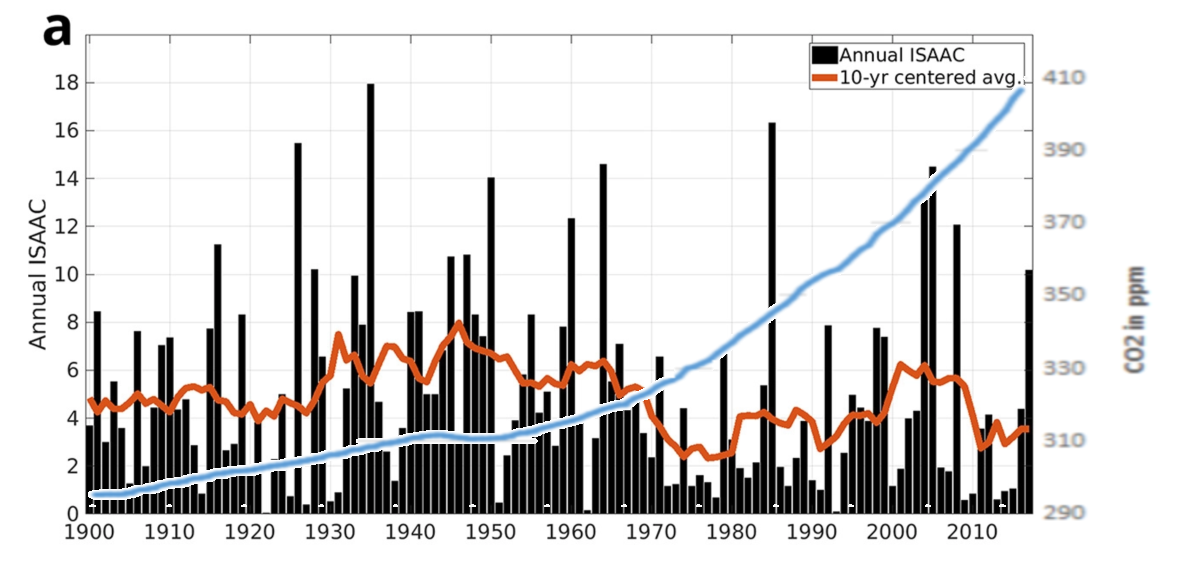
Atlantic Storm Activity Compared to Atmospheric CO2

“Most models assume, however, that future generations will somehow be able to suck hundreds of billions of tons of CO2 out of the air with technologies that do not exist in the scale required and maybe never will. The approximate 6 percent to 7 percent chance budget is the one with the highest odds given by the IPCC. And now we have less than 340 gigatons of CO2 left to emit in that budget to share fairly.

[Let’s deconstruct Greta’s cabon budget “science.” It is math alright, but she apparently lacks the will or critical intelligence to challenge the stack of suppositions underneath.

Assume that Global Mean Temperatures (GMT) are driven by rising CO2 in the air.
Assume that Rising CO2 comes entirely from burning fossil fuels.
Assume that keeping CO2 below 450ppm limits warming to 2C over preindustrial.
Assume that keeping CO2 below 430ppm limits warming to 1.5C over preindustrial.
Assume that GMT warming over 1.5C will cause dangerous weather events.
Assume that future warming of 2C will not benefit mankind as did the last 2C since the LIA.

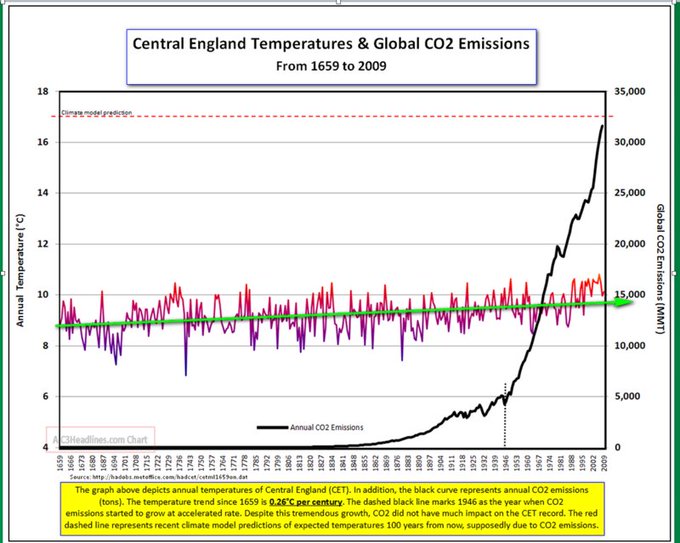
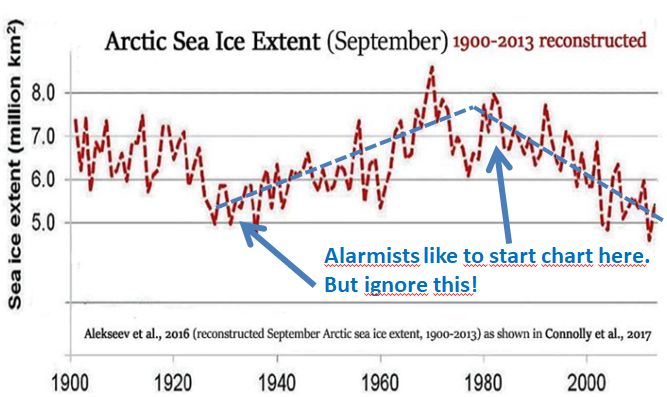
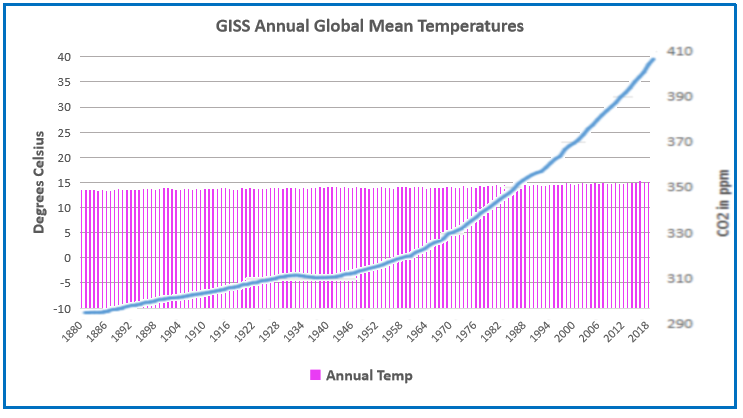
The Longest Temperature Record compared to CO2 Emissions.

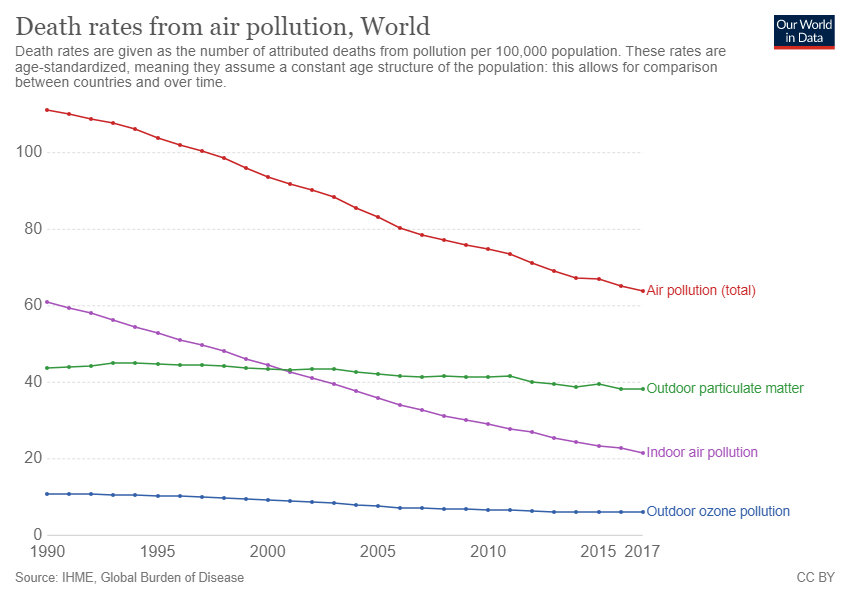
“Why is it so important to stay below 1.5 degrees? Because even at one degree people are dying from the climate crisis. Because that is what the United Science calls for to avoid destabilising the climates.

[What’s this, a new US?  The United States is a thing, United Science, not so much.]

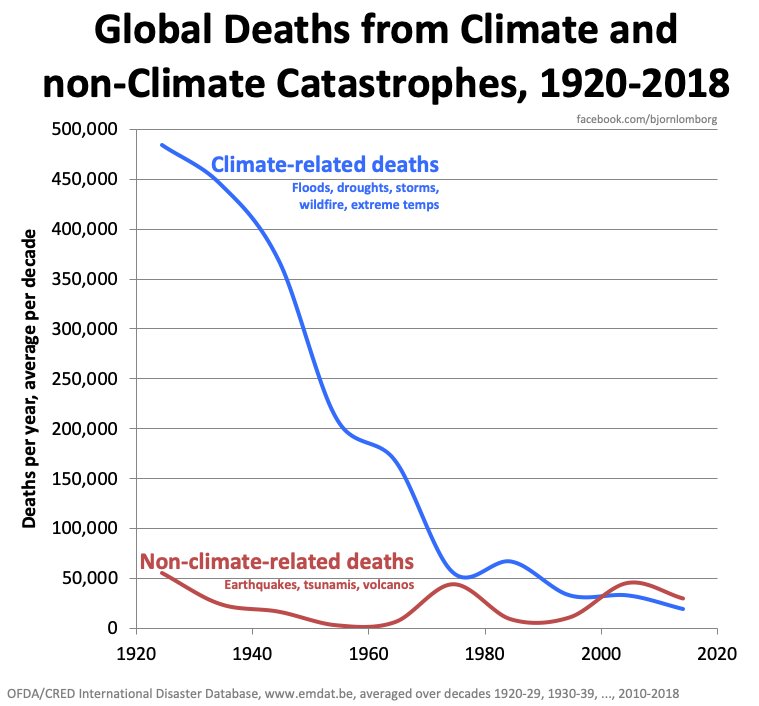
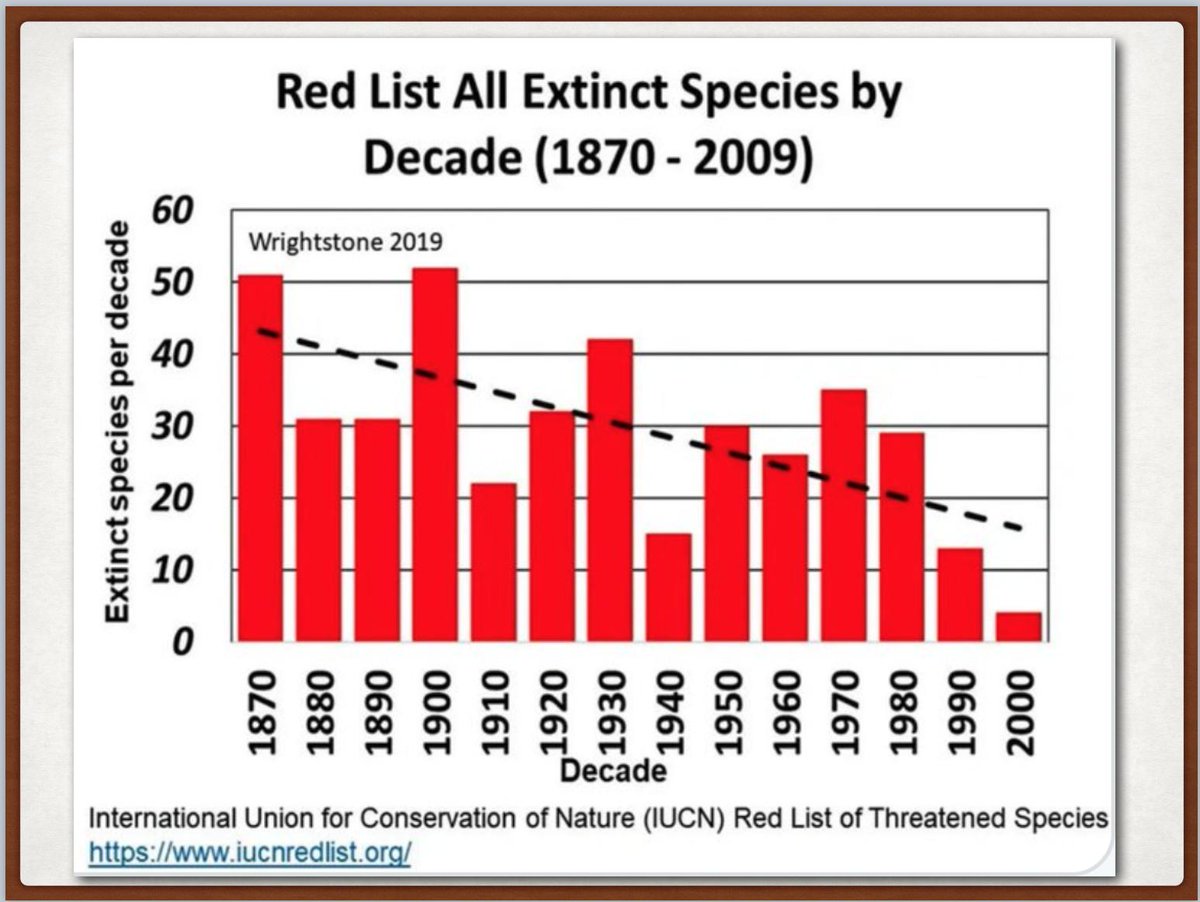
In Fact, fewer and fewer people are dying from climate events.

“So that we have the best possible chance to avoid setting off irreversible chain reactions such as melting glaciers, polar ice and thawing Arctic permafrost. Every fraction of a degree matters. So there it is, again. This is my message. This is what I want you to focus on.”

“So please tell me, how do you react to these numbers without feeling at least some level of panic? How do you respond to the fact that basically nothing is being done about this without feeling the slightest bit of anger? And how do you communicate this without sounding alarmist? I would really like to know.

“Since the Paris Agreement, global banks have invested 1.9 trillion US dollars in fossil fuels. One hundred companies are responsible for 71 percent of global emissions.

The G20 countries account for almost 80 percent of total emissions. The richest 10 percent of the world’s population produce half of our CO2 emissions, while the poorest 50 percent account for just one-tenth. We indeed have some work to do but some more than others.

“Recently, a handful of rich countries pledged to reduce their emissions of greenhouse gases by so-and-so many percent by this or that date or to become climate neutral or net zero in so-and-so many years. This may sound impressive at first glance but even though the intentions may be good, this is not leadership.

“This is not leading. This is misleading because most of these pledges do not include aviation, shipping, and imported and exported goods and consumption. They do, however, include the possibility of countries to offset their emissions elsewhere.

“These pledges don’t include the immediate yearly reduction rates needed for wealthy countries, which is necessary to stay within the remaining tiny budget. Zero in 2050 means nothing, if high emission continues even for a few years, then the remaining budget will be gone.

“Without seeing the full picture, we will not solve this crisis. Finding holistic solutions is what the cup should be all about, but instead, it seems to have turned into some kind of opportunity for countries to negotiate loopholes and to avoid raising their ambition.

Area Burned by Forest Fires Compared to CO2 Emissions.

“Countries are finding clever ways around having to take real action. Like double-counting emissions reductions and moving their emissions overseas and walking back on their promises to increase ambition or refusing to pay for solutions or loss of damage. This has to stop.

“What we need is real drastic emission cuts at the source but of course, just reducing emissions is not enough. Our greenhouse gas emissions has to stop. To stay below 1.5 degrees. We need to keep the carbon in the ground. Only setting up distant dates and saying things which give the impression of the action is underway will most likely do more harm than good because the changes required are still nowhere in sight.

“The politics needed does not exist today despite what you might hear from world leaders. And I still believe that the biggest danger is not inaction. The real danger is when politicians and CEOs are making it look like real action is happening when in fact almost nothing is being done apart from clever accounting and creative PR.

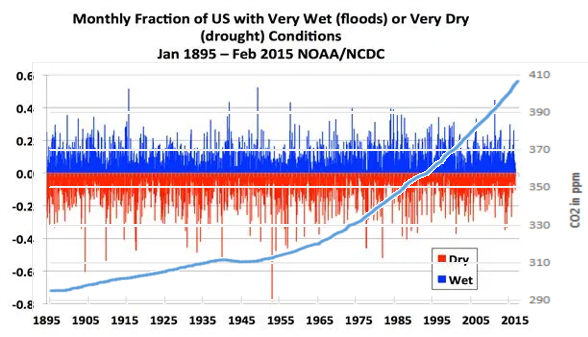
US Droughts and Flooding Compared to Atmospheric CO2.

“I have been fortunate enough to be able to travel around the world. And my experience is that the lack of awareness is the same everywhere, not the least amongst those elected to lead us. There is no sense of urgency whatsoever. Our leaders are not behaving as if we were in an emergency.

“In an emergency, you change your behaviour. If there is a child standing in the middle of the road and cars are coming at full speed, you don’t look away because it’s too uncomfortable. You immediately run out and rescue that child.

“And without that sense of urgency, how can we, the people understand that we are facing a real crisis. And if the people are not fully aware of what is going on, then they will not put pressure on the people in power to act. And without pressure from the people, our leaders can get away with basically not doing anything, which is where we are now. And around and around it goes.

“Well, I’m telling you, there is hope. I have seen it but it does not come from the governments or corporations. It comes from the people.

“The people who have been unaware but are now starting to wake up. And once we become aware, we change. People can change. People are ready for change. And that is the hope because we have democracy and democracy is happening all the time.

“Not just on election day but every second and every hour. It is public opinion that runs the free world. In fact, every great change throughout history has come from the people. We do not have to wait. We can start the change right now.

“We the people. Thank you.”
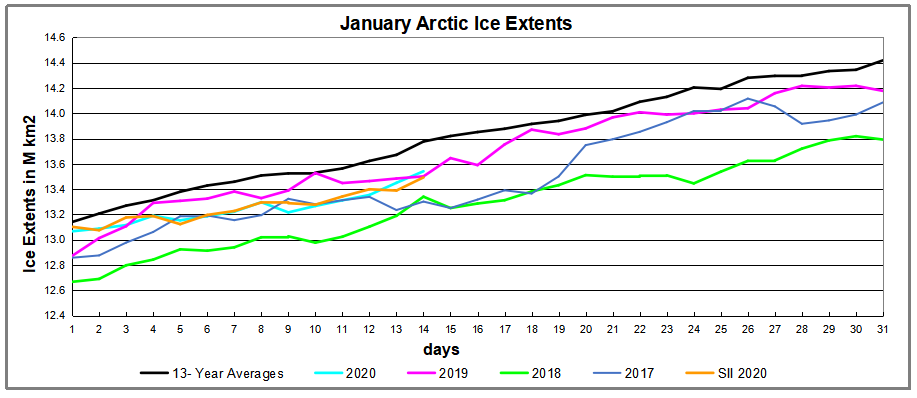
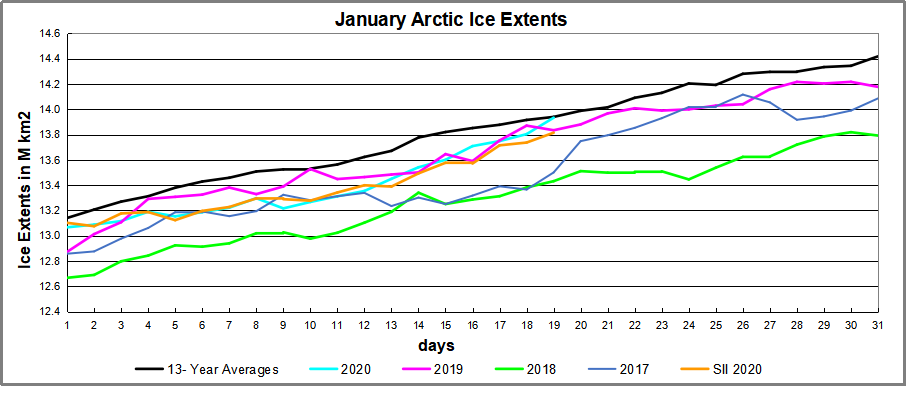
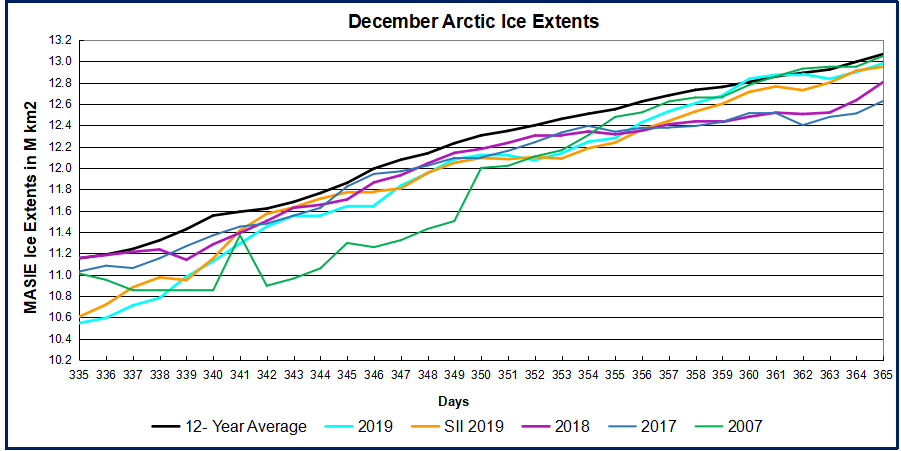