Yes, The Climate Changes

Michael Foley writes at Quora (Excerpts in italics with my bolds and added images.)

Q:  Why do most scientists believe that the climate is changing? 

A:  Because it is. But most scientists do not believe
human activity is the cause of the change.

The 97% of scientists belief fraud, which has been proven to be a fraud over and over again, was based on a review of the scientific literature on climate. Over 10,000 papers were reviewed and of those only about 2,000 mentioned climate change of those 1,900 were eliminated for various reasons (some of those reasons were bias based) resulting in 100 papers. Of those 100 papers 97 concluded that man’s activity may have a roll in climate change. They ranged from very likely to maybe, which is what came to be reported as the 97% figure.

There is no argument that the climate is changing,
it always has and will always continue to change.

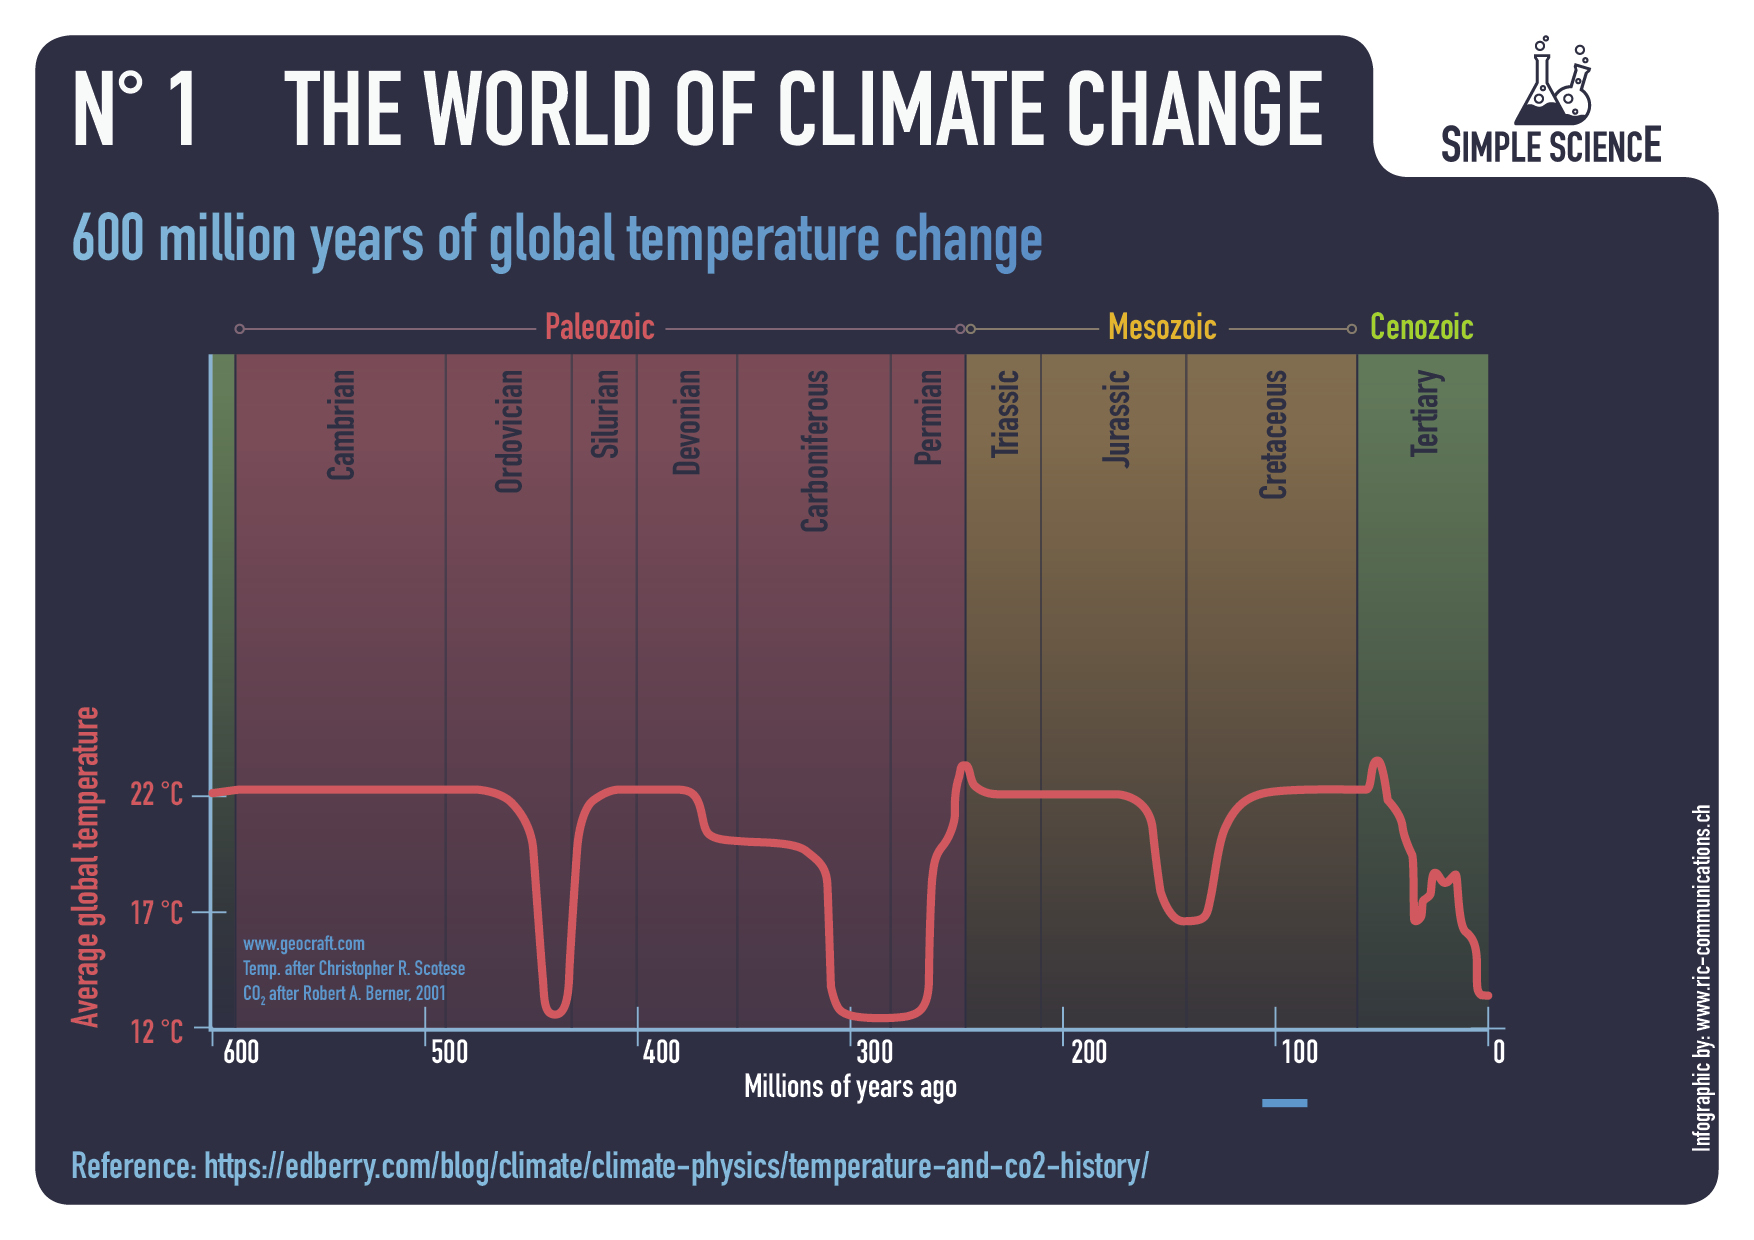
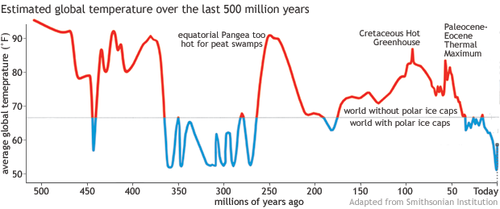
From ice cores and ocean sediment cores it has been established that the earth has regular and generally predictable 2 major climate cycles. They are classified as a Greenhouse cycle (defined as a period where there are NO PERMANENT ice sheet anywhere on earth) and Ice Ages ( defined as periods where there are permanent ice sheets in at least 1 Hemisphere).

Each of these major cycles has several sub cycles. Ice ages have 2 major sub cycles called Interglacial and Glaciation. 73% of earth’s existence has been during a a Greenhouse period. The remaining 27% has been in at least 5 ice ages. We are currently in an Ice age. To be more exact we are living in an Interglacial phase of the current Ice age which has been going on for around 11,500 years. The 2 subcycles also have additional subcycles which last on average of 500 years. The two last such mini cycles are known by the names the Little Ice Age and the Medieval Warm Period.

The little ice age ended in the late 1800’s with 1880 being the generally used end date. Interesting enough climate alarmists almost exclusively use this date as the start date for any chart or graph they use in support of their theory. It is also important to realize that man made global warming (by burning fossil fuels and thereby contributing to atmospheric CO2) is a theory and has such remains an unproven theory.

Despite the claim of some who say the science is settled and that there is a scientific consensus.

Both of these claims should raise red flags for anyone who has even an elementary school level of science education. For starters, science is NEVER settled, our scientific understanding and knowledge is constantly changing and theories that have been accepted for decades, centuries and millennia are proven false or modified almost daily. For example,  the Big Bang theory is no longer a credible theory of how the universe started. But is still generally accepted in the general public. Secondly, science is not about a consensus period. Science is a search for the true. Either a theory is true or it is false. In order for a theory to reach a level of scientific acceptance requires the use of the scientific method, which involves testing the theory and retesting, them releasing all the information and data gathered in the testing to allow it to be reviewed by others and allowing others to try and duplicate the original experiment.

If just one of these efforts fails to confirm the results of the original finding theory is not validated. Therefore a consensus believing something is the case is irrelevant.

A consensus used to believe that the earth was flat, that the earth was the center of the universe, that the sun orbited around the earth and each of these beliefs were strongly defended. When you look at the efforts of the climate alarmist research and testing of their theory you find that not one of their efforts has resulted in a conclusion that the theory is correct. Not only that but those experiments that have claimed to support the theory have never released their data sets or methodologies for review.

The first graph appeared in the IPCC 1990 First Assessment Report (FAR) credited to H.H.Lamb, first director of CRU-UEA. The second graph was featured in 2001 IPCC Third Assessment Report (TAR) the famous hockey stick credited to M. Mann.

The most famous of these is Michael Mann’s hockey stick graph that purported to show a relatively stable climate prior to the mid 1900’s. This graph became the poster child for the UN’s IPCC 1st climate assessment report. Man refused to release the data sets he used or let others review his methods or computer programs that came up with the hockey stick. However, Mann’s hockey stick graph eventually was proven to be a fraud. The IPCC quietly dropped it from their 3rd assessment. Each IPCC assessment has adjusted the predicted climate change downward to where the latest report has a predicted climate change resulting from human activity to be 2 to 3 degrees C over the next 100 years.

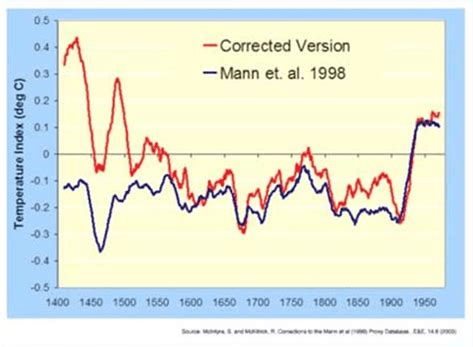
The original MBH graph compared to a corrected version produced by MacIntyre and McKitrick after undoing Mann’s errors.

However, even that amount remains nothing more than a computer model prediction which has not been proven.

Why so many people are so willing to accept a theory without any evidence and are so willing to accept the demanded changes to how we live with no evidence is a truly remarkable thing. Climate alarmist will point to every weather event as proof of man’s destruction of the planet. Even when the science has proven time and again that the supposed weather events are in fact well within the natural cycle of events. All of these claims and efforts are efforts to bring within the human experience (life time) evidence of climate change and the man made use of fossil fuels has the cause.

Even though NONE of the predictions made over the last 50 years has come to fruition. NOT ONE OF THEM. How can a group promoting and claim and being wrong every single time still be consider credible, is simply incredible. Some, maybe most are sincere in their belief but instead of using the evidence that is available they are simply Lemmings. Others, the politicians and those with an economic stake in turning the economy upside down are acting out of basic greed. Greed for power and money.

Climate changes occur on geologic timeframes,
which are measured in thousands and millions of years, not in human life times.

See also Rise and Fall of the Modern Warming Spike

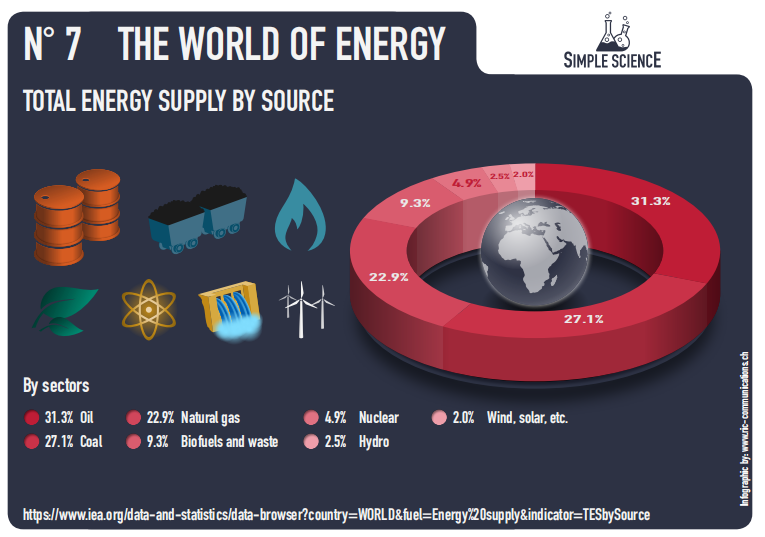
World of Climate Change Infographics


No Stopping Wind and Solar in Cal and NY States

Hecate Energy, a developer, owner and operator of renewable power projects and energy storage solutions, has received state approval of its siting application for the 500 MW Cider Solar Farm in New York.

Wondering where will be spent hundreds of billions of US$ from the climate bill?  Two states have the inside track by abolishing citizens’ rights regarding siting of renewables projects. Matthew Eisenson explains at the Columbia Climate Law Blog New California Law Allows State to Bypass Local Restrictions in Siting Large-Scale Renewables.  Excerpts in italics with my bolds.

On June 30, 2022, the State of California joined the State of New York in adopting legislation that allows state authorities to bypass local laws in permitting large-scale renewable energy projects.

California’s new law, AB 205, gives the California Energy Commission (the “commission”) exclusive authority to issue a certificate for any:

(a) photovoltaic solar facility, on-shore wind facility, or thermal energy facility not powered by fossil fuels or nuclear fuels, with a generating capacity of at least 50 megawatts (MW);
(b) energy storage system with a storage capacity of least 200 megawatt hours;
(c) electric transmission line from any such generating or storage facility to an interconnected transmission system; and
(d) facility that manufactures, produces, or assembles wind, solar, or storage systems, with a capital investment of at least $250,000,000 over a period of 5 years. See California Public Resources Code § 25545(b).

AB 205 explicitly supersedes local permitting and local ordinances.

Specifically, it provides that the commission’s issuance of a certificate shall:

“be in lieu of any permit, certificate, or similar document required by any state, local, or regional agency,” id. § 25545.1(b)(1) (emphasis added); and
“supersede any applicable statute, ordinance, or regulation of any state, local, or regional agency,” id. (emphasis added).

The law further requires that applications be decided expeditiously, providing that:

“[w]ithin 30 days of the submission of the application, the commission shall review the application and make a determination of completeness,” id. § 25545.4(a) (emphasis added); and
“no later than 270 days after the application is deemed complete, or as soon as practicable thereafter, the commission shall determine whether to certify the environmental impact report and to issue a certificate” unless an exception applies, id. § 25545.4(e)(1) 

July 26, 2022 Cider Solar Farm is to be built on nearly 3,000 acres across the towns of Elba and Oakfield. Hecate Energy anticipates starting construction on the solar farm by 2023.

In New York State likewise the Accelerated Renewable Energy Growth and Community Benefit Act of 2020, as codified at New York Executive Law § 94-c, charges the Office of Renewable Energy Siting (ORES) with responsibility for permitting “major renewable energy facilities,” which include: (a) renewable energy facilities of at least 25 MW; (b) co-located energy storage systems; and (c) associated electric transmission systems less than 10 miles in length. See Exec. Law § 94-c(2)(h). Developers of renewable energy facilities of at least 20 MW but less than 25 MW may also submit applications to ORES. Id. § 94-c(4)(g).

While those applying for a permit to construct a major renewable energy facility in New York must “consult[] with the municipality or political subdivision where the project is proposed to be located . . . [concerning] the procedural and substantive requirements of local law,” ORES is authorized to set aside local laws on a case by case basis when deciding whether or not to grant a permit. Specifically, the law provides that ORES:

“may elect not to apply, in whole or in part, any local law or ordinance which would otherwise be applicable if it makes a finding that, as applied to the proposed major renewable energy facility, it is unreasonably burdensome in view of the CLCPA targets and the environmental benefits of the proposed major renewable energy facility.”

Id. § 94-c(5)(e) (emphasis added).

In addition, New York’s siting law, like California’s new siting law, requires that applications for large-scale renewables be decided expeditiously. In particular, ORES must:

determine within 60 days whether the application is complete, id. § 94-c(5)(b); and
make a final determination on a siting permit within one year of determining that an application is complete or within six months if the project is to be sited on an existing or abandoned commercial use, id. § 94-c(5)(f).

Notwithstanding these two laws, local restrictions remain a major impediment
to siting renewable energy projects in the United States.

As of March 2022, the Sabin Center had identified 121 local ordinances across the country to block or restrict renewable energy facilities. These policies range from outright bans to temporary moratoria to zoning restrictions so severe that they effectively preclude renewable energy projects. State authorities in California and New York now have the power to bypass such restrictions. However, in most states, there is no legislation allowing state authorities to do so.

Replacing the now closed Indian point nuclear power plant with wind turbines would require land the size of Albany county NY. (320,000 acres)


July 2022 UAH Rebound from June Cooling

The post below updates the UAH record of air temperatures over land and ocean.  But as an overview consider how recent rapid cooling  completely overcame the warming from the last 3 El Ninos (1998, 2010 and 2016).  The UAH record shows that the effects of the last one were gone as of April 2021, again in November 2021, and in February and June 2022  (UAH baseline is now 1991-2020).

For reference I added an overlay of CO2 annual concentrations as measured at Mauna Loa.  While temperatures fluctuated up and down ending flat, CO2 went up steadily by ~55 ppm, a 15% increase.

Furthermore, going back to previous warmings prior to the satellite record shows that the entire rise of 0.8C since 1947 is due to oceanic, not human activity.

gmt-warming-events

The animation is an update of a previous analysis from Dr. Murry Salby.  These graphs use Hadcrut4 and include the 2016 El Nino warming event.  The exhibit shows since 1947 GMT warmed by 0.8 C, from 13.9 to 14.7, as estimated by Hadcrut4.  This resulted from three natural warming events involving ocean cycles. The most recent rise 2013-16 lifted temperatures by 0.2C.  Previously the 1997-98 El Nino produced a plateau increase of 0.4C.  Before that, a rise from 1977-81 added 0.2C to start the warming since 1947.

Importantly, the theory of human-caused global warming asserts that increasing CO2 in the atmosphere changes the baseline and causes systemic warming in our climate.  On the contrary, all of the warming since 1947 was episodic, coming from three brief events associated with oceanic cycles. 

Update August 3, 2021

Chris Schoeneveld has produced a similar graph to the animation above, with a temperature series combining HadCRUT4 and UAH6. H/T WUWT

image-8


mc_wh_gas_web20210423124932

See Also Worst Threat: Greenhouse Gas or Quiet Sun?

July Update Land and Sea Temps Rebound from June Cooling

banner-blog

With apologies to Paul Revere, this post is on the lookout for cooler weather with an eye on both the Land and the Sea.  While you will hear a lot about 2020-21 temperatures matching 2016 as the highest ever, that spin ignores how fast the cooling set in.  The UAH data analyzed below shows that warming from the last El Nino was fully dissipated with chilly temperatures in all regions. May NH land and SH ocean showed temps matching March, reversing an upward blip in April, and then June was virtually the mean since 1995.

UAH has updated their tlt (temperatures in lower troposphere) dataset for July 2022.  Previously I have done posts on their reading of ocean air temps as a prelude to updated records from HadSST3 (which is now discontinued). So I have separately posted on SSTs using HadSST4 Ocean SSTs Stay Mild June 2022  This month also has a separate graph of land air temps because the comparisons and contrasts are interesting as we contemplate possible cooling in coming months and years. Sometimes air temps over land diverge from ocean air changes.  However, last month showed air temps over all ocean regions warmed sharply, lifting up Global ocean temps. Land temps also rose, especially in SH, resulting in a higher Global land anomaly. 

Note:  UAH has shifted their baseline from 1981-2010 to 1991-2020 beginning with January 2021.  In the charts below, the trends and fluctuations remain the same but the anomaly values change with the baseline reference shift.

Presently sea surface temperatures (SST) are the best available indicator of heat content gained or lost from earth’s climate system.  Enthalpy is the thermodynamic term for total heat content in a system, and humidity differences in air parcels affect enthalpy.  Measuring water temperature directly avoids distorted impressions from air measurements.  In addition, ocean covers 71% of the planet surface and thus dominates surface temperature estimates.  Eventually we will likely have reliable means of recording water temperatures at depth.

Recently, Dr. Ole Humlum reported from his research that air temperatures lag 2-3 months behind changes in SST.  Thus the cooling oceans now portend cooling land air temperatures to follow.  He also observed that changes in CO2 atmospheric concentrations lag behind SST by 11-12 months.  This latter point is addressed in a previous post Who to Blame for Rising CO2?

After a change in priorities, updates are now exclusive to HadSST4.  For comparison we can also look at lower troposphere temperatures (TLT) from UAHv6 which are now posted for July.  The temperature record is derived from microwave sounding units (MSU) on board satellites like the one pictured above. Recently there was a change in UAH processing of satellite drift corrections, including dropping one platform which can no longer be corrected. The graphs below are taken from the revised and current dataset.

The UAH dataset includes temperature results for air above the oceans, and thus should be most comparable to the SSTs. There is the additional feature that ocean air temps avoid Urban Heat Islands (UHI).  The graph below shows monthly anomalies for ocean temps since January 2015.

Note 2020 was warmed mainly by a spike in February in all regions, and secondarily by an October spike in NH alone. In 2021, SH and the Tropics both pulled the Global anomaly down to a new low in April. Then SH and Tropics upward spikes, along with NH warming brought Global temps to a peak in October.  That warmth was gone as November 2021 ocean temps plummeted everywhere. After an upward bump 01/2022 temps reversed and plunged downward in June.  Now July shows an upward spike everywhere, with NH, SH and Global anomalies all up to 0.3C, and the tropics up from -0.4C to +0.1C.

Land Air Temperatures Tracking Downward in Seesaw Pattern

We sometimes overlook that in climate temperature records, while the oceans are measured directly with SSTs, land temps are measured only indirectly.  The land temperature records at surface stations sample air temps at 2 meters above ground.  UAH gives tlt anomalies for air over land separately from ocean air temps.  The graph updated for July is below.

Here we have fresh evidence of the greater volatility of the Land temperatures, along with extraordinary departures by SH land.  Land temps are dominated by NH with a 2021 spike in January,  then dropping before rising in the summer to peak in October 2021. As with the ocean air temps, all that was erased in November with a sharp cooling everywhere. Land temps dropped sharply for four months, even more than did the Oceans. March and April saw some warming, reversed In May when all land regions cooled pulling down the global anomaly. Then in June Tropics land dropped sharply while SH land rose, NH cooled slightly leaving the Global land anomaly little changed.  Now in July, Tropics and SH land rose sharply, NH slightly, pulling up the Global land anomaly. Still summer 2022 is peaking lower than the previous two.

The Bigger Picture UAH Global Since 1980

The chart shows monthly Global anomalies starting 01/1980 to present.  The average monthly anomaly is -0.06, for this period of more than four decades.  The graph shows the 1998 El Nino after which the mean resumed, and again after the smaller 2010 event. The 2016 El Nino matched 1998 peak and in addition NH after effects lasted longer, followed by the NH warming 2019-20.   A small upward bump in 2021 has been reversed with temps having returned close to the mean as of 2/2022.  March and April brought warmer Global temps, reversed in May and the June anomaly was almost zero. The upward spike is July is almost 0.3C.

TLTs include mixing above the oceans and probably some influence from nearby more volatile land temps.  Clearly NH and Global land temps have been dropping in a seesaw pattern, nearly 1C lower than the 2016 peak.  Since the ocean has 1000 times the heat capacity as the atmosphere, that cooling is a significant driving force.  TLT measures started the recent cooling later than SSTs from HadSST3, but are now showing the same pattern.  It seems obvious that despite the three El Ninos, their warming has not persisted, and without them it would probably have cooled since 1995.  Of course, the future has not yet been written.


Climate Cult Set to Spike Victims of Climate Policy

The quote is updated with one additional word. Unfortunately, we have today no statesman who is so truthful.

Tyler Durden explains at his zerohedge article The Climate Cult is Eager to Take Advantage of Europe’s Energy Crisis.  Excerpts in italics with my bolds and added images.

The climate cult never sleeps, and when they see nations in crisis they are always quick to try to exploit the situation by misrepresenting the root problem.  

A heat wave is currently hitting Europe along with wild fires and the mainstream media is beating the global warming drum hard.  This is nothing new; every time the weather gets hot they cry “climate change!”  Every time the weather is extra cold they once again cry “climate change!”  The evidence?  What about the “record heat” in parts of UK, Spain and Portugal?  This is surely proof that the weather is being ruined by that terrible menace known as man-made carbon?

Of course, what they don’t tell you is that the official record for weather and temperatures used by climate scientists only goes back about 140 years (it started in the 1880s). So, millions upon millions of years of Earth weather, and they only count 140 years of it to determine “record temps?” They tend to ignore ice core and tree ring data from centuries ago that indicate much hotter warming periods in our planet’s history (none of which were caused by man-made carbon emissions). In comparison, today’s temperatures are rather tame.

The Earth’s overall temperatures have only risen by 1° Celsius in the past century; this was actually the peak and currently temps have evened out to an increase of 0.8°C. This is the great climate doomsday we are all supposed to be terrified of. This is the looming threat we are supposed to sacrifice all fossil fuel based energy production for – Less than a single degree of heat.

Global warming theory claims added CO2 systematically raises surface temperatures. On the contrary all of the recent warming is episodic, associated with oceanic El Nino events.

It’s important to put the frantic climate change narrative into concrete perspective because the vast majority of climate science is paid for by governments and special interest organizations like the UN, the World Economic Forum and many other globalist groups with an agenda in mind. On average, these governments and institutions spend around $632 billion per year on climate research funding and climate policy initiatives (which they call “meager”). Their goal is to increase this cash flow to $4 trillion by the year 2030. The incentives to jump on the man-made climate change train are MASSIVE; there is almost no monetary incentive for scientists that want to study other potential causes for climate events.

The notion of the stalwart and incorruptible scientist that seeks objective truth rather than cash and notoriety is long dead. Honest scientists are few and far between these days (especially in the medical and climate science fields), and perhaps it has always been that way. The “experts” cannot be blindly trusted because they are just as susceptible to bias and corruption as anyone else.

Climate change hysteria is a nothing burger, but it is being actively promoted by the media to obscure very real threats that the public faces in the near term.

One of those threats is energy shortages, and climate regulations have put a stranglehold on many nations and their ability to adapt. The EU is now implementing carbon policies that call for a 55% reduction of emissions by 2030. Meaning, no new fossil fuel sources are supposed to be utilized. Only reductions are allowed.

Climate scientists and global elitists claim that climate change is the paramount issue of the century and must be dealt with immediately and by any means necessary. They haven’t presented a single shred of hard evidence to support this assertion, but they dictate the policies of most western governments so they don’t really need to. They just initiate restrictions without public input.

In reality, perhaps the greatest threat since WWII is about to land like a hydrogen bomb
in the laps of the European public.

Panic is beginning to take shape as Russia cuts natural gas supplies to the EU down to 20% of their original capacity and alternative sources simply do not exist on a scale that can take up the slack. A large portion of oil exports have also been shut down, and European governments are NOT informing the citizenry of the true gravity of the situation.

At current energy import rates, at least 40% of Europe
will not be able to heat their homes in the winter.

EU plans to replace Russian energy sources in the near term have also been deemed “wildly optimistic.” In other words, the EU public is screwed, and many of them still don’t realize it yet because the government won’t admit it. A disaster of epic proportions is about to strike and this isn’t even counting the enormous price hikes that are coming for the other 60% of people that will still have gas supplies available.

But the climate cult is not letting this visceral reality get in their way. To them, the crisis is an opportunity. A new narrative is rising among intergovernmental bodies, the media and among climate activists; they say this impending disaster is actually “good for Europe” in the long run, because it forces citizens to accept energy reduction policies and carbon controls which climate scientists and globalists have been demanding for years. Inflation in prices means shrinking demand and cuts in the supply chain mean resources are quashed even if demand remains high. Energy is being suffocated slowly leaving room for a “Green New Deal” of sorts.

So, it’s good for the globalists and their agenda, but not really good for anyone else that has to live through harsh winter months with no heat and limited electricity.

If the current trend continues without a dramatic change in the way Europe throttles fossil fuel energy, then there is the very real potential for mass deaths this winter. This is not hyperbole, this is a mathematical certainty. The continued push for even more climate restrictions at this time is making the situation much worse.

There is no impending threat due to climate change, but there is an impending threat due to energy shortages. Europeans need to ask themselves – Why are their governments setting them up for calamity over a non-existent climate bogeyman? Without increased fossil fuel energy from numerous sources including coal and oil the EU is on the path to a historic tragedy this winter.


Average American Lives in a Warmer Climate by Moving There

From Investors Business Daily Climate Change: Millions Of Americans Have Voted With Their Feet For A Hotter Climate.  Excerpts in italics with my bolds.

Environmentalism: A new (2018) Census report shows that this year, the hottest states in the country had the biggest gains in population. Haven’t these people been listening to decades of warnings from climate change scientists about the myriad hazards of a warmer climate?

Climate scientists have been endlessly shouting that a slightly warmer planet will unleash all sorts of terrible things — more heat-related deaths, more hurricanes and storms, more diseases, more drought and the like.  Despite these admonitions, climate change never registers as a top concern among the public.

Perhaps one reason is that Americans have been steadily migrating to hotter climates for decades. And they’re doing so despite the increased risks they face.

According to Census data, the five states with the biggest gains in population this year are, in order: Texas, Florida, California, Arizona and North Carolina. What else do these states have in common? They are among the states with the highest average temperatures in the country. And the two biggest gainers — Texas and Florida — are the first and fourth hottest states, respectively, in the nation.

Meanwhile, of the nine states that lost population this year, six are in states with below-average temperatures. The biggest loser in the country is New York, which dropped by 48,000 this year. Its climate is 7 degrees colder than the national average.

This year’s census numbers aren’t an aberration, either.

From 2010 to 2017, a net of 2.2 million people moved to the five hottest states in the country.

The above chart shows that over those years, the colder Northeast and Midwest have lost massive numbers of people to the warmer South and West.

Almost a third of the people who moved out of California over the past two years went to states with even higher average temperatures, census migration data show.

There’s no question that these states are more dangerous, in terms of climate-related problems, than the ones millions are fleeing.

Last year, for example, a third of the weather-related deaths occurred in just the five hottest states in the nation, according to the National Weather Service. Its data also show that states gaining in population are more prone to heat, hurricanes and floods.

More than 2.5 million people moved into hurricane-prone states like Florida, the Carolinas, Georgia, and Texas from 2010 to 2017. Florida alone had a net in-migration of more than 1 million. (Only Louisiana lost population over those years.) That’s despite constant alarms about how climate change will make hurricanes more frequent and intense.

States gaining population also are far more likely to suffer heat-related deaths and workplace injuries. And they’re more likely to suffer things like mosquito-borne diseases.

Of course, climate isn’t the only thing motivating this mass migration. The population is also moving to states that have lower tax rates and are more business friendly. It’s these states that are creating jobs and opportunity. (Which explains why frigid North Dakota saw its population climb by 12% over those years.)

[Note: The most recent US regional migration stats from 2020 to 2021 show the same trend albeit with reduced volume of movers.  Both the NE and Midwest showed net losses to the South, totaling nearly 300,000.]

So, bottom line is: Millions of Americans have made it clear that when push comes to shove, they rank opportunity far higher than any of the supposed risks posed by climate change.

Is it any wonder that Americans are so indifferent to the constant demands by environmentalists that we must all sacrifice to prevent the planet from warning by a few degrees?

See Also Climate Hearsay


Sowell: Point of No Return

Dr. Thomas Sowell writes at Creators.com The Point of No Return.  Excerpts in italics with my bolds and added images.  H\T Tyler Durden

This is an election year. But the issues this year are not about Democrats and Republicans. The big issue is whether this nation has degenerated to a point of no return — a point where we risk destroying ourselves, before our enemies can destroy us.

If there is one moment that symbolized our degeneration, it was when an enraged mob gathered in front of the Supreme Court and a leader of the United States Senate shouted threats against Supreme Court Justice Brett Kavanaugh, saying “You won’t know what hit you!”

There have always been irresponsible demagogues. But there was once a time when anyone who shouted threats to a Supreme Court Justice would see the end of his own political career, and could not show his face in decent society again.

You either believe in laws or you believe in mob rule.

It doesn’t matter whether you agree with the law or agree with the mob on some particular issue. If threats of violence against judges — and publishing where a judge’s children go to school — is the way to settle issues, then there is not much point in having elections or laws.

There is also not much point in expecting to have freedom. Threats and violence were the way the Nazis came to power in Germany. Freedom is not free. If you can’t be bothered to vote against storm-trooper tactics — regardless of who engages in them, or over what issue — then you can forfeit your freedom.

Worse yet, you can forfeit the freedom of generations not yet born.

Some people seem to think that the Supreme Court has banned abortions. It has done nothing of the sort.

The Supreme Court has in fact done something very different, something long overdue and potentially historic. It has said that their own court had no business making policy decisions which nothing in the Constitution gave them the authority to make.

Get out a copy of the Constitution — and see if you can find anything in there that says the federal government is authorized to make laws about abortion.

Check out the 10th Amendment, which says that the federal government is limited to the specific powers it was granted, with all other powers going to the states or to the people.

Why do we elect legislators to do what the voters want done, if unelected judges are going to make up laws on their own, instead of applying the laws that elected officials passed?

This is part of a very long struggle that has been going on for more than 100 years. Back in the early 20th century, Progressives like President Woodrow Wilson decided that the Constitution put too many limits on the powers they wanted to use.

Claiming that it was nearly impossible to amend the Constitution, Progressives advocated that judges “interpret” the Constitutional limits out of the way.

This was just the first in a long series of sophistries.

In reality, the Constitution was amended 4 times in 8 years — from 1913 through 1920 — during the heyday of the Progressive era.

When the people wanted the Constitution amended, it was amended. When the elites wanted the Constitution amended, but the people did not, that is called democracy.

Another great sophistry was the federal government’s authority to regulate interstate commerce to call all sorts of other things interstate commerce. In 1995, elites were shocked when the Supreme Court ruled — 5 to 4— that carrying a gun near a school was not interstate commerce.

States had a right to ban carrying a gun near a school, and most of them did. But the federal government had no such authority. Nor did the Constitution give the federal government the right to make laws about abortion, one way or the other.

What both state and federal laws do have the right to stop
is threats against judges and their families.

This is not a partisan issue. The Republican governor of Virginia is providing protection to Supreme Court Justices who live in that state. But the Republican governor of Maryland seems to think that harassing judges and their families is no big deal.

Voters need to find out who is for or against mob rule, whether they are Democrats or Republicans. We are not going to be a free or decent society otherwise.

See Also On Coercive Climatism: Writings of Bruce Pardy

Only Two Models for Human Society

The Jungle Ecosystem

The Marketplace


Two Vax Good, Four Vax Bad


Animal Farm2

My title concerning mRNA vaccines is a play on the Animal Farm slogan.  It’s prompted by research reports looking for answers why highly vaccinated populations like those in Europe and North America experience continuing Omicron infections, while other places like Africa do not.  The surprising finding is summarized at the end of the report.  While two vax shots do not prevent future infections, they do protect against serious illness from the virus, and thus benefit the persons.  But the data suggest that additional booster shots are counter-productive by diminishing the immune system response to further viral exposure.

The paper published in Science is Immune boosting by B.1.1.529 (Omicron) depends on previous SARS-CoV-2 exposure.

A long-term study of healthcare workers in the United Kingdom has allowed their history of infection and vaccination to be traced precisely. Reynolds et al. found some unexpected immune-damping effects caused by infection with a heterologous variant to the latest wave of infection by the Omicron/Pango lineage B.1.1.529. The authors found that Omicron infection boosted immune responses to all other variants, but responses to Omicron itself were muted. Infection with the Alpha variant provided weaker boosting for Omicron-specific responses. Furthermore, Omicron infection after previous Wuhan Hu-1 infection failed to boost neutralizing antibody and T cell responses against Omicron, revealing a profound imprinting effect and explaining why frequent reinfections occur.

Vaccine boosting results in distinct, imprinted patterns of hybrid immunity with different combinations of SARS-CoV-2 infection and vaccination. Immune protection is boosted by B.1.1.529 (Omicron) infection in the triple-vaccinated, previously infection-naïve individuals, but this boosting is lost with prior Wuhan Hu-1 imprinting. This “hybrid immune damping” indicates substantial subversion of immune recognition and differential modulation through immune imprinting and may be the reason why the B.1.1.529 (Omicron) wave has been characterized by breakthrough infection and frequent reinfection with relatively preserved protection against severe disease in triple-vaccinated individuals.

The report by Jennifer Margulis and Joe Wang from Epoch Times is New Science Shows Vaccines Help Omicron Spread: Peer-Reviewed Study.  Excerpts in italics with my bolds.

A team of 19 scientists from the United Kingdom have published new research that helps explain why countries with the highest vaccination rates are experiencing the highest numbers of what they call “breakthrough infections,” as well as reinfection with other variants of COVID-19.

This research article, published on June 14, 2022 in the peer-reviewed journal Science, has been downloaded nearly 277,500 times in less than two months. That is very unusual for a densely worded highly technical scientific study.

We can only speculate the reason so many people have been reading it. But what this study suggests—which many clinicians and research scientists have expressed concerns about—is that COVID-19 mRNA vaccines as well as the booster shots may be making our immune response less effective against the Omicron variant of the virus.

If this is correct, it means that the vaccine itself is leading to widespread infection. Instead of stopping the virus, it appears that the mRNA vaccination programs around the world may have inadvertently made the virus more ubiquitous.

Higher Vaccine Uptake Leads to Higher Infection Rates

Analyzing why the most vaccinated populations are getting the most Omicron infections, this study focused on the most-vaccinated professionals: Medical personnel who had been given the two doses of mRNA vaccines early on, and were then given booster shots twice more. To find out what was happening on a cellular level with these highly vaccinated healthcare workers, the scientists kept close track of the different types of immunoglobin in the participants’ blood.

Immunoglobin (Ig), also known as antibody (Ab), finds viruses, bacteria, and such and leads the immune system to respond appropriately.

Scientists have identified several types of immunoglobulins, each guiding the immune response in a different way for different phases and types of infection.

IgG4, a Tolerance Immune Response

IgG4 is the form of immunoglobin that activates a tolerance response in the immune system, for things you have been exposed to repeatedly and do not need to mount an inflammatory response to. This is good if you are trying to avoid immune sensitivity to a food, for example. But it is not the kind of immune response that the COVID-19 vaccines were designed to create.

Beekeepers, when they are repeatedly stung by bees over their career, mount an IgG4 response to the assault on their immune systems. Basically, their bodies learn that the bee venom is not dangerous and their immune response to bee venom becomes an IgG4 response, so they are able to tolerate the stings very well. While the bee venom itself will not harm the body, the body’s own inflammatory response can be dangerous.

If the body overreacts and develops a generalized response in which the inflammation itself jeopardizes a person’s breathing, the immune response can be lethal.

More Vaccines Lead to More COVID-19 Infections

This study demonstrates exactly how the repeat vaccinations are causing people to be more susceptible to COVID-19. Initial doses of the vaccine brought about classic inflammatory immune responses. Inflammation is a fundamental part of an immune response (to a vaccine or to an infection), and is responsible for most of what you feel when you are sick: fever, aches, lethargy, etc. This inflammation is why you may feel sick if you get a flu shot, and why the COVID-19 vaccine has become famous for making people feel so sick for a few days. Your body is producing an inflammatory response to the COVID-19 proteins.

But what happens in the body after you have had two vaccines and then you are given a third? The scientists found that successive doses of the mRNA vaccines start to habituate or desensitize the subjects to the COVID-19 proteins, migrating their immune response over to being dominated by the IgG4 form, which essentially teaches the body to tolerate the proteins.

Don’t Fence Us In!

A Different Kind of Protection?

The participants’ response to COVID-19 had actually been turned off, making them even more vulnerable to infection and less likely to mount a response to it than those who had never been vaccinated.

When you are exposed to a cold or any other virus repeatedly, spaced out over a lifetime, which is what happens with natural exposure, you don’t develop a tolerance to it, your body fights it off without you knowing it. Your body is using the normal disease-fighting immune response but, since it recognizes the infectious agent, you do not get symptoms of inflammation. This is why when you are naturally exposed to many diseases, you then have lifelong immunity.

In contrast, this new study shows that the repeated mRNA injections and boosters for COVID-19 are producing a tolerance response, as if they were allergy shots. They are habituating the body to the virus, so that you no longer recognize it as something dangerous.

Another study, published in July by a team of more than 20 German scientists, independently confirmed that successive COVID-19 shots and boosters were converting the immune response from the protective class of IgG response to the toleration class.


Elites Escalate War Upon the Middle Class

After 19 months of Biden administration, we can see clearly the shape of tactics for making war on the middle class.  The World Bank has come to see personal transportation as key for individuals to overcome poverty by accessing opportunities for work, education and services outside their birthplaces.  So choking off supplies of gasoline (in the name of climate change) keeps the serfs in their place.  The rising underclass is most vulnerable in their transition to financial stability, so policies wreaking inflation take away the middle class dream.  Of course guns must be confiscated lest there be any effective resistance to governmental coercion.  Those who are outspoken against the elite narrative, and who protest injustice against ordinary citizens, must themselves be imprisoned without any of their entitled legal protections.  And the nation is flooded with illegal aliens to drive down the working class income, and to create a permanent underclass dependent and subservient to government largess. Leftist prosecutors condone widespread theft and drug dealing, undermining the ability to gain property security and the motivation to even work productively.

David McGrogan writes at The Brownstone Society vs State: Canada Reveals the Core Conflict of Our Age.  Excerpts in italics with my bolds and added images.

Justin Trudeau’s confrontation with the Canadian truckers may be the single most significant event of the Covid pandemic – not because of its eventual outcome, whatever that may be, but because of what it symbolises. It captures, in perfect microcosm, the tensions between the competing imperatives of the age:

♦ freedom versus security;
♦ the rule of law versus flexible ‘responsive’ governance;
♦ the priorities of the workers versus those of the Zooming bourgeoisie;
♦ the need for real-world human interaction and belonging versus the promises of splendid online isolation;
♦ the experiences of the common man, who knows where it hurts, versus those of the professional expert class, who know nothing that cannot be expressed as a formula.

More than all of that, though, it gives us a lens through which to view a much deeper, much older conflict of much larger scope – one which underlies not just the struggles of the Covid age, but of modernity itself. On the one hand, the state, which seeks to make all of society transparent to its power. On the other, alternative sources of authority – the family, the church, the community, the firm, the farm, and the human individual herself.

For centuries, the state has waged a quiet war against those competitors,
and bent them to its will.

It has done this not through conspiracy or deliberate strategy but merely through the single-minded pursuit, across generation after generation of political leaders, of one goal: legitimacy. Governments and other state organs derive their legitimacy, and therefore their positions of rulership, from convincing the population that they are necessary.

They do this by suggesting that without their intervention, things will go badly;
left to their own devices, ordinary people will suffer.

The family, the church, the community, the firm, the farm, the human individual – these are inadequate to the task of securing human well-being. That task, only the state is equipped to achieve, for only the state can keep the population educated, healthy, safe, prosperous and satisfied. Since this is the case, only the state is fit to deploy power – and only those who govern the state are fit to rule.

The logic of this argument is writ large, of course, in the Covid response across the developed world. What will keep us ‘safe?’ Certainly not traditional sources of succour, such as the church or the family. Certainly not individual people, who cannot be trusted to behave responsibly or assess risks for themselves.

No – it is only the state, first with its lockdowns, then with its social distancing, its mask mandates, its vaccine programs, and lately its vaccine mandates and ‘passports.’ It is only the state’s power that saves and secures. And since only the state can save, it is the only legitimate source of authority – along, of course, with its leaders.

The state portraying itself as saviour in this fashion is patently false and absurd given what has taken place over the past two years.

But as false and absurd as it is, it remains the subtext behind all of Covid policy. Justin Trudeau must derive his legitimacy from somewhere to maintain power. And he senses – political animal that he is – that he can derive it from displaying the Canadian state (with himself at the helm, of course) as the only thing standing between the Canadian public and suffering and death.

It is the state, remember – in this case with its vaccine mandates – that saves and secures. Without it, the reasoning goes, the population would suffer and die as Covid ran riot. The political logic is inescapable. For a man like Trudeau, without principle except that he alone is fit to govern, there is only one path to follow. Insist that it is the state that saves and secures, and that anything that stands in its way – truckers beware – must therefore be crushed beneath its heel.

The truckers, for their part, represent everything that the state despises.

They have a social and political power that is independent from it, and hence form one of the alternative sources of power which it hates and fears. This power derives not from some institution which the truckers dominate, but simply from their status amongst what I will refer to as the yeomanry classes – almost the last bastion of self-sufficiency and independence in a modern society such as Canada.

In a developed economy, most of the professional classes – doctors, academics, teachers, civil servants and the like – derive their incomes and status entirely or partially, directly or indirectly, from the existence of the state. If they are not civil servants, their status is built on regulatory apparatus which only the state can build and enforce. This is also, of course, true of the underclass, who are often almost totally reliant on the state for the meeting of their needs. The members of these classes pose no threat to the state’s legitimacy, because, simply put, they need it. It, as a consequence, is perfectly happy to tolerate their existence – and, indeed, it wishes all of society were that way inclined.

A population entirely reliant on the state is one which will never question the necessity of the growth of its power and hence its capacity to buttress its own legitimacy.

But in the middle are those people, the modern yeomanry, who derive their incomes from private sources, as sole traders, owners of small businesses, or employees of SMEs. Independent-minded, seeing self-sufficiency as a virtue, and relying on themselves and their relationships with others rather than the state, these modern yeomen represent a natural barrier to its authority. Simply put, they do not need it. They earn their money through the use of a particular skill which others value and hence pay for on the open market.

Whether or not the state exists is immaterial to their success – and, indeed, it very frequently stands in their way. These are the type of people who, seeing a problem, tend to want to find a solution for themselves. And they are precisely the kind of people who want to make up their own minds about whether to take a vaccine, and to assess health-related risks in general.

The modern state has waged incessant and covert war against the yeomanry in particular.

At every step, it seeks to regulate their business affairs, restrict their liberty, and confiscate their prosperity. There is always a purportedly ‘good’ reason for this. But it contributes to an incessant whittling away of their independence and strength. It is no accident that they are described in British parlance as the ‘squeezed middle’ – squashed as they are between the welfare-reliant underclass on the one hand, and the white-collar professionals who draw their wealth, directly or indirectly, from the state on the other.

It is also no accident that these modern yeomen have gradually seen their political representation diminish over the course of the last 100 years, in whichever developed society one cares to name; the politicians they would elect would be mostly interested in getting the state out of the way, and modern politicians’ incentives all incline in the opposite direction. Their interest is in the inexorable growth of state power, because that is from where their legitimacy derives.

Justin Trudeau’s contempt for the truckers is therefore genuine and profound.

He sees in them not an obstacle to Covid policy or a potential threat to public health. Not even he could possibly be so stupid as to think it matters whether or not these people take their vaccines. No: he identifies in them a barrier to forces in which his political future is entwined – an ever-increasing scope and scale for governmental authority, and the opportunities to buttress his own legitimacy that would follow from it.

And his contempt for them is outweighed, of course, by his fear. Because he surely recognises that his authority is wafer-thin. Legitimacy cuts both ways. If he fails to suppress the truckers’ revolt, the entire edifice on which his authority rests – as the helmsman of the Canadian state and its purported capacity to protect the population from harm – will come tumbling down.

This conflict is therefore not about Covid – it’s existential. Does it matter if the truckers win or lose? No. What matters is what their efforts have revealed to us about the relationship between the state and society in 2022.

See also:

2021 Class Warfare: The Elite vs. The Middle

Modern Politics Seen as Classes Power Game

Washington Capital Overthrowing the United States

More than 25,000 troops from across the country were dispatched to the US capital on January 13, 2021.

Electric Car Obsession


Times Square Billboard

World Economic Forum Urges Public To Eliminate Ownership Of Private Vehicles

The World Economic Forum is advocating for the abolition of “wasteful” private vehicle ownership for the planet’s greater good as the organization attempts to advance its “Great Reset” agenda and transform the world so that the average person will “own nothing.”

“We need a clean energy revolution, and we need it now,” states a WEF’s July 18 article titled, “3 circular economy approaches to reduce demand for critical metals.”

“But this transition from fossil fuels to renewables will need large supplies of critical metals such as cobalt, lithium, nickel, to name a few. Shortages of these critical minerals could raise the costs of clean energy technologies,” the forum continues.

The unelected globalist group recommends the public “go from owning to using” by implementing “vehicle sharing initiatives” to decrease mass reliance on critical metals.

“The average car or van in England is driven just 4% of the time. While most already have a personal phone, 39% of workers globally have employer-provided laptops and mobile phones. This is not at all resource efficient,” the WEF states. “More sharing can reduce ownership of idle equipment and thus material usage.”

The WEF recommends the public abandon use of the vehicles they own and instead opt to share a ride by “car sharing and links to an article published by Tree Hugger to that details what “car sharing” entails.

Banning private ownership in its entirety is essential, according to the WEF.

“A design process that focuses on fulfilling the underlying need instead of designing for product purchasing is fundamental to this transition,” the WEF continues. “This is the mindset needed to redesign cities to reduce private vehicles and other usages.”

Earlier this month, the WEF also published a position paper claiming gas prices must increase to save democracy.

Policies must be implemented to increase the prices of alternatives to green energy, the WEF argues in the July 11 article.

See Also The Illusion of Eco Cars

If That Tesla Battery Could Talk


Surplus Arctic Ice July 2022

The animation shows Arctic ice extents on day 212 (end of July) starting with 2007, and showing the lack of decline through yesterday.  Years vary as to which regions retain more or less ice.  For example, some years the Russian shelf seas (left side) are mostly open water on day 212.  Kara and Barents seas (top side) fluctuate.  The Northwest passage (bottom), melts early some years in Beaufort Sea, and CAA, but this year not so much. The graph below compares the July monthly ice extents 2007 to 2022 and compared to the SII 16 year average.

Clearly July ice appears as a plateau, and most years MASIE shows greater extents than SII, with differences of only a few 100k km2.  The previous three years were in deficit to average, but July 2022 has returned to surplus years like 2018.  More on MASIE dataset at the end.

The graph shows the melting pattern during July 2022 remained above average all month, and greatly exceeded 2007 and 2020, especially in the last 2 weeks.  July 31, 2022 was 275k km2 in surplus, and exceeded 2020 by 1.2 Wadhams (M km2).

The table below shows ice extents by regions comparing 2022 with 16-year average (2007 to 2022 inclusive) and 2020.

Region 2022212 Day 212 Average 2022-Ave. 2020212 2022-2020
 (0) Northern_Hemisphere 7124997 6849722 275275 5880746 1244251
 (1) Beaufort_Sea 884463 789512 94950 875454 9008
 (2) Chukchi_Sea 575245 525326 49919 533748 41498
 (3) East_Siberian_Sea 787982 740081 47901 329453 458529
 (4) Laptev_Sea 297339 365902 -68563 61979 235360
 (5) Kara_Sea 104430 161090 -56660 95539 8891
 (6) Barents_Sea 0 31433 -31433 23940 -23940
 (7) Greenland_Sea 292278 291488 790 282403 9875
 (8) Baffin_Bay_Gulf_of_St._Lawrence 281955 130715 151240 35368 246587
 (9) Canadian_Archipelago 633235 540268 92967 515499 117735
 (10) Hudson_Bay 169704 135947 33757 92861 76844
 (11) Central_Arctic 3096938 3136284 -39347 3033706 63232

2022 is 275k km2 above average (4%). The main deficits are in Laptev and Kara seas, more than offset by 151k km2 surplus in Baffin Bay, along with additional ice in CAA, and an icy BCE (Beaufort, Chukchi, East Siberian seas).

Footnote on MASIE Data Sources:

MASIE reports are based on data primarily from NIC’s Interactive Multisensor Snow and Ice Mapping System (IMS). From the documentation, the multiple sources feeding IMS are:

Platform(s) AQUA, DMSP, DMSP 5D-3/F17, GOES-10, GOES-11, GOES-13, GOES-9, METEOSAT, MSG, MTSAT-1R, MTSAT-2, NOAA-14, NOAA-15, NOAA-16, NOAA-17, NOAA-18, NOAA-N, RADARSAT-2, SUOMI-NPP, TERRA

Sensor(s): AMSU-A, ATMS, AVHRR, GOES I-M IMAGER, MODIS, MTSAT 1R Imager, MTSAT 2 Imager, MVIRI, SAR, SEVIRI, SSM/I, SSMIS, VIIRS

Summary: IMS Daily Northern Hemisphere Snow and Ice Analysis

The National Oceanic and Atmospheric Administration / National Environmental Satellite, Data, and Information Service (NOAA/NESDIS) has an extensive history of monitoring snow and ice coverage.Accurate monitoring of global snow/ice cover is a key component in the study of climate and global change as well as daily weather forecasting.

The Polar and Geostationary Operational Environmental Satellite programs (POES/GOES) operated by NESDIS provide invaluable visible and infrared spectral data in support of these efforts. Clear-sky imagery from both the POES and the GOES sensors show snow/ice boundaries very well; however, the visible and infrared techniques may suffer from persistent cloud cover near the snowline, making observations difficult (Ramsay, 1995). The microwave products (DMSP and AMSR-E) are unobstructed by clouds and thus can be used as another observational platform in most regions. Synthetic Aperture Radar (SAR) imagery also provides all-weather, near daily capacities to discriminate sea and lake ice. With several other derived snow/ice products of varying accuracy, such as those from NCEP and the NWS NOHRSC, it is highly desirable for analysts to be able to interactively compare and contrast the products so that a more accurate composite map can be produced.

The Satellite Analysis Branch (SAB) of NESDIS first began generating Northern Hemisphere Weekly Snow and Ice Cover analysis charts derived from the visible satellite imagery in November, 1966. The spatial and temporal resolutions of the analysis (190 km and 7 days, respectively) remained unchanged for the product’s 33-year lifespan.

As a result of increasing customer needs and expectations, it was decided that an efficient, interactive workstation application should be constructed which would enable SAB to produce snow/ice analyses at a higher resolution and on a daily basis (~25 km / 1024 x 1024 grid and once per day) using a consolidated array of new as well as existing satellite and surface imagery products. The Daily Northern Hemisphere Snow and Ice Cover chart has been produced since February, 1997 by SAB meteorologists on the IMS.

Another large resolution improvement began in early 2004, when improved technology allowed the SAB to begin creation of a daily ~4 km (6144×6144) grid. At this time, both the ~4 km and ~24 km products are available from NSIDC with a slight delay. Near real-time gridded data is available in ASCII format by request.

In March 2008, the product was migrated from SAB to the National Ice Center (NIC) of NESDIS. The production system and methodology was preserved during the migration. Improved access to DMSP, SAR, and modeled data sources is expected as a short-term from the migration, with longer term plans of twice daily production, GRIB2 output format, a Southern Hemisphere analysis, and an expanded suite of integrated snow and ice variable on horizon. Source:  Interactive Multisensor Snow and Ice Mapping System (IMS)