Six Reasons to Rescind Social Cost of Carbon
A consise summary is provided by Paul Driessen and Roger Bezdek
in this article Anti-fossil fuel SCC relies on garbage models, ignores carbon benefits and hurts the poor. Excerpts below.

The UN Development Program also calls energy “central to poverty reduction.” And International Energy Agency Executive Director Dr. Fatih Birol notes that “coal is raising living standards and lifting hundreds of millions of people out of poverty.” In fact, all fossil fuels are doing so.

Indeed, fossil fuels created the modern world and the housing, transportation, other technologies and living standards so many of us take for granted. They are essential for electricity and life, and over the past 250 years they more than doubled average life expectancy in countries that took advantage of them.

But the Obama Administration and radical environmentalists despise fossil fuels and used every tactic they could devise to eliminate them. One of their most important schemes was the “social cost of carbon.”

Six Things Wrong with Social Cost of Carbon

1. Each ton of U.S. emissions averted would initially have prevented a hypothetical $25/ton in global societal costs allegedly resulting from dangerous manmade climate change: less coastal flooding and tropical disease, fewer droughts and extreme weather events, for example. But within three years regulators arbitrarily increased the SCC to around $40/ton.

That made it easier to justify the Clean Power Plan, Paris climate agreement, and countless Obama Era actions on electricity generation, fracking, methane, pipelines, vehicle mileage and appliance efficiency standards, livestock operations, carbon taxes, and wind, solar and biofuel mandates and subsidies.

2. The supposed bedrock for the concept is the now rapidly shifting sands of climate chaos theory. New questions are arising almost daily about data quality and manipulation, the degree to which carbon dioxide affects global temperatures, the complex interplay of solar, cosmic ray, oceanic and other natural forces, and the inability of computer models to predict temperatures, sea level rise or hurricanes.

3. The SCC scheme blames American emissions for supposed costs worldwide (even though U.S. CO2 emissions are actually declining). It incorporates almost every conceivable cost of oil, gas and coal use on crops, forests, coastal cities, property damage, “forced migration,” and human health, nutrition and disease. However, it utterly fails to mention, much less analyze, tremendous and obvious carbon benefits.

4. CC schemes likewise impute only costs to carbon dioxide emissions. However, as thousands of scientific studies verify, rising levels of this miracle molecule are “greening” the Earth – reducing deserts and improving forests, grasslands, drought resistance, crop yields and human nutrition. No matter which government report or discount rate is used, asserted social costs of more CO2 in Earth’s atmosphere are infinitesimal compared to its estimated benefits.

5.  Government officials claim they can accurately forecast damages to the world’s climate, economies, civilizations, populations and ecosystems from U.S. carbon dioxide emissions over the next three centuries. They say we must base today’s energy policies, laws, and regulations on those forecasts. The notion is delusional and dangerous.

6. Finally, the most fundamental issue isn’t even the social cost of carbon. It is the costs inflicted on society by anti-carbon regulations. Those rules replace fossil fuel revenues with renewable energy subsidies; reliable, affordable electricity with unreliable power that costs two to three times as much; and mines, drill holes, cropland and wildlife habitats with tens of millions of acres of wind, solar and biofuel “farms.”

Summary

Anti-carbon rules are designed to drive energy de-carbonization and modern nation de-industrialization. Perhaps worst, their impacts fall hardest on poor, minority and blue-collar families. . . Worldwide, billions of people still do not have electricity – and the SCC would keep them deprived of its benefits.

It’s time to rescind and defund the SCC – and replace it with honest, objective cost-benefit analyses.

shredding-864x540-1Roger Bezdek is an internationally recognized energy analyst and president of Management Information Services, Inc. Paul Driessen is senior policy analyst for the Committee For A Constructive Tomorrow and author of books and articles on energy, climate change and human rights.

Additional posts:

Social Cost of Carbon: Origin and Prospects

The Social Benefits of Carbon

Ontario Coal Phase-out: All Pain, No Gain


Thanks to Dr. Ross McKitrick for telling the story: It’s official—Ontario’s coal phase-out was all for nothing which appeared in the Financial Post, January 17, 2017.  Excerpts below.

The federal Liberal government plans to impose a national coal phase-out, based on the same faulty arguments used in Ontario, namely that such a move will yield significant environmental benefits and reduce health-care costs. One problem—those arguments never made sense, and now with the Ontario phase-out complete, we can verify not only that they were invalid but that the Ontario government knew it.

First, ample data at the time showed that coal use had little effect on Ontario air quality. Environment Canada’s emissions inventories showed that the Ontario power generation sector was responsible for only a tiny fraction (about one per cent) of provincial particulate emissions, a common measure of air pollution.

Taken together these reports provided a credible basis for predicting that a coal phase-out would only have a small effect on our air quality. They also showed, based on the results of retrofits then underway at the power plants, that the same air quality improvements could be obtained at a fraction of the cost by installing scrubbers on the smokestacks, rather than shutting the coal-fired plants down.

Second, the government’s claims about the health effects of phasing out coal were highly implausible. It stated (and continues to assert) that coal plant emissions cost the province more than $3 billion annually in health-care costs. But this was at a time when the total provincial health-care budget was only about $35 billion annually. In other words, they claimed that nearly one-tenth of all health-care spending was due to illnesses and mortality arising from power plants that, again, were responsible for only about one per cent of annual particulate emissions.

Dr. Aliakbari and I analysed data for the cities of Hamilton, Toronto and Ottawa over the 2002-2014 interval. Our statistical model allowed us to isolate the effects of declining Ontario coal use compared to changing emissions from other Canadian and U.S. sources and effects due to weather. In line with our expectations and the prior evidence, we found that phasing out coal was responsible for only very small changes in Ontario air pollution levels.

We did not look at greenhouse gases because they are not local air pollutants, only matter on a global level, and emissions could be offset by purchasing credits anywhere in the world. The climate issue was, and remains, a red herring in the discussion about the costs and benefits of eliminating coal.

Summary

Ontario is suffering a crisis of high and rising electricity costs that’s causing real, long-lasting damage to households and businesses. The province insists the pain is worth it because of the environmental improvements. The numbers show otherwise. Phasing out coal had almost no effect on Ontario’s air pollution levels—and the government at Queen’s Park knew this was likely to be the case. It has all been for nothing.


Ross McKitrick
Professor of Economics, University of Guelph

Two additional points

Firstly, in both the US and Canada, the real motivation is virtue-signalling, posing as fighters of climate change.  The US EPA is also infamous for bogus estimates of public health and air quality benefits to justify costly and onerous energy regulations.

When Ontario government rejected the anti-pollution scrubbers mentioned in the article above, Energy Minister Dwight Duncan said: “We’re not going to spend $1.6 billion on technology that doesn’t help climate change. That’s just dumb.”

Secondly, the result was worse than nothing. Ontario’s electricity rates are the fastest rising and among the highest in North America. Ratepayers are being mugged by the once friendly Reddy Kilowatt.

Ontario’s Hall of Pain

Ontario Climate Policy Refugees

Ontario Jammed by Rent-seekers and Ratepayers

Electrical Madness in Green Ontario


SBC: Social Benefits of Carbon


Recently I posted on the Social Cost of Carbon: Origin and Prospects, which has become a focus for the Trump transition team. An article from Bloomberg provided a good historical context and overview of that policy instrument. The discussion noted major issues with how the damages are estimated and focused on how the calculation depends greatly upon the arbitrary choice of discount rate.

Several commenters raised a quite separate problem, namely that SCC is biased by addressing only estimated damages from CO2 and not the social benefits. That is not surprising since the entire purpose of the SCC is to get a large enough dollar figure to justify imposing expensive regulations, supposedly to avoid the damages by reductions in CO2 emissions. The framers had no interest or incentive to reduce damage estimates by considering benefits.

However a normal cost/benefit analysis would only project damages net of the expected benefits, which is clearly not the case here. Let’s consider three categories of Social Benefits of Carbon which properly must be included, rather than ignored.

Social Benefits from the Energy

Climate advocates assume that burning fossil fuels provide immediate benefits, such as electrical power or horsepower, which are paid for in the purchase of the fuels and realized by the consumers. Thus the social costs pertain only to future damages not covered by the fuel market prices. This view is achieved by wearing blinders to many obvious future social benefits attributable to the reliable and affordable energy from fossil fuels.

Alex Epstein (here) is among those who demonstrate from public information sources comparisons between societies who use carbon fuels extensively and those who do not. The contrast is remarkable: Societies with fossil fuels have citizens who are healthier, live longer, have higher standards of living, and enjoy cleaner air and drinking water, to boot. Not only do healthier, more mobile people create social wealth and prosperity, carbon-based energy is heavily taxed by every society that uses it.  Those added government revenues go (at least some of it) into the social welfare of the citizenry. By almost any measure, carbon-based energy makes the difference between developed and underdeveloped populations.

Social Benefits from CO2 Fertilization

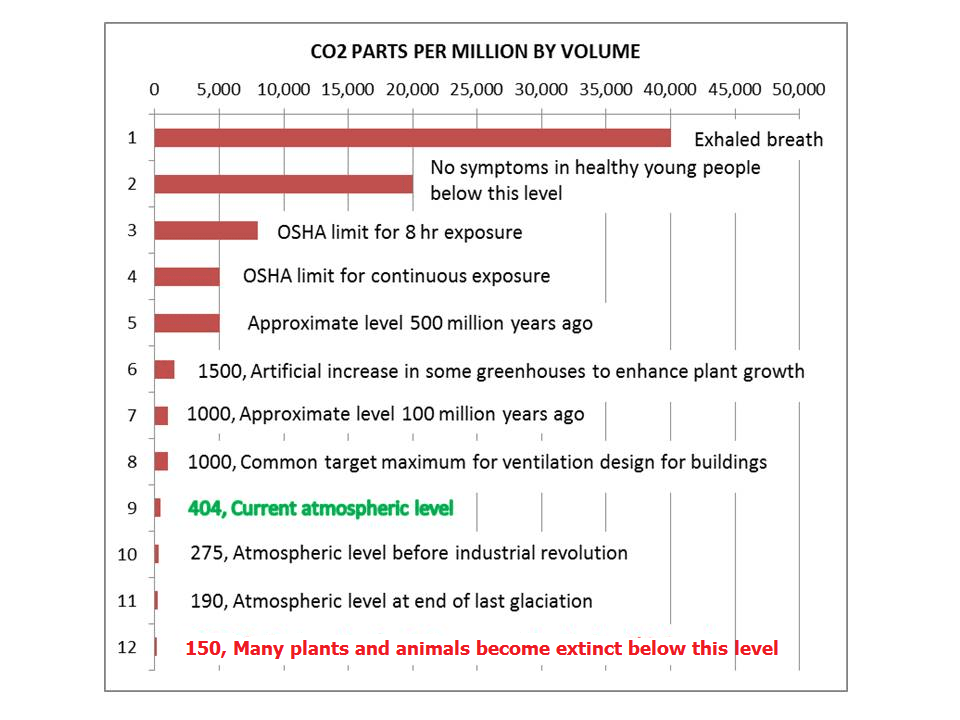
SCC excludes any consideration of the positive effects upon the biosphere from higher concentrations of CO2 in the atmosphere. It has been proven by numerous studies that plants thrive when more than 400ppm of CO2 are in the air, and greenhouse operators routinely add CO2 to double or triple the amount inside their facilities.

Yet climatists are at pains to discredit the benefits of more CO2.

A few years ago a scientist analyzed satellite imagery and discovered that the planet is greening (adding plant coverage) at a higher rate most likely due to more CO2 in the air. Climate activists are putting pressure upon these researchers to recant their findings.

A recent post Researchers Against CO2 revealed how activist scientists are trying to overturn the extensive biological evidence that plants love CO2. Field experiments are conducted claiming that plants don’t always grow bigger and faster with more CO2 when there are other limiting factors such as moisture, sunlight or soil nutrients. Their logic fails since more CO2 doesn’t cause the lack of other growth factors, and reducing CO2 will not improve those circumstances.

Another attack on CO2 benefits is the claim of ocean acidification, and I would not be surprised if SCC includes damage estimates from this source. Facts on the ground (or in this case, the oceans) do not support the claims, as reported in this post on Basics of Ocean Acidification.

Even crabs love CO2.

Social Benefits from Global Warming

Here we face the full force of billions of dollars of research studies on the damaging impacts from a few degrees of temperature increase. Over the years, everything has been shown to suffer from global warming, from A to Z. From Acne to Zika virus, and every letter in between: Bees, Civil wars, Diseases, Extinctions, Fish, etc.

Here’s the thing: Social Cost of Carbon is actually an attempt to estimate the benefits of preventing all those A to Z damages. But where are the estimates of benefits by preventing damages from global cooling?

A few researchers such as Richard Tol have looked objectively at warming scenarios, and identified clear social benefits. One study (here) concluded that an additional degree Celsius of warming by 2040 would likely result in 800,000 fewer deaths each year. Is that not a benefit to be reckoned?  Reasonable people conclude that the last 1°C of warming was a boon to civilization, and the next 1°C is likely to also be a blessing.

There are problems with this category. How do you put dollar values on saving human lives, or projected reductions in crops due to colder weather? These are the same problems bedeviling the SCC calculations.

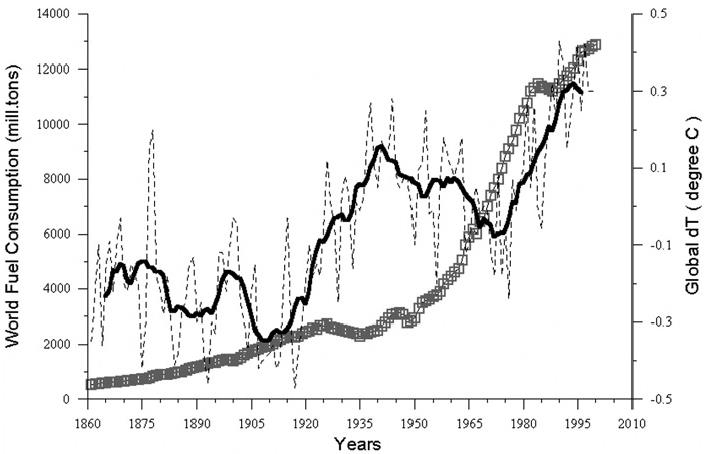
Further, many are wary of accepting the premise that carbon-based fuels do in fact cause temperatures to rise. Certainly the poor correlation between fuel consumption and global mean temperatures (GMT) does not convince (more here). Still, the argument can be made that even if you believe in man made global warming, policy analysis must also consider the benefits from a warmer world.

Summary

Calculating future costs and benefits from using carbon-based fuels is much like going down Alice’s rabbit hole.  Things get distorted, turned upside down and sideways.  Or to change the metaphor:  Beware: this swamp has alligators.

Ontario Climate Policy Refugees

It is not climate change forcing migrations, but rather misguided climate policies like those in Ontario. Employers pushed to the wall by energy cost increases have to plan for growth in other jurisdictions where energy is reliable and affordable. In effect, Ontario businessmen who are succeeding against world competitors from the US, China and India, will be creating jobs elsewhere, a migration of employees directly resulting from CO2 hysteria.

Ontario manufacturers fighting Queen’s Park’s energy policy Toronto Sun

Byron Nelson has spent over three decades growing his manufacturing company in Ontario, only now to regret his choice.

As he tours a group of reporters around his Leland Industries Scarborough plant where they build nuts and bolts for export to the United States and Europe, he explains he’s losing a battle with the province. His hydro bills have soared over the past year and with Ontario’s new cap-and-trade system coming into effect next month, electricity and natural gas costs will likely spike by another 20%.

That’s why Nelson — and other manufacturers in the province — are choosing to expand their businesses in the U.S. instead of at home.

“By 1995 to 2000, China had moved in and we fought China on the world trade and won,” Nelson said Tuesday during a press conference of the newly formed Coalition of Concerned Manufacturers in Ontario.

“Now our bigger problem is we’ve got to fight the province on controlling some of our hydro costs, which have totally skyrocketed. Our electricity bill has already increased 42% over the past few years. I’ve done the math and I’m looking at a cost increase that is going to take it to over $800,000 a year and with cap-and-trade, it’ll be near $1 million.”

Leland Industries plant, Scarborough Ontario

Leland Industries plant, Scarborough Ontario

Ontario’s new cap-and-trade system will cause electricity and natural gas costs to rise even higher. Toronto Star

Jocelyn Williams Bamford — vice president of Automatic Coating Limited and spokeswoman for the Coalition of Concerned Manufacturers in Ontario — said Leland is one of many smaller and medium-sized Ontario-based manufacturers that are looking to grow and seriously considering investing outside of Ontario.

“Ontario’s energy costs are rising so quickly many manufacturers are reassessing whether it makes sense to expand production in this province,” she said Tuesday in a statement.
Bamford said manufacturers have become more competitive and have been able to reduce emissions at the same time because they have invested in new technologies.

“Higher energy costs leave us less money for investment. And, if manufacturers can’t invest in Ontario, it’s not good for the economy or for jobs in this province. Ultimately, it’s not good for the environment either,” she said.

CEO of Leland Industries Byron Nelson says the company will not invest in Ontario any more because ‘the costs are just out of sight.’ Nelson said Ontario has already lost a lot of manufacturers and will lose more because those in government “just do not understand.”

Summary

Virtue signaling is not free. Ontario politicians want to look good to UN leaders, but the result is forcing employers to migrate jobs elsewhere. Until now politicians have naively bought into alarms from the Union of Concerned Scientists. Maybe they should pay attention instead to the Coalition of Concerned Manufacturers.

Norway’s Climate Angst.

It is not only US climatists alarmed about faithless political appointees to energy and environmental positions. Now some Norwegians are stewing. International Business Times article (here) A climate change denier has just been put in charge of melting Arctic island of Svalbard  Per-Willy Amundsen has stated previously that he believes climate change to be a socialist ploy.

Climate change sceptic Per-Willy Amundsen of the populist right-wing Progress Party has been appointed Minister of Justice and Public Security in Norway in a cabinet reshuffle.

Amundsen does not believe that human activity is driving climate change, and says that climate change is used to disguise socialist policies, he previously told the Norwegian newspaper Stavanger Aftenblad.

Norway’s Polar Affairs Department will fall under Amundsen’s brief, including administrative responsibility for Svalbard. The island is surrounded by the Arctic Ocean, the Greenland Sea and the Barents Sea, and lies between mainland Norway and the North Pole. It has been facing increasing challenges due to climate change in recent years.

This is another crisis brewing for the climate movement because Norwegian officials are resolute believers in climatism, despite (or maybe because of) the oil wealth pouring into their sovereign fund. Norwegians seem conflicted about their oil wealth, going out of their way to proclaim their faith in climate change doctrine.

For example, in the Exxon shareholder activist initiative last May, a large portion of supporting votes came from shares held by the Norwegian wealth fund. Another bunch of votes came from the Rockefeller family acting against management of the company founded by their patriarch. (Details here).

Note the posturing by Norway PM Solberg:
Despite Amundsen’s stated views in the past, Norway’s prime minister Erna Solberg denied that she had appointed climate-change sceptics to her cabinet. “Everybody in this government believe climate change is man-made,” EUobserver reported Solberg to have said.

The appointment raises questions about how Amundsen will address the problems of Svalbard, and other areas of Norway being affected by climate change.

“Many of the challenges faced on Svalbard are related to climate change one way or the other,” Ivar Berthling, professor of geography at the Norwegian University of Science and Technology, told IBTimes UK.

This is interesting also because of the recent deluge of media reports about shrinking reindeer on Svalbard (here). Fortunately for Norwegians, and for all of us, Norway has scientists who are not confused about climate change and have made their evidence and analyses widely available. Chief among them is Dr. Ole Humlum founder of the excellent climate information website Climate4you.

Arctic gateway seas (20W-40E. 70-80N) heat content 0-700 m depth

Map showing the Arctic Gateway Seas within 20W-40E and 70-80N, for which the heat content within the uppermost 700 m is shown in the three diagrams, for East Greenland Sea, West Svalbard Sea and Barents Sea.

Svalbard archipelago, which includes Spitzbergen, is located at the gateway for Gulfstream Atlantic water entering the Arctic. Thus changes there are indicative of climate across the entire Arctic. As with other oceanic islands, like Australia, variations in land surface temperatures are synchronized with sea surface temperatures.

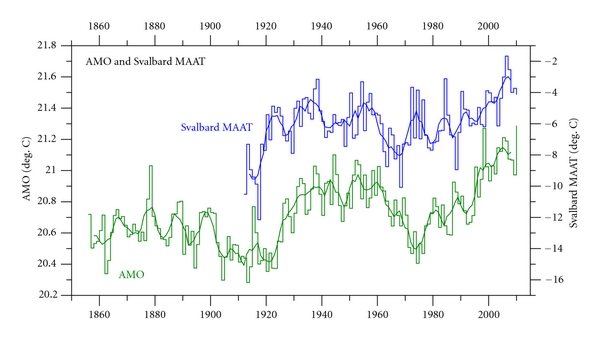
Figure 4: Svalbard MAAT 1912–2010 (blue) and Atlantic Multidecadal Oscillation (AMO, green) annual index values 1856–2010. The thick lines are the simple running 5 year average. Note that the temperature scales are different

Figure 4: Svalbard MAAT 1912–2010 (blue) and Atlantic Multidecadal Oscillation (AMO, green) annual index values 1856–2010. The thick lines are the simple running 5 year average. Note that the temperature scales are different

From Spectral Analysis of the Svalbard Temperature Record 1912–2010
Ole Humlum, Jan-Erik Solheim, and Kjell Stordahl (here)

During summer the daily meteorological conditions are highly influenced by the incoming solar radiation, which at 78°13′N are continuously above the horizon from 19 April to 23 August. Nevertheless, because of the nearby ocean, the air temperature usually stays relatively low, with July having an average temperature of 6.5°C (1981–2010). Summer air temperatures are also influenced by local wind conditions, partly reflecting land-sea breeze effects because of relatively small regional air pressure differences during the summer. All these factors are relatively stable from summer to summer.

During winter the meteorological conditions are very different from the summer. The sun stays below the horizon from 28 October to 14 February, and there is very little incoming solar radiation from December to February. The ground is snow covered, and much of the surrounding ocean and fjords are covered by sea ice. So whenever calm conditions prevail, inversions tend to develop and temperatures will be low at Svalbard Airport. However, conditions are frequently windy during the winter, destroying inversions, and from time to time warm air masses are advected towards Svalbard from the North Atlantic. Whenever this happens, the air temperature will rise significantly, as much as 10–15°C within few hours. In winters with high frequency of such events, the average temperature will be high and vice versa in winters where advection of warm air masses occurs less often. Also local foehn effects may be important during the winter. Together, this explains the high degree of winter temperature variability compared to the summer variability.

Advection of warm air masses from lower latitudes towards Svalbard occurs at all seasons, but is most frequent during the winter. This explains why the Svalbard air temperature is well coupled to North Atlantic temperature conditions both in summer and winter, and why several oscillations can be recognised in the spectra of both summer and winter temperature records (Figure 5). Had this not be so, one would expect at least potential solar signals to be absent from the winter data.

Figure 1: The Svalbard temperature record 1912–2010 [4], showing the mean annual air temperature (MAAT), the average summer temperature (JJA), and the average winter temperature (DJF). Thin lines show annual values, and thick lines show the simple 5 yr average. The linear MAAT increase 1912–2010 is 0.23°C per decade.

Figure 1: The Svalbard temperature record 1912–2010 [4], showing the mean annual air temperature (MAAT), the average summer temperature (JJA), and the average winter temperature (DJF). Thin lines show annual values, and thick lines show the simple 5 yr average. The linear MAAT increase 1912–2010 is 0.23°C per decade.

Strength and persistence of several cyclic variations identified in the Svalbard temperature record suggests that a natural cycle-based forecasting of future climate may be feasible for the Svalbard record, at least for a limited time ranges. Our empirical experience suggests a forecasting time range of 10–25% of the total record length.

For Svalbard our experimental forecast suggests that the observed late 20th century warming is not going to continue, but are likely to be followed by variable, but generally not higher temperatures for at least the coming 20–25 years. The falsification time scale for this forecast is about 7 years.

Summary

Once again, climate confusion and angst is born by activists conflating human and natural influences on weather patterns.

The Original Sin of debasing the term “climate change” was committed by the IPCC when they intentionally limited their scope to man made climate change. From the Principles Governing IPCC Work

The role of the IPCC is to assess on a comprehensive, objective, open and transparent basis the scientific, technical and socio-economic information relevant to understanding the scientific basis of risk of human-induced climate change, its potential impacts and options for adaptation and mitigation.

All five IPCC reports have proceeded to claim most or all of the warming since 1950 is caused by human activity, especially burning of fossil fuels. They express confidence levels of 95% or more, all the while dismissing natural factors and long term warming and cooling cycles without even analyzing them.

Norway needs to listen to and take comfort from their own scientists. As Humlum at al. point out:

Climate development with possible anthropogenic effects occurs on a background of natural climatic variations, which may be considerable, and especially in the Arctic. Natural climate variations however remain poorly understood, although they remain important for discriminating between natural and anthropogenic influences on current climate change.

Natural cycles that have remained strong over long time are likely to continue without major changes into at the near future. Knowledge on such natural oscillations is therefore essential for forecasting future climate.

For more on Svalbard’s largest island see Spitsbergen Triangle: Ground Zero for Climate Mysteries


Social Cost of Carbon: Origin and Prospects


The Obama administration has been fighting climate change with a rogue wave of regulations whose legality comes from a very small base: The Social Cost of Carbon.

The purpose of the “social cost of carbon” (SCC) estimates presented here is to allow agencies to incorporate the social benefits of reducing carbon dioxide (CO2) emissions into cost-benefit analyses of regulatory actions that impact cumulative global emissions. The SCC is an estimate of the monetized damages associated with an incremental increase in carbon emissions in a given year. It is intended to include (but is not limited to) changes in net agricultural productivity, human health, property damages from increased flood risk, and the value of ecosystem services due to climate change. From the Technical Support Document: -Technical Update of the Social Cost of Carbon for Regulatory Impact Analysis -Under Executive Order 12866

A recent Bloomberg article informs on how the SCC notion was invented, its importance and how it might change under the Trump administration.
How Climate Rules Might Fade Away; Obama used an arcane number to craft his regulations. Trump could use it to undo them. (here)

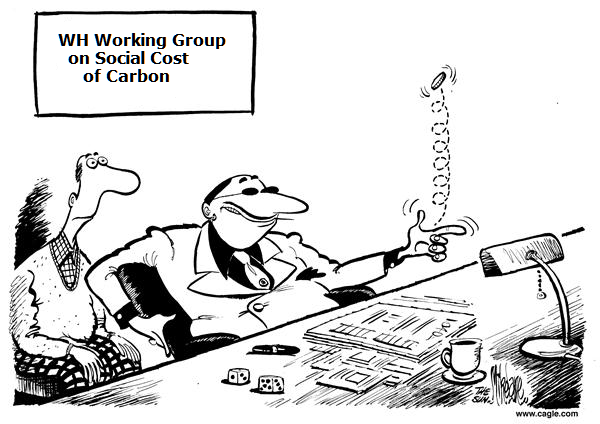
scc-working-group

In February 2009, a month after Barack Obama took office, two academics sat across from each other in the White House mess hall. Over a club sandwich, Michael Greenstone, a White House economist, and Cass Sunstein, Obama’s top regulatory officer, decided that the executive branch needed to figure out how to estimate the economic damage from climate change. With the recession in full swing, they were rightly skeptical about the chances that Congress would pass a nationwide cap-and-trade bill. Greenstone and Sunstein knew they needed a Plan B: a way to regulate carbon emissions without going through Congress.

Over the next year, a team of economists, scientists, and lawyers from across the federal government convened to come up with a dollar amount for the economic cost of carbon emissions. Whatever value they hit upon would be used to determine the scope of regulations aimed at reducing the damage from climate change. The bigger the estimate, the more costly the rules meant to address it could be. After a year of modeling different scenarios, the team came up with a central estimate of $21 per metric ton, which is to say that by their calculations, every ton of carbon emitted into the atmosphere imposed $21 of economic cost. It has since been raised to around $40 a ton.

Trump can’t undo the SCC by fiat. There is established case law requiring the government to account for the impact of carbon, and if he just repealed it, environmentalists would almost certainly sue.

There are other ways for Trump to undercut the SCC. By tweaking some of the assumptions and calculations that are baked into its model, the Trump administration could pretty much render it irrelevant, or even skew it to the point that carbon emissions come out as a benefit instead of a cost.

The SCC models rely on a “discount rate” to state the harm from global warming in today’s dollars. The higher the discount rate, the lower the estimate of harm. That’s because the costs incurred by burning carbon lie mostly in the distant future, while the benefits (heat, electricity, etc.) are enjoyed today. A high discount rate shrinks the estimates of future costs but doesn’t affect present-day benefits. The team put together by Greenstone and Sunstein used a discount rate of 3 percent to come up with its central estimate of $21 a ton for damage inflicted by carbon. But changing that discount just slightly produces big swings in the overall cost of carbon, turning a number that’s pushing broad changes in everything from appliances to coal leasing decisions into one that would have little or no impact on policy.

According to a 2013 government update on the SCC, by applying a discount rate of 5 percent, the cost of carbon in 2020 comes out to $12 a ton; using a 2.5 percent rate, it’s $65. A 7 percent discount rate, which has been used by the EPA for other regulatory analysis, could actually lead to a negative carbon cost, which would seem to imply that carbon emissions are beneficial. “Once you start to dig into how the numbers are constructed, I cannot fathom how anyone could think it has any basis in reality,” says Daniel Simmons, vice president for policy at the American Energy Alliance and a member of the Trump transition team focusing on the Energy Department.

David Kreutzer, a senior research fellow in energy economics and climate change at Heritage and a member of Trump’s EPA transition team, laid out one of the primary arguments against the SCC. “Believe it or not, these models look out to the year 2300. That’s like effectively asking, ‘If you turn your light switch on today, how much damage will that do in 2300?’ That’s way beyond when any macroeconomic model can be trusted.”

Another issue for those who question the Obama administration’s SCC: It estimates the global costs and benefits of carbon emissions, rather than just focusing on the impact to the U.S. Critics argue that this pushes the cost of carbon much higher and that the calculation should instead be limited to the U.S.; that would lower the cost by more than 70 percent, says the CEI’s Mario Lewis.

Still, by narrowing the calculation to the U.S., Trump could certainly produce a lower cost of carbon. Asked in an e-mail whether the new administration would raise the discount rate or narrow the scope of the SCC to the U.S., one person shaping Trump energy and environmental policy replied, “What prevents us from doing both?”

drain-the-swamp

Ban Ki-moon, Listen to the Masses!

Over 10 million ordinary people have told the UN what matters most to them, and here are the results.

According to this huge UN survey, good education, healthcare and jobs are far and away the top priorities. And way down at the bottom is “Action taken on climate change.” You would think that the UN Secretary-General would have many things on his plate, and even “Phone and Internet Access” comes ahead of climate change.

Yet because Ki-moon is seeking a legacy in bringing the Paris accord into force, that last-place concern is at the top of his agenda.

angry-bird
Summary

In a previous post Hammer and Nail I suggested that climate activists like Ban Ki-Moon are working on their own needs for esteem and self-actualization, while most of the world are struggling with the most basic needs. This survey proves that point, especially when charts show that only in richer, more developed countries does climate change rise a few steps above the bottom.

It could be argued that the Paris accord is not really action on climate change, just symbolism like the Angry Bird, but it is still a focus on the thing that matters least to the masses.
More on misplaced ecological priorities at Daily Maverick

Footnote:

From the Final Episode of Yes Prime Minister (on the subject of climate change)

PM Jim Hunt
“But how can we do something about
something that isn’t happening?”

Sir Humphrey Appleby
“It’s much easier to solve an
imaginary problem than a real one.”

Climate Policies Gouge the Masses

There is still no empirical proof from the real world that burning fossil fuels causes temperatures to rise, despite those claiming the “Science is Settled”.

“There is no scientific proof that human emissions of carbon dioxide are the dominant cause of the minor warming of the Earth’s atmosphere over the past 100 years. If there were such a proof it would be written down for all to see. No actual proof, as it is understood in science, exists.”
Patrick Moore, co-founder of Greenpeace, Senate Testimony 2014

Beyond the lack of scientific support for the claims, there is the further problem with the proposed and already enacted climate policies intending to reduce carbon emissions and lower future warming. The policies themselves are ill-advised even if scientific proof existed.

David R. Henderson, public policy economist at the Stanford Hoover Institution, puts the issue this way:

Claims that human-caused global warming will raise average temperatures by 2o C to 5o C over the next 100 years and cause serious harm to society are controversial. However, assuming that global warming will be a big problem, there are two important questions: (1) What should be done about it? and (2) When should it be done?

Hypothetical: Assuming global warming is real and caused by fossil fuel emissions, what should we do about it?

Proposition #1: Put a price on Carbon by taxing it.

Henderson comments:
But carbon already has a price, or, more exactly, multiple prices. Natural gas has a price; oil has a price; coal has a price. And their prices are related to the valuable carbon component of those fuels because it’s carbon that makes those fuels valuable. Just as there’s no such thing as a free lunch, carbon is not free.

So why does Professor Gordon claim that taxing carbon means “putting a price on carbon?”
I can only speculate because I don’t know him, but here’s what I’m willing to bet dollars to doughnuts on: he calls a tax a price in order to lull the reader into thinking that it’s not a tax. Later in the piece he admits that it’s a tax but in his first mention, which sets the stage, he doesn’t.

Proposition #2: A carbon tax simply replaces complex regulations.

Henderson:
If a carbon tax is implemented, it will likely be on top of the extensive regulation Canadians now contend with. Who’s offering to end regulation on carbon usage? Who’s offering to legalize certain kinds of incandescent light bulbs? Who’s offering to end the government’s mandates on energy efficiency in cars, trucks, washers, driers, refrigerators, air conditioners and other appliances? Who’s offering to get rid of expensive, market-distorting subsidies to solar and wind power? Anyone? Anyone? 

As economists well know, adding to the price of energy functions as a regressive consumption tax, with greatest impacts on poor families who have the least amount of discretionary income.

Hypothetical: Assuming global warming is real and caused by fossil fuel emissions, when should we do something about it?

Proposition 3#: Acting now is cheaper than delaying.

Here’s where Henderson really shines, dissecting the phoney economics underlying climate policies, and revealing the reverse Robin Hood effect of mitigation proposals. For in fact, economists know that we are richer today than our forefathers, and it is likely future generations will be richer than us. The whole point of using discount rates in cost/benefit studies is to recognize the advantages of building wealth today while delaying spending until later.

Henderson:

The two main approaches are to make major adjustments now or gradually through time to reduce warming or mitigate its effects. Thus, thinking about efforts to combat global warming requires comparing costs today with potential benefits 100 years or more in the future. Immediate Action versus Waiting. Acting now might slow global warming so that major adjustments will not be needed later.

But there are two huge disadvantages. First, actions today will be based on current technology. Because technology will almost certainly improve, solutions implemented in the future are likely to be more efficient — more effective per unit of cost. By comparison, solutions implemented today would use cruder, more expensive technology.

Second, money spent now to offset global warming could instead be invested in ways that would increase national income and wealth, creating more options to deal with any future negative effects of a warmer world. Future generations will likely be wealthier than present generations, just as the people living today are wealthier than past generations. Imposing large costs today to create environmental benefits for future generations would sacrifice current potential consumption for people in the future who will almost certainly have higher living standards.

What is the right Discount Rate for Taxing Carbon

There is much debate about what discount rate to use when comparing environmental costs and benefits.  Generally, the more one values today’s dollars over tomorrow’s, the higher is one’s discount rate.  At one extreme, an infinitely high discount rate would imply that we place almost no value on future consumption.  Conversely, using a discount rate of zero means that benefits today are no more valuable than benefits 100 years from now..

However, the choice of which discount rate to use is not about the weight given to the well-being of future generations but about opportunity costs. Investments people make today are likely to increase the wealth of their descendants, giving future generations greater resources to exercise their preferences regarding environmental protection.

The higher the rate of return that can be earned by investing a dollar today, the more wealth future generations are deprived of if the money is spent now.  Thus, Kevin Murphy of the University of Chicago argues that we should use the market interest rate as the discount rate because that is the opportunity cost of climate mitigation. Interestingly, even Stern’s own model assumes that people 200 years from now will have real incomes that are more than 10 times incomes today.  This means that if the government taxes people today explicitly or through regulations to reduce climate change 200 years from now, the government will be taxing the poor to help the rich. 

How does using the interest rate as the discount rate work in practice?  Imagine that the damage from continued use of CO2-emitting fossil fuels is $300 per ton of emissions 100 years from now.  In 100 years, a $300 per ton tax on carbon emissions would reflect their social cost.  What this tax should be in the intervening years depends upon the interest rate that could be earned if money were invested.

Thus, beginning today, at a 6 percent interest rate, a tax of 88 cents per ton would pay the social costs of one ton of emissions in a century.  If the tax were implemented 80 years from now, the rate would be $93.54 per ton.  To put these numbers in perspective, a $1.00 tax per ton of carbon translates into a one-third cent per gallon tax on gasoline. On that basis:

  • A $300 per ton carbon tax 100 years from now would be equivalent to a tax of three-tenths of a cent per gallon today at an interest rate of 6 percent.
  • It would be two cents per gallon at an interest rate of 4 percent. 

Today, the actual federal tax is 18.4 cents per gallon.  Thus, if the correct carbon tax 100 years from now is $300, this implies that the gasoline tax today is much higher than the rate required to reflect the social costs of global warming, regardless of whether the right interest rate is 6 percent or 4 percent.

Conclusion.

If the government limits carbon emissions now through taxes or direct caps, it is taxing the poor today to benefit wealthier future generations. Perversely, such limits would also deprive future generations of the additional capital that would accumulate if the money were invested in the market instead of being used to combat climate change.

David R. Henderson is a research fellow with the Hoover Institution (here). He is also an associate professor of economics at the Naval Postgraduate School in Monterey, California.

Henderson’s writing focuses on public policy. His specialty is in making economic issues and analyses clear and interesting to general audiences. Two themes emerge from his writing: (1) that the unintended consequences of government regulation and spending are usually worse than the problems they are supposed to solve and (2) that freedom and free markets work to solve people’s problems.

Quotations from David Henderson come from these sources:

A carbon tax is not a ‘price’

Climate Economists Base Their Alarm on Their Own Ethical Judgments

Climate Change: Should We Tax the Poor to Help the Rich?

extortion2

Global Warming Extortion

Alberta Poisoned by Green Climate Policy

barrel-poison-7388531rev

Barry Cooper explains in this article published today in the Calgary Herald NDP climate policies are bearing their inevitable poisoned fruit

Contrary to what many NDP supporters, and many of my colleagues believe, businesses are more likely to respond to government policies than to set them. One of the responses to egregiously irresponsible policies is to invest elsewhere.

The Birn report did not discuss the scientific premises of anthropogenic climate warming, nor the prudence of attempting to regulate GHG emissions. What matters are the consequences of policy choices by Canadian and U.S. governments for Alberta and Saskatchewan.

Here are some pertinent facts.

The interdependence of North American economies and the familiar 10-to-one ratio between the two countries means that Canada must always adjust its policies to American realities. That ratio applies to global CO2 emissions (16 per cent for the U.S.; 1.7 per cent for Canada, of which the oilsands’ contribution is minuscule) as well as to GDP and much else. Canadian CO2 emissions are comparable to those of Texas. The big difference is how that CO2 is generated.

Coal is the largest source of American CO2, mostly from electricity generation, followed by transportation and industry. In Canada, industry — from fertilizer manufacturing to mining, smelting and pulp production — is the largest emitter, followed by transportation and then electricity generation. The main reason for this difference is that in B.C. and Laurentian Canada, hydroelectricity is the chief source of power. Prairie rivers furnish great fishing opportunities, but few electrons.

Since CO2 from American coal plants alone are double those from the entire Canadian economy, they have been the focus of U.S. policies. Replacing coal-generation with natural gas has been made easier by low natural gas prices, partly the result of innovative shale-gas exploitation.

In Canada, things are different. Because more than 80 per cent of Canadian electricity is generated by non-emitting sources, other sectors must be targeted to achieve levels of emission reductions comparable to the Americans’. The cost, however, is bound to be higher: here, cheap gas hardly matters.

This is what makes carbon taxes so attractive to Canadian governments. They can’t go after coal plants, because there are so few left, so they go after the entire economy. Alberta’s carbon tax and Ontario’s cap-and-trade policy mean that over two-thirds of Canadian emissions will be covered by next year.

Big-government Liberals, socialists and members of the green cult will rejoice that we are saving the planet. However, the costs of the new NEP — the national emissions policy — achieved by carbon-tax harmonization, will introduce more incentives for investment in places where anthropogenic climate change is not an unquestioned public policy dogma.

Because the Prairie petroleum industry competes globally for both capital and markets, parochial Canadian climate policies add to costs and induce investors abroad. And they make no difference at all to global GHG emissions.

That is one reason why energy investment in Alberta is half 2014 levels. No wonder Finance Minister Joe Ceci is sad. The consequences of his own policies are bearing their inevitably poisoned fruit.

Barry Cooper is a professor of political science at the University of Calgary.

Footnote:

Former Canadian PM Stephen Harper (from Alberta) based his climate change policy on the realities mentioned in the article.  His administration was committed to matching US energy policies on a sector by sector basis.  Since the US went after coal, so did Canada.  The US has not done anything about oil and gas, so neither should Canada.

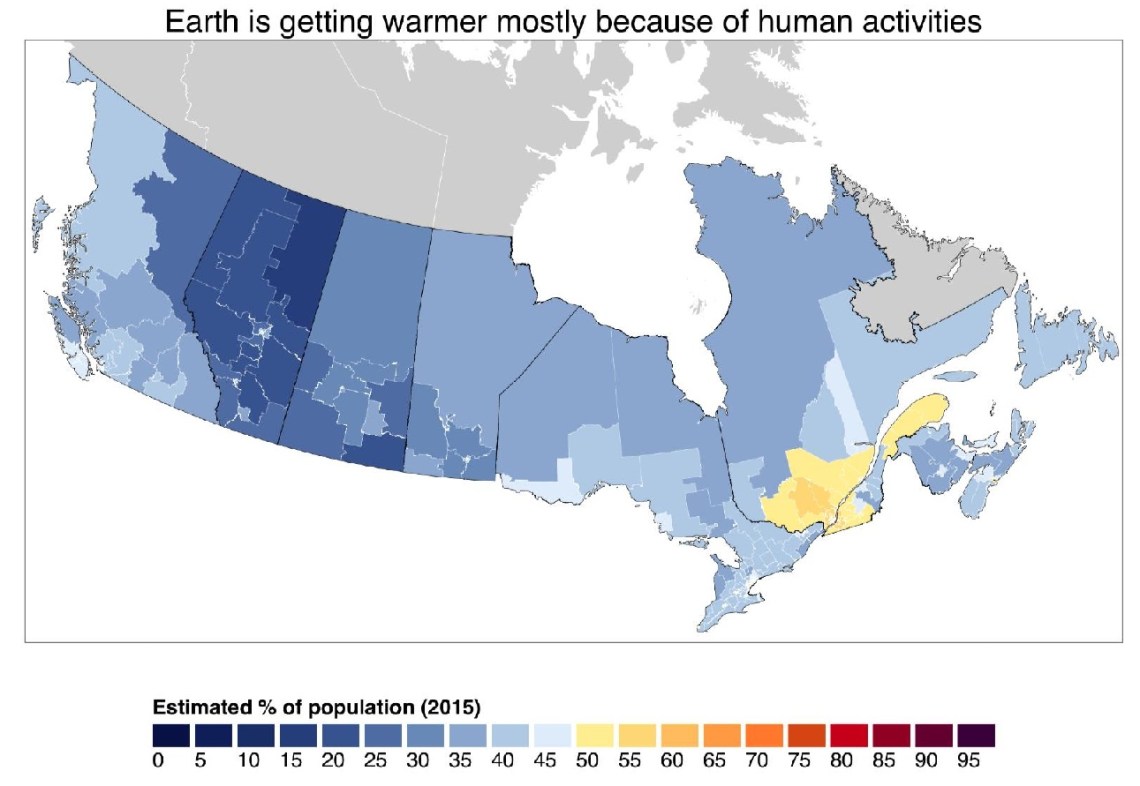
The ruling NDP party are on thin ice because Albertans are mostly skeptical of global warming claims.  A recent Canadian survey shows the % of people whose beliefs would support what the administration is doing.  That’s right: Alberta is the dark blue province in the map.

More on survey of Canadian attitudes toward global warming:      https://rclutz.wordpress.com/2016/02/25/uncensored-canadians-view-global-warming/

More on toxic effects from Green energy policies:  https://rclutz.wordpress.com/2016/08/01/electrical-madness-in-green-ontario/

Background on Alberta oilsands:  https://rclutz.wordpress.com/2015/11/07/brer-canada-and-the-tar-baby/


Cap and Trade Hype


Reggie2In the comics, it was Archie vs. Reggie, but in the US emissions markets, it is Arnie vs. ReGGI. Arnie Schwarzenegger pushed California cap and trade, now called the Western Climate Initiative, while nine northeastern states make up the Regional Greenhouse Gas Initiative.

The media is touting the “success” of ReGGI, saying it shows how states can comply with the EPA Clean Power Plan (whose implementation was stayed by the Supreme Court but proponents are undeterred.)

Climate Progress Gives the Rosy Outlook

The Regional Greenhouse Gas Initiative, known as RGGI (pronounced: Reggie), is a carbon pricing mechanism that limits emissions and invests in efficiency and low-emission generation. Since it was implemented in 2008, RGGI states have seen a 37 percent decrease in emissions from electricity, while simultaneously decreasing consumer costs. RGGI will also function as a compliance plan for the Clean Power Plan, according to multiple industry sources — if it stays effective.

Right now, RGGI is under review — and businesses, environmental groups, regulators, universities, and private citizens are encouraging the states to double down on the program. They say extending the program to 2030 and lowering the annual limit on emissions will ensure RGGI stays successful.

ReGGI’s Peformance, Warts and All

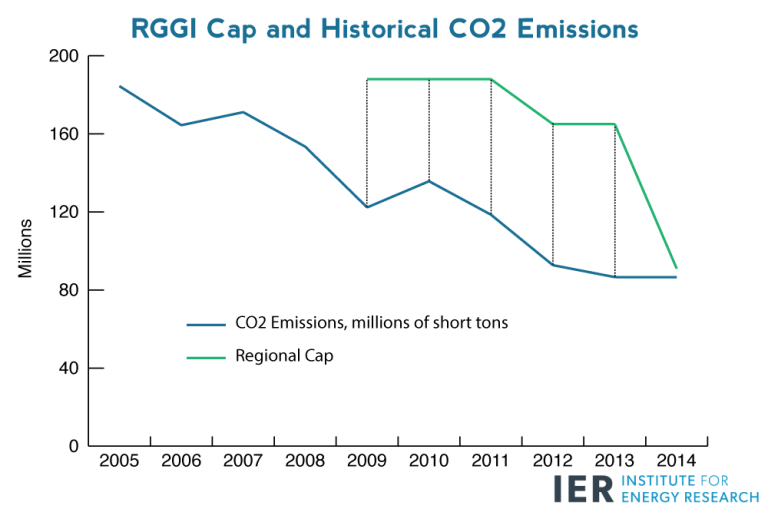
Actually, emissions came down because of market forces, and the cap was too high to have any effect on reductions. Instead a surplus of allowances drove the price down and investors bought them in lots to hedge against higher future prices. Buried in Acadia Center’s friendly review of ReGGI:

Emissions reductions have outpaced expectations since RGGI’s launch, creating allowance oversupply. Regional CO2 emissions in 2008 were 139 million tons, while the initial cap for the nine currently participating states8 was set at 165 million tons per year from 2009 through 2014. This initial oversupply was a result of a combination of electric sector trends already discussed in this report, conservative emissions projections, and actions taken by compliance entities in anticipation of RGGI implementation.9 With emissions falling significantly below the cap in RGGI’s early years (2008 to 2013) market participants bought tens of millions of low-priced allowances each year to be banked for future use. By the end of 2013, 140 million tons of these surplus allowances had been accrued.xxii This large bank suppressed allowance prices and removed the prospect of market scarcity.

RGGI currently employs price controls to contain allowance prices within predetermined ranges. The price floor represents the minimum price at which allowances can be sold at auctions; beginning at $1.86 in 2009 and rising gradually to $2.10 in 2016. Under the oversupplied cap from 2009 through 2012, the price floor preserved the value of RGGI allowances by preventing additional declines in allowance prices or sales and ensuring that surplus allowances were withheld from the market. As a result, 176 million allowances went unsold during this period.

Benefits Miscredited to ReGGI

ReGGI is also credited with participating states having lower electricity prices and higher economic growth. But depressed oil and gas prices caused the cheap electricity. And the depressed prices of the allowances meant that economic pain has yet to be inflicted. All that is about to change.

RGGI A Faulty Model for a Successful Cap and Trade from Institute for Energy Research

The trend of rising prices is only accelerating. In September 2015, prices breached $6 per ton, and in December 2015, clearing prices rose to $7.50—more than $2 above prices last December.[6] The graph below depicts how average clearing prices have risen after the regional cap tightened substantially in 2014. It compares RGGI emissions as a percentage of the cap with the quantity weighted average of auction clearing prices through the third quarter of 2015.[7].

As clearing prices for CO2 allowances become increasingly expensive and states encounter diminishing returns from cutting carbon dioxide emissions, RGGI members will have more difficulty meeting the regional cap. In fact, for the first three quarters of 2015, RGGI states have emitted about 68 million short tons of CO2 and are quickly approaching the 2015 regional cap of 88.7 million short tons.

Since carbon-trading schemes artificially make certain technologies less economical or even uncompetitive, they create conditions that cause existing power plants to prematurely retire and saddle families and businesses with higher energy bills. An IER study found that existing sources generate electricity more affordably than new sources of the same type. Moreover, electricity from existing coal is nearly 3 times more affordable than electricity from new wind turbines and almost half as expensive as electricity from new natural gas plants. This is particularly problematic for RGGI states because their average retail electricity prices are already above the U.S. average.

Summary

ReGGI prices are too low to take credit for reducing emissions, and raising them will show up in higher energy and electricity prices, and eventually, higher prices of everything.

The whole scheme is running along, disconnected from reality, doing no good, but not yet doing much harm.  And this is the argument for expanding it and building upon its “success.”

Oh. About Arnie’s California punch bowl, is that going better? Not really.

The problem is that the permits are selling at a slower and slower rate. The surplus of allowances is becoming so large in systems run by Europe, California and Quebec — which together account for more than 90 percent of global trading — that by 2022 it could cover the emissions spewing from every car on Earth for a full year, according to estimates by the London environmental group Sandbag Climate Campaign CIC and Bloomberg New Energy Finance.

In California’s market, all 23 million allowances sold in an auction in 2014. In May 2016, 7.3 million permits found buyers, only 11 percent of what was put up for sale.

Activists wear dark shades when pronouncing future climate catastrophes, but switch for rose-colored glasses when telling others to imitate these failed market experiments.

b1197