Sobering Facts about Global Warming

A Short List Of Facts Global Warming Alarmists Don’t Want To Face  by Issues and Insights Editorial Board.  Excerpts in italics with my bolds.

Democrats nearly had a brawl last week in California after the party’s Resolutions Committee rejected a proposed climate debate among Democratic presidential candidates. Global warming so fully occupies the thinking of some that there’s no room for information that will contradict their faith.

If they’d only open their minds they’d see:

The U.S. hasn’t warmed since 2005. America isn’t the entire world. But the alarmists gleefully point out regional heatwaves and the “hottest day on record” when cities endure summer scorchers. So let’s look at the data. The U.S. Climate Reference Network, “a sophisticated climate-observing network specifically designed and deployed for quantifying climate change on a national scale,” has found there’s been no warming in the U.S. going back to 2005.

In fact, says meteorologist Anthony Watts, the “little known data from the state-of-the-art” operation, “(which never seems to make it into NOAA’s monthly ‘state of the climate’ reports) show that for the past nine months, six of them were below normal.”

The data also tell us 2019’s average has been cooler than 2005’s, the first year of the data set.

Man’s carbon dioxide emissions are not burning down the Amazon. Empty-headed celebrities and activists have had quite a virtue-signaling feast tweeting photos from fires three decades ago, fires in Europe, and fires in the U.S. Yes, we’ve seen the claims that there are 80% more fires this year than last in South America, but we’ve also seen this from the New York Times:

“The majority of these fires were set by farmers preparing Amazon-adjacent farmland for next year’s crops and pasture.”

Of course that’s a disposable detail because it doesn’t fit the narrative.

Carbon dioxide increases historically lag temperature increases. “In 1985, ice cores extracted from Greenland revealed temperatures and CO2 levels going back 150,000 years,” writes author Joanne Nova. “Temperature and CO2 seemed locked together. It was a turning point — the ‘greenhouse effect’ captured attention. But, in 1999 it became clear that carbon dioxide rose and fell after temperatures did. By 2003, we had better data showing the lag was 800 ± 200 years. CO2 was in the back seat.”

Of course the climate crusaders have written at great length to tell us it’s all just a myth. This time, they say, the warming (which is in doubt) is caused by man. It just has to be. All those other warming periods, the alarmists tell us, can be explained by natural events, such as Earth’s orbit around the sun, which, incidentally, we have mentioned as one of many factors that influence climate changes.

Less than 5% of carbon dioxide emissions are produced by man. Web searches turn up what seems like an endless list of stories and blog posts reporting that CO2 levels in the atmosphere have reached or exceeded 415 parts per million. This has been almost universally treated as the tip of an imminent disaster, as man has pushed greenhouse gas emissions beyond a dangerous threshold. But has he?

The United Nation’s Intergovernmental Panel on Climate Change “agrees today’s annual human carbon dioxide emissions are 4.5 ppm (parts per million) per year and nature’s carbon dioxide emissions are 98 ppm per year,” says climate scientist Ed Berry. “Yet, the IPCC claims human emissions have caused all the increase in carbon dioxide since 1750, which is 30% of today’s total.

“How can human carbon dioxide, which is less than 5% of natural carbon dioxide, cause 30% of today’s atmospheric carbon dioxide? It can’t.”

Don’t like Berry’s numbers? Consider another set of figures from the IPCC’s Fourth Assessment Report, which says that of the 750 gigatons of CO2 which travel through the carbon cycle every year, only 29 gigatons, or less than 4%, are produced by man.

Is it possible for such a small portion to have such a great influence? Despite what the hysterics tell us, it’s an unanswered question.

There are many other unanswered questions about climate, as well. An honest person would admit that they might remain unanswered forever. An alarmist, however, has his mind made up — and closed down.

See also Alarmists Anonymous


Greenland Glaciers: History vs. Hysteria

The modern pattern of environmental scares started with Rachel Carson’s Silent Spring claiming chemical are killing birds, only today it is windmills doing the carnage. That was followed by ever expanding doomsday scenarios, from DDT, to SST, to CFC, and now the most glorious of them all, CO2. In all cases the menace was placed in remote areas difficult for objective observers to verify or contradict. From the wilderness bird sanctuaries, the scares are now hiding in the stratosphere and more recently in the Arctic and Antarctic polar deserts. See Progressively Scaring the World (Lewin book synopsis)

The advantage of course is that no one can challenge the claims with facts on the ground, or on the ice. Correction: Scratch “no one”, because the climate faithful are the exception. Highly motivated to go to the ends of the earth, they will look through their alarmist glasses and bring back the news that we are indeed doomed for using fossil fuels.

A recent example is a team of researchers from Dubai (the hot and sandy petro kingdom) going to Greenland to report on the melting of Helheim glacier there.  The article is NYUAD team finds reasons behind Greenland’s glacier melt.  Excerpts in italics with my bolds.

First the study and findings:

For the first time, warm waters that originate in the tropics have been found at uniform depth, displacing the cold polar water at the Helheim calving front, causing an unusually high melt rate. Typically, ocean waters near the terminus of an outlet glacier like Helheim are at the freezing point and cause little melting.

NYUAD researchers, led by Professor of Mathematics at NYU’s Courant Institute of Mathematical Sciences and Principal Investigator for NYU Abu Dhabi’s Centre for Sea Level Change David Holland, on August 5, deployed a helicopter-borne ocean temperature probe into a pond-like opening, created by warm ocean waters, in the usually thick and frozen melange in front of the glacier terminus.

Normally, warm, salty waters from the tropics travel north with the Gulf Stream, where at Greenland they meet with cold, fresh water coming from the polar region. Because the tropical waters are so salty, they normally sink beneath the polar waters. But Holland and his team discovered that the temperature of the ocean water at the base of the glacier was a uniform 4 degrees Centigrade from top to bottom at depth to 800 metres. The finding was also recently confirmed by Nasa’s OMG (Oceans Melting Greenland) project.

“This is unsustainable from the point of view of glacier mass balance as the warm waters are melting the glacier much faster than they can be replenished,” said Holland.

Surface melt drains through the ice sheet and flows under the glacier and into the ocean. Such fresh waters input at the calving front at depth have enormous buoyancy and want to reach the surface of the ocean at the calving front. In doing so, they draw the deep warm tropical water up to the surface, as well.

All around Greenland, at depth, warm tropical waters can be found at many locations. Their presence over time changes depending on the behaviour of the Gulf Stream. Over the last two decades, the warm tropical waters at depth have been found in abundance. Greenland outlet glaciers like Helheim have been melting rapidly and retreating since the arrival of these warm waters.

Then the Hysteria and Pledge of Allegiance to Global Warming

“We are surprised to learn that increased surface glacier melt due to warming atmosphere can trigger increased ocean melting of the glacier,” added Holland. “Essentially, the warming air and warming ocean water are delivering a troubling ‘one-two punch’ that is rapidly accelerating glacier melt.”

My comment: Hold on.They studied effects from warmer ocean water gaining access underneath that glacier. Oceans have roughly 1000 times the heat capacity of the atmosphere, so the idea that the air is warming the water is far-fetched. And remember also that long wave radiation of the sort that CO2 can emit can not penetrate beyond the first millimeter or so of the water surface. So how did warmer ocean water get attributed to rising CO2? Don’t ask, don’t tell.  And the idea that air is melting Arctic glaciers is also unfounded.

Consider the basics of air parcels in the Arctic.

The central region of the Arctic is very dry. Why? Firstly because the water is frozen and releases very little water vapour into the atmosphere. And secondly because (according to the laws of physics) cold air can retain very little moisture.

Greenland has the only veritable polar ice cap in the Arctic, meaning that the climate is even harsher (10°C colder) than at the North Pole, except along the coast and in the southern part of the landmass where the Atlantic has a warming effect. The marked stability of Greenland’s climate is due to a layer of very cold air just above ground level, air that is always heavier than the upper layers of the troposphere. The result of this is a strong, gravity-driven air flow down the slopes (i.e. catabatic winds), generating gusts that can reach 200 kph at ground level.

Arctic air temperatures

Some history and scientific facts are needed to put these claims in context. Let’s start with what is known about Helheim Glacier.

Holocene history of the Helheim Glacier, southeast Greenland

Helheim Glacier ranks among the fastest flowing and most ice discharging outlets of the Greenland Ice Sheet (GrIS). After undergoing rapid speed-up in the early 2000s, understanding its long-term mass balance and dynamic has become increasingly important. Here, we present the first record of direct Holocene ice-marginal changes of the Helheim Glacier following the initial deglaciation. By analysing cores from lakes adjacent to the present ice margin, we pinpoint periods of advance and retreat. We target threshold lakes, which receive glacial meltwater only when the margin is at an advanced position, similar to the present. We show that, during the period from 10.5 to 9.6 cal ka BP, the extent of Helheim Glacier was similar to that of todays, after which it remained retracted for most of the Holocene until a re-advance caused it to reach its present extent at c. 0.3 cal ka BP, during the Little Ice Age (LIA). Thus, Helheim Glacier’s present extent is the largest since the last deglaciation, and its Holocene history shows that it is capable of recovering after several millennia of warming and retreat. Furthermore, the absence of advances beyond the present-day position during for example the 9.3 and 8.2 ka cold events as well as the early-Neoglacial suggest a substantial retreat during most of the Holocene.

Quaternary Science Reviews, Holocene history of the Helheim Glacier, southeast Greenland
A.A.Bjørk et. Al. 1 August 2018

The topography of Greenland shows why its ice cap has persisted for millenia despite its southerly location.  It is a bowl surrounded by ridges except for a few outlets, Helheim being a major one.

And then, what do we know about the recent history of glacier changes. Two Decades of Changes in Helheim Glacier

Helheim Glacier is the fastest flowing glacier along the eastern edge of Greenland Ice Sheet and one of the island’s largest ocean-terminating rivers of ice. Named after the Vikings’ world of the dead, Helheim has kept scientists on their toes for the past two decades. Between 2000 and 2005, Helheim quickly increased the rate at which it dumped ice to the sea, while also rapidly retreating inland- a behavior also seen in other glaciers around Greenland. Since then, the ice loss has slowed down and the glacier’s front has partially recovered, readvancing by about 2 miles of the more than 4 miles it had initially ­retreated.

NASA has compiled a time series of airborne observations of Helheim’s changes into a new visualization that illustrates the complexity of studying Earth’s changing ice sheets. NASA uses satellites and airborne sensors to track variations in polar ice year after year to figure out what’s driving these changes and what impact they will have in the future on global concerns like sea level rise.

Since 1997, NASA has collected data over Helheim Glacier almost every year during annual airborne surveys of the Greenland Ice Sheet using an airborne laser altimeter called the Airborne Topographic Mapper (ATM). Since 2009 these surveys have continued as part of Operation IceBridge, NASA’s ongoing airborne survey of polar ice and its longest-running airborne mission. ATM measures the elevation of the glacier along a swath as the plane files along the middle of the glacier. By comparing the changes in the height of the glacier surface from year to year, scientists estimate how much ice the glacier has lost.

The animation begins by showing the NASA P-3 plane collecting elevation data in 1998. The laser instrument maps the glacier’s surface in a circular scanning pattern, firing laser shots that reflect off the ice and are recorded by the laser’s detectors aboard the airplane. The instrument measures the time it takes for the laser pulses to travel down to the ice and back to the aircraft, enabling scientists to measure the height of the ice surface. In the animation, the laser data is combined with three-dimensional images created from IceBridge’s high-resolution camera system. The animation then switches to data collected in 2013, showing how the surface elevation and position of the calving front (the edge of the glacier, from where it sheds ice) have changed over those 15 years.

Helheim’s calving front retreated about 2.5 miles between 1998 and 2013. It also thinned by around 330 feet during that period, one of the fastest thinning rates in Greenland.

“The calving front of the glacier most likely was perched on a ledge in the bedrock in 1998 and then something altered its equilibrium,” said Joe MacGregor, IceBridge deputy project scientist. “One of the most likely culprits is a change in ocean circulation or temperature, such that slightly warmer water entered into the fjord, melted a bit more ice and disturbed the glacier’s delicate balance of forces.”

Comment:

Once again, history is a better guide than hysteria.  Over time glaciers advance and retreat, and incursions of warm water are a key factor.  Greenland ice cap and glaciers are part of the the Arctic self-oscillating climate system operating on a quasi-60 year cycle.

Outlook: Northwest Passage Less Icy in 2019

Background:  The Outlook in 2007

From Sea Ice in Canada’s Arctic: Implications for Cruise Tourism by Stewart et al. December 2007. Excerpts in italics with my bolds.

Although cruise travel to the Canadian Arctic has grown steadily since 1984, some commentators have suggested that growth in this sector of the tourism industry might accelerate, given the warming effects of climate change that are making formerly remote Canadian Arctic communities more accessible to cruise vessels. Using sea-ice charts from the Canadian Ice Service, we argue that Global Climate Model predictions of an ice-free Arctic as early as 2050-70 may lead to a false sense of optimism regarding the potential exploitation of all Canadian Arctic waters for tourism purposes. This is because climate warming is altering the character and distribution of sea ice, increasing the likelihood of hull-penetrating, high-latitude, multi-year ice that could cause major pitfalls for future navigation in some places in Arctic Canada. These changes may have negative implications for cruise tourism in the Canadian Arctic, and, in particular, for tourist transits through the Northwest Passage and High Arctic regions.

The most direct route through the Northwest Passage is via Viscount Melville Sound into the M’Clure Strait and around the coast of Banks Island. Unfortunately, this route is marred by difficult ice, particularly in the M’Clure Strait and in Viscount Melville Sound, as large quantities of multi-year ice enter this region from the Canadian Basin and through the Queen Elizabeth Islands.

As Figure 5 illustrates, difficult ice became particularly evident, hence problematic, as sea-ice concentration within these regions increased from 1968 to 2005; as well, significant increases in multi-year ice are present off the western coast of Banks Island as well. Howell and Yackel (2004) illustrated that ice conditions within this region during the 1969–2002 navigation seasons exhibited greater severity from 1969 to1979 than from 1991 to 2002. This variability likely is a reflection of the extreme light-ice season present in 1998(Atkinson et al., 2006), from which the region has since recovered. Cruise ships could use the Prince of Wales Strait to avoid the choke points on the western coast of Banks Island, but entry is difficult; indeed, Howell and Yackel (2004) showed virtually no change in ease of navigation from 1969 to 2002.

An alternative, longer route through the Northwest Passage passes through either Peel Sound or the Bellot Strait. The latter route potentially could avoid hazardous multi-year ice in Peel Sound, but its narrow passageway makes it unfeasible for use by larger vessels. Regardless of which route is selected, a choke point remains in the vicinity of the Victoria Strait (Fig. 5). This strait acts as a drain trap for multi-year ice that has entered the M’Clintock Channel region and gradually advances south-ward (Howell and Yackel, 2004; Howell et al., 2006). While Howell and Yackel (2004) showed slightly safer navigation conditions from 1991 to 2002 compared to 1969 to 1990, they attributed this improvement to the anomalous warm year of 1998 that removed most of the multi-year ice in the region. From 2000 to 2005, when conditions began to recover from the 1998 warming, atmospheric forcing was insufficient to break up the multi-year ice that entered the M’Clintock Channel. Instead the ice became mobile, flowing southward into the Victoria Strait as the surrounding first-year ice broke up earlier (Howell et al., 2006).

During the past 20 years, cruises gradually have become an important element of Canadian Arctic tourism, and currently there seems to be consensus about the cruise industry’s inevitable growth, especially in the vicinity of Baffin Bay. However, we have stressed the likelihood that sea-ice hazards will continue to exist and will present ongoing navigational challenges to tour operators, particularly those operating in the western regions of the Canadian Arctic.

Fast Forward to Summer of 2018:  Northwest Passage Proved Impassable

August 23, 2018 . At least 22 vessels are affected and several have turned back to Greenland.

Reprinted from post on September 3, 2018:  News today from the Northwest Passage blog that S/V CRYSTAL has given up after hanging around Fort Ross hoping for a storm or melting to break the ice barrier blocking their way west.
20180902-1025_crystal

As the vessel tracker shows, they have been forced to Plan C, which is returning to Greenland and accept that the NW Passage is closed this year. The latest ice chart gave them no hope for getting through.  Note yachts can sail through green (3/10), so the hope is for red to yellow to green.  But that did not happen last year.
20180902180000_wis38ct_0010210949

The image below shows the ice with which they were coping.
DCIM100GOPROGOPR5778.

More details at NW Passage blog 20180902 S/V CRYSTAL and S/V ATKA give up and retreat back to Greenland – Score ICE 3 vs YACHTS 0

Current Situation in Canadian Arctic Archipelago

The current ice map of Queen Maude region shows the difference between 2019 and last year.

Remembering that yachts need at most 1-3/10 ice conditions (light green), it is showing Peel Sound on the left side is open now, but was the obstruction last year.  Not shown but also important is open water in Barrow Strait allowing access to Peel Sound from the north.  Conversely, on the top right Prince Regent Inlet is plugged at the top and impassable for now, and perhaps for the year.

As reported at the Northwest Passage Blogspot, yachts are taking the Peel Sound route this year, rather than using Prince Regent Inlet and Bellot Strait, due to ice conditions. Excerpts in italics with my bolds.

Peel Sound, With Trepidation
by Randall
August 16, 2019
Days at Sea: 262
Over the last few days, charts have shown a significant reduction in ice concentrations in Peel, but there is still ice, lots of ice. One hundred miles into the Sound from the N, there is a band of 4-6/10ths ice that is sixty-five miles long and covers both the eastern and western shores. Another one hundred miles below that is a large band of 1-3/10ths ice. Below that there is open water, but it is threatened by the heavy ice feeding in from M’Clintock Channel.

Add to this an imminent change in the weather. Long range forecasts are calling for a switch from these long-running E winds to SW winds and then strong southerlies that could scramble the current ice configuration.
Add to this a paucity of anchorages in Peel. Two of the best on the W coast are icebound. The next, False Strait, is just above Bellot Strait and 165 miles from the opening.

In the evening I reach out to the ice guide, Victor Wejer, for a consult on anchorages. Mo needs a place to hide if things go badly. I show him the areas I’ve chosen.

“This is a subject I would like to avoid,” he replies. “It is not written in stone that you must take the entirety of Peel in one go, but it is the usual way. Read the Canadian Sailing Directions. The height of Somerset Island does weird things to the wind; it can go from calm to gale in an instant. Most of what look like anchorages on the chart are just not safe.”

“As to ice,” he continues, “this is also difficult. Peel is narrow and fed from M’Clintock. Most sailboat crews fight tooth and ice pole to get through. Consider that Matt Rutherford chose Prince Regent. But for you there may not be an option. Regent will not be clear for a long time; maybe not at all this year.”

By now four boats are through Peel, below Bellot Strait and on their way to Gjoa Haven. Yellow-hulled Breskell is one of them, but it has taken her four days to transit 200 miles, and I can tell from the way Olivier writes his encouraging emails that he has his doubts about doing it solo.

MO IS THROUGH THE ICE!
by Randall
August 19, 2019
1845 local
70 32S 97 27W
Larsen Sound
The Arctic

Just a quick note to report that Mo is through the ice and sailing fast on a N wind for Cambridge Bay, 235 miles SW.

I have been pushing to get to Alioth’s position for two days. She has a busted gear box and can’t make more than three knots under power. She has been hove to at the head of our last major ice plug waiting for an escort as she’d have to sail through, a tricky business.

We’ve all been sweating bullets over this last 30 miles of ice, and for four days I’ve been underway and hand steering for 18 to 20 hours a day through 3 – 5/10ths ice to get here. Only a few hours sleep a night this last week.

As it turns out, today was a piece of cake. We saw huge ice floes the size of city blocks but with wide lanes in between. Alioth and another boat, Mandregore, sailed downwind without trouble with Mo bringing up the rear under power just in case.

Which Comes First: Story or Facts?


Facts vs Stories is written by Steven Novella at Neurologica. Excerpts in italics with my bolds.

There is a common style of journalism, that you are almost certainly very familiar with, in which the report starts with a personal story, then delves into the facts at hand often with reference to the framing story and others like it, and returns at the end to the original personal connection. This format is so common it’s a cliche, and often the desire to connect the actual new information to an emotional story takes over the reporting and undermines the facts.

This format reflects a more general phenomenon – that people are generally more interested in and influenced by a good narrative than by dry facts. Or are we? New research suggests that while the answer is still generally yes, there is some more nuance here (isn’t there always?). The researchers did three studies in which they compared the effects of strong vs weak facts presented either alone or embedded in a story. In the first two studies the information was about a fictitious new phone. The weak fact was that the phone could withstand a fall of 3 feet. The strong fact was that the phone could withstand a fall of 30 feet. What they found in both studies is that the weak fact was more persuasive when presented embedded in a story than alone, while the strong fact was less persuasive.

They then did a third study about a fictitious flu medicine, and asked subjects if they would give their e-mail address for further information. People are generally reluctant to give away their e-mail address unless it’s worth it, so this was a good test of how persuasive the information was. When a strong fact about the medicine was given alone, 34% of the participants were willing to provide their e-mail. When embedded in a story, only 18% provided their e-mail.  So, what is responsible for this reversal of the normal effect that stories are generally more persuasive than dry facts?

The authors suggest that stories may impair our ability to evaluate factual information.

This is not unreasonable, and is suggested by other research as well. To a much greater extent than you might think, cognition is a zero-sum game. When you allocate resources to one task, those resources are taken away from other mental tasks (this basic process is called “interference” by psychologists). Further, adding complexity to brain processing, even if this leads to more sophisticated analysis of information, tends to slow down the whole process. And also, parts of the brain can directly suppress the functioning of other parts of the brain. This inhibitory function is actually a critical part of how the brain works together.

Perhaps the most dramatic relevant example of this is a study I wrote about previously in which fMRI scans were used to study subjects listening to a charismatic speaker that was either from the subjects religion or not. When a charismatic speaker that matched the subject’s religion was speaking, the critical thinking part of the brain was literally suppressed. In fact this study also found opposite effects depending on context.

The contrast estimates reveal a significant increase of activity in response to the non-Christian speaker (compared to baseline) and a massive deactivation in response to the Christian speaker known for his healing powers. These results support recent observations that social categories can modulate the frontal executive network in opposite directions corresponding to the cognitive load they impose on the executive system.

So when listening to speech from a belief system we don’t already believe, we engaged our executive function. When listening to speech from within our existing belief system, we suppressed our executive function.

In regards to the current study, is something similar going on? Does processing the emotional content of stories impair our processing of factual information, which is a benefit for weak facts but actually a detriment to the persuasive power of strong facts that are persuasive on their own?

Another potential explanation occurs to me, however (showing how difficult it can be to interpret the results of psychological research like this). It is a reasonable premise that a strong fact is more persuasive on it’s own than a weak fact – being able to survive a 3 foot fall is not as impressive as a 30 foot fall. But, the more impressive fact may also trigger more skepticism. I may simply not believe that a phone could survive such a fall. If that fact, however, is presented in a straightforward fashion, it may seem somewhat credible. If it is presented as part of a story that is clearly meant to persuade me, then that might trigger more skepticism. In fact, doing so is inherently sketchy. The strong fact is impressive on its own, why are you trying to persuade me with this unnecessary personal story – unless the fact is BS.There is also research to support this hypothesis. When a documentary about a fringe topic, like UFOs, includes the claim that, “This is true,” that actually triggers more skepticism. It encourages the audience to think, “Wait a minute, is this true?” Meanwhile, including a scientists who says, “This is not true,” may actually increase belief, because the audience is impressed that the subject is being taken serious by a scientist, regardless of their ultimate conclusion. But the extent of such backfire effects remains controversial in psychological research – it appears to be very context dependent.

I would summarize all this by saying that – we can identify psychological effects that relate to belief and skepticism. However, there are many potential effects that can be triggered in different situations, and interact in often complex and unpredictable ways. So even when we identify a real effect, such as the persuasive power of stories, it doesn’t predict what will happen in every case. In fact, the net statistical effect may disappear or even reverse in certain contexts, because it is either neutralized or overwhelmed by another effect. I think that is what is happening here.

What do you do when you are trying to be persuasive, then? The answer has to be – it depends? Who is your audience? What claims or facts are you trying to get across? What is the ultimate goal of the persuasion (public service, education, political activism, marketing)? I don’t think we can generate any solid algorithm, but we do have some guiding rules of thumb.

First, know your audience, or at least those you are trying to persuade. No message will be persuasive to everyone.

If the facts are impressive on their own, let them speak for themselves. Perhaps put them into a little context, but don’t try to wrap them up in an emotional story. That may backfire.

Depending on context, your goal may be to not just provide facts, but to persuade your audience to reject a current narrative for a better one. In this case the research suggests you should both argue against the current narrative, and provide a replacement that provides an explanatory model.

So you can’t just debunk a myth, conspiracy theory, or misconception. You need to provide the audience with another way to make sense of their world.

When possible find common ground. Start with the premises that you think most reasonable people will agree with, then build from there.

Now, it’s not my goal to outline how to convince people of things that are not true, or that are subjective but in your personal interest. That’s not what this blog is about. I am only interested in persuading people to portion their belief to the logic and evidence. So I am not going to recommend ways to avoid triggering skepticism – I want to trigger skepticism. I just want it to be skepticism based on science and critical thinking, not emotional or partisan denial, nihilism, cynicism, or just being contrarian.

You also have to recognize that it can be difficult to persuade people. This is especially true if your message is constrained by facts and reality. Sometimes the real information is not optimized for emotional appeal, and it has to compete against messages that are so optimized (and are unconstrained by reality). But at least know the science about how people process information and form their beliefs is useful.

Postscript:  Hans Rosling demonstrates how to use data to tell the story of our rising civilization.

Bottom Line:  When it comes to science, the rule is to follow the facts.  When the story is contradicted by new facts, the story changes to fit the facts, not the other way around.

See also:  Data, Facts and Information

Yes, Global Warming is a matter of opinion in Canada

Canada Survey Mostly Human

The map above shows the results of a survey in 2015 to measure the distribution of public opinion regarding global warming.  A previous post is reprinted below explaining the methods.  This post is about the media ruckus due to Elections Canada reminding environmental activists that climate advocacy during the upcoming Parlimentary campaign could be partisan politicking.  From the Star:

Ghislain Desjardins, a spokesman for Elections Canada, confirmed in an interview with me on Monday that yes, environmental groups were warned in a recent webinar that what they see as a fact — climate change — could become seen as a matter of mere belief in the heat of an election campaign. That’s a real possibility, since Bernier has used social media to muse along those lines in the past.

Elections Canada stresses that no one is gagging the environmentalists from stating the facts on climate change before or during the campaign. But if the existence of climate change becomes an election issue, some charities will have to be very careful about what they say in any advertising. Otherwise, they may be forced to register as “third parties” in the campaign, which could put their charitable status at risk.

Beliefs, however, aren’t the same as facts. That distinction is going to be important, if not crucial in this fall’s campaign — on climate change, but also on potentially hot topics such as immigration or refugee policy.

Thanks to Elections Canada and a warning it recently delivered to environmental activists, we’re seeing just how shaky the ground may get between facts and beliefs when the official campaign gets under way in a few weeks.

As the map above shows, it is a minority in most of Canada thinking that the earth is warming due mostly to human activity.  Below is a post explaining how this finding was obtained.

Update August 20, 2019

See also Lorrie Goldstein writing in Toronto Sun For climate alarmists ‘free speech’ exists only for them
Ironically, in 2015 the environmental charity, Ecojustice, urged Canada’s Competition Bureau, on behalf of six “prominent” Canadians, including former Ontario NDP leader and UN ambassador Stephen Lewis, to investigate Friends of Science, the International Climate Science Coalition and the Heartland Institute for climate denial.

A woman walks past a map showing the elevation of the sea in the last 22 years during the World Climate Change Conference 2015 near Paris. A new study asked 5,000 Canadians their opinions on the cause of climate change. (Stephane Mahe/Reuters)

As a Canadian living near Montreal, I was of course curious about this survey:
The distribution of climate change public opinion in Canada
Mildenberger et al. 2015 (here)

CBC created some controversy by switching headlines on its report of the findings.
First the title was:
Climate change: Majority of Canadians don’t believe it’s caused by humans
Then it changed to:
Canadians divided over human role in climate change, study suggests

I’m wondering what really was learned from this survey.

What Was Asked and Answered

With any survey, it is important to look at the actual questions asked and answered. While we do not have access to specific responses, the script for the telephone interviews is available. The first two questions asked about global warming (not climate change).

Survey Questionnaire

1. “From what you’ve read and heard, is there solid evidence that the average temperature on earth has been getting warmer over the past four decades?”
Yes
No
Don’t Know (volunteered)

2. [If yes, solid evidence] “Is the earth getting warmer mostly because of human activity such as burning fossil fuels or mostly because of natural patterns in the earth’s environment?”

Human Activity
Natural Patterns
Combination (volunteered)
Not sure / Refused (volunteered)

The finding reported in the Study:

Our results reveal, for the first time, the enormous diversity of Canadian climate and energy opinions at the local level.

At the national level, 79% of Canadians believe climate change is happening but only 44% think climate change is caused mostly by human activities.

So the 79% who said there’s solid evidence of warming the last 40 years got a followup question: mostly caused by human activity or mostly natural? Slightly more than half said mostly human, thus a result of 44% believing both that it is warming and that humans are mostly to blame.

Now some people were unwilling to decide between mostly human and mostly natural, and volunteered that it was a combination. This fraction of respondents was recorded as partially human caused, and they added 17% to bring the number up to 61%. The remaining 39% combines people who don’t accept evidence on warming and those who think warming is mostly natural or are uncertain about both issues.

From having done opinion surveys in the past, I suspect that many who were uncertain between human or natural causes didn’t want to say “don’t know”, and instead said it was a “combination”. Thus the group counted as “partially human-caused” is a soft number.

My suspicions are reinforced by a question that was asked and not included in this report: “How much do you feel you know about global warming?” Typically about 25% say they know a lot, 60% say they know a little, and the rest less than a little. As we know from other researchers more climate knowledge increases skepticism for many, so it is likely the soft number includes many who feel they really don’t know.

This process does determine a survey result about the size of the population who believes warming is happening and mostly caused by humans.  Everything else is subject to interpretation, including how much is due to land use, urbanization or fossil fuel emissions.  The solid finding is displayed in the diagram below:

Canada Survey Mostly HumanYes, the map shows I am living in a hotbed of global warming believers around Montreal; well, it is 55%, as high as it gets in Canada.

Responses on Carbon Pricing
Now consider the script for the last two questions on policy options

3. “There is a proposed system called cap and trade where the government issues permits limiting the amount of greenhouse gases companies can put out. If a company exceeds their limit, they will have to buy more permits. If they don’t use all of their permits, they will be able to sell or trade them to others who exceed their cap. The idea is that companies will find ways to put out less greenhouse gases because that would be cheaper than buying permits.

Do you strongly support, somewhat support, somewhat oppose or strongly oppose this type of system for your province?”

Strongly support
Somewhat support
Somewhat oppose
Strongly oppose
Not sure / Refused (volunteered)

4. “Another way to lower greenhouse gas emissions is to increase taxes on carbon based fuels such as coal, oil, gasoline and natural gas. Do you strongly support, somewhat support, somewhat oppose or strongly oppose this type of system?”

Strongly support
Somewhat support
Somewhat oppose
Strongly oppose
Not sure / Refused (volunteered)

And the finding is (from the report):
Despite this variation in core beliefs about climate change, we find widespread public support for climate policies. Support is greatest and most consistent for emissions trading. . . The overall pattern is clear: there is majority support for emissions trading in every Canadian district.

We find larger variation in support for a carbon tax across the country. At the national level, support for carbon taxation at 49% is just below a majority, with opposition at 44%.

Now here is the underlying motivation for the survey: to determine the level of support in the Canadian population for government action to increase the price of carbon-based energy. Not surprisingly, people who mostly know only a little about this like the sound of companies footing the bill for policies, more than the government raising my taxes. With a little more knowledge they will understand that cap and trade increases the cost of energy within all of the products and services they use, and therefore raises the price of pretty much everything. It is a hidden tax completely without accountability.

I described in some detail how this is already at work in Quebec by virtue of the province joining California’s carbon market: https://rclutz.wordpress.com/2015/04/15/quebec-joins-california-carbon-market/

Conclusion

No one should be surprised that those conducting this survey think they know the correct answers and want the population to agree with them. The sponsors include numerous organizations advocating for carbon pricing:

Thanks to the Social Sciences and Humanities Research Council of Canada, the Fonds de Recherche du Québec – Société et Culture, the Skoll Global Threats Fund, the Energy Foundation, and the Grantham Foundation for the Protection of the Environment for financial support. Funding for individual survey waves was provided by the Ministère des Relations internationales et de la Francophonie, the Public Policy Forum, Sustainable Prosperity, Canada 2020, l’Institut de l’énergie Trottier and la Chaire d’études politiques et économiques américaines.

And as we have seen with virtually all marketing-type surveys, opinion-makers know that conducting surveys is itself an intervention to raise awareness and concern about the issue.

Footnote:

Partiicipants were asked in 2015: “From what you’ve read and heard, is there solid evidence that the average temperature on earth has been getting warmer over the past four decades?”

uah-lo-since-1995

Looks to me that the evidence for warming in the first 20 years was solid, but the evidence since 1995 is not.

Global Virtue Replaces Local Accountability

Victor Davis Hanson writes at American Greatness Cosmic Injustice. The article comprises an extensive list of political escape artists, who raise abstract global concerns to distract from their incompetence facing real local problems and suffering. Excerpts in italics with my bolds.

Politicians ignore felonies in their midst, preferring to hector the misdemeanors of the universe

One of the weirdest characteristics of our global politicians and moral censors is their preference to voice cosmic justice rather than to address less abstract sin within their own purview or authority. These progressive virtue mongers see themselves as citizens of the world rather than of the United States and thus can impotently theorize about problems elsewhere when they cannot solve those in their own midst.

Mayors Preach Empathy While NYC Deteriorates

Big-city mayors are especially culpable when it comes to ignoring felonies in their midst, preferring to hector the misdemeanors of the universe. Notice how New York Mayor Bill De Blasio lords over the insidious deterioration of his city while he lectures on cosmic white supremacy.

Mayor Michael Bloomberg used to sermonize to the nation about gun-control, global warming, the perils of super-sized soft drinks, smoking, and fatty-foods in his efforts to virtue signal his moral fides—even as his New York was nearly paralyzed by the 2010 blizzard that trapped millions of his city’s residents in their homes due to inept and incompetent city efforts to remove snow. Or is the “Bloomberg syndrome” worse than that—in the sense that sounding saintly in theory psychologically compensates for being powerless in fact? Or is it a fashion tic of the privileged to show abstract empathy?

Governor Schwarzenegger Goes Green While California Goes Down

In the last years of Arnold Schwarzenegger’s governorship, Arnold more or less gave up on the existential crises of illegal immigration, sanctuary cities, soaring taxes, water shortages, decrepit roads and bridges, homelessness, plummeting public school performance, and a huge exodus out of state of middle-class Californians.

Instead he began to lecture the state, the nation, and indeed the world on the need for massive wind and solar projects and assorted green fantasies. His old enemies, jubilant that they had aborted his early conservative reform agenda, began to praise him both for his green irrelevancies and for his neutered conservatism—to the delight of the outgoing Arnold who was recalibrating his return to celebrity Hollywood.

Where Were the Sheriffs When Shooters Came

More recently, we often see how local sheriffs become media-created philosophers eager to blame supposed national bogeymen for mass shootings in their jurisdictions— killings that sometimes are at least exacerbated by the utter incompetence of local law enforcement chiefs.

Do we remember the horrific 2011 Tucson shooter, the mass-murdering ghoul who mowed down 19 people, killing six and severely wounding Representative Gabby Giffords (D-Ariz.)? Pima County Sheriff Clarence W. Dupnik, without any evidence, immediately claimed that conservative anti-government hate speech had set off the unhinged shooter.

One might have thought from Dupnik’s loud blame-game commentary that supposed outgunned deputies on duty had shot it out with the killer in a running gun battle, and that he was furious that talk radio or right-wingers had somehow impeded him from getting enough bullets or guns to his men to protect the victims from such a right-wing ideologue.

Hardly. This shooter had devoured both the Communist Manifesto and Mein Kampf. He was mentally unstable, drug addled, and without coherent views on contemporary issues, and thus no foot soldier in some vast right-wing conspiracy or any other conspiracy. He was certainly less connected to the Right than the Washington, D.C. shooter who tried to take out much of the Republican House leadership in 2017 was connected to the Left.

Again, no matter. The ubiquitous Dupnik in his efforts to translate his own incompetence and failure to secure the area where Giffords was to speak into media-driven celebrity, in cheap fashion blasted the Tea Party, critics of President Obama, and, of course, Rush Limbaugh as the culprits.

In truth, security in the supermarket parking lot where Giffords and others were shot was nearly nonexistent, a fact Dupnik never really addressed. He seemed unworried that he had not sent out deputies to ensure a U.S. congresswoman’s safety while conducting an open-air meeting with her constituents.

Florida Sheriff Scott Israel sought national media attention for trying to connect the horrific Parkland Florida mass shooting at Marjory Stoneman Douglas High School (17 dead), which took place in his jurisdiction, to the National Rifle Association and Republican politicians in general. But it was Israel’s own Broward County Sheriff’s Office that responded slowly to the killings. In some cases, Israel’s officers exhibited timidity and refused to enter the building to confront the deranged mass shooter.

Before Israel lectured an international television audience on the evils of lax gun laws he might have at least ensured that his own sheriffs were willing to risk their lives to protect the endangered innocent.

Dot-Com Wealthy Live High Above the Disasters on Their Doorsteps

If we sometimes wonder why for years saintly Apple, Facebook, and Google have thrived in a sea of homelessness, amid pot-holed streets lined with strapped employees living in their cars, a good indication might be that the cosmic social justice so often voiced as penance by their woke multibillionaire bosses exempts them from worrying about the disasters in their midst.

Pope Francis Calls for Open Borders from Behind Vatican Walls

Pope Francis recently lambasted a number of European countries and leaders for their apparent efforts to secure their national borders against massive illegal immigration from North Africa and the Middle East. Francis plugged European ecumenicalism and seemed to dismiss the populist and nationalist pushback of millions of Europeans, who see the EU as both anti-democratic and a peril to their own traditions and freedoms as citizens.

However, before Francis chastised the continent for its moral failings, he might have explained to Italians or Greeks worried over their open borders why the Vatican enjoys massive walls to keep the uninvited out and yet why other European countries should not emulate the nation-state Vatican’s successful preemptive fortifications.

Better yet, the pope might have taken a more forceful stance against the decades-long and ongoing legal dilemmas of hundreds of global Catholic Clergy, who have proven to be pedophiles and yet were not turned over to law enforcement. The cosmic idea of a United Europe is easy to preach about, but reining in what is likely an epidemic of child-molesting clergy is messy. Francis’s frequent abstract moralizing is quite at odds with either his inability or unwillingness to reform pathways to the priesthood, some of whose members have ruined thousands of lives.

Politicians Unwilling to Address Concrete Crises

What was lacking in the recent Democratic debates were concrete answers to real problems—as opposed to candidates’ nonstop cosmic virtue signaling. It is easy to blast “white supremacy” and “the gun culture” from a rostrum. But no one on stage seemed to care about the great challenge of our age, the inner-city carnage that takes thousands of young African-American lives each year. The inner-city murdering is tragically almost exclusively a black-on-black phenomenon (even rare interracial homicides are disproportionally committed by African-Americans) that occurs in progressive-run cities with strict gun control laws.

When leaders virtue signal about global or cosmic sin, it is often proof they have no willingness or power to address any concrete crisis. The public tires of such empty platitudes because they also see the culpable trying to divert attention from their own earthly failure by loudly appealing to a higher moral universe.

More mundanely, there is the role of hypocrisy: elites themselves never suffer the consequences of their own ethical inaction while the public never sees any benefit from their moral rhetoric. Illegal immigration is not a personal issue for Pope Francis, and most Europeans have more concrete things to worry about than lectures on populism and nationalism.

Disconnected from Real World Dangers

In the same fashion, New Yorkers in 2011 were worried more about the piles of snow on the sidewalks than they felt threatened by 32-ounce Cokes—while realizing that no snow blocked either the Bloomberg official or private residence.

Note a recent inexplicable Zogby poll that indicated 51 percent of blacks and Hispanics might support Donald Trump. How would such a supposedly counterintuitive result even be possible?

I have a suggestion: minority communities live first-hand with the violence and dangers of the gang gun culture. More policing and incarceration of guilty felons improve their lives. Secure borders mean fewer drug dealers and cartel smugglers in local communities, fewer schools swamped with non-English speakers, and social services not overwhelmed with impoverished non-Americans.

These can all be real concerns for beleaguered minorities. Yet they are virtue-signaled away by progressive elites whose own power and money allow them to navigate around the consequences of their own liberal fantasies that fall on distant others.

Add in a booming economy, rising incomes, and low unemployment for minorities, and the world of shrill yelling on the debate stage about “white privilege” seems some sort of an irrelevant fixation of the elite and privileged, akin to showing off a Gucci bag or Porsche Cayenne—but otherwise nothing to do with dangerous streets, wrecked schools, whizzing bullets, and social services that are becoming inoperative.

The next time a legislator, mayor, or governor rails about plastic straws or the Paris Climate Accord, be assured that his state’s roads are clogged, his public schools failing—and he is clueless or indifferent about it.

Too Many People, or Too Few?

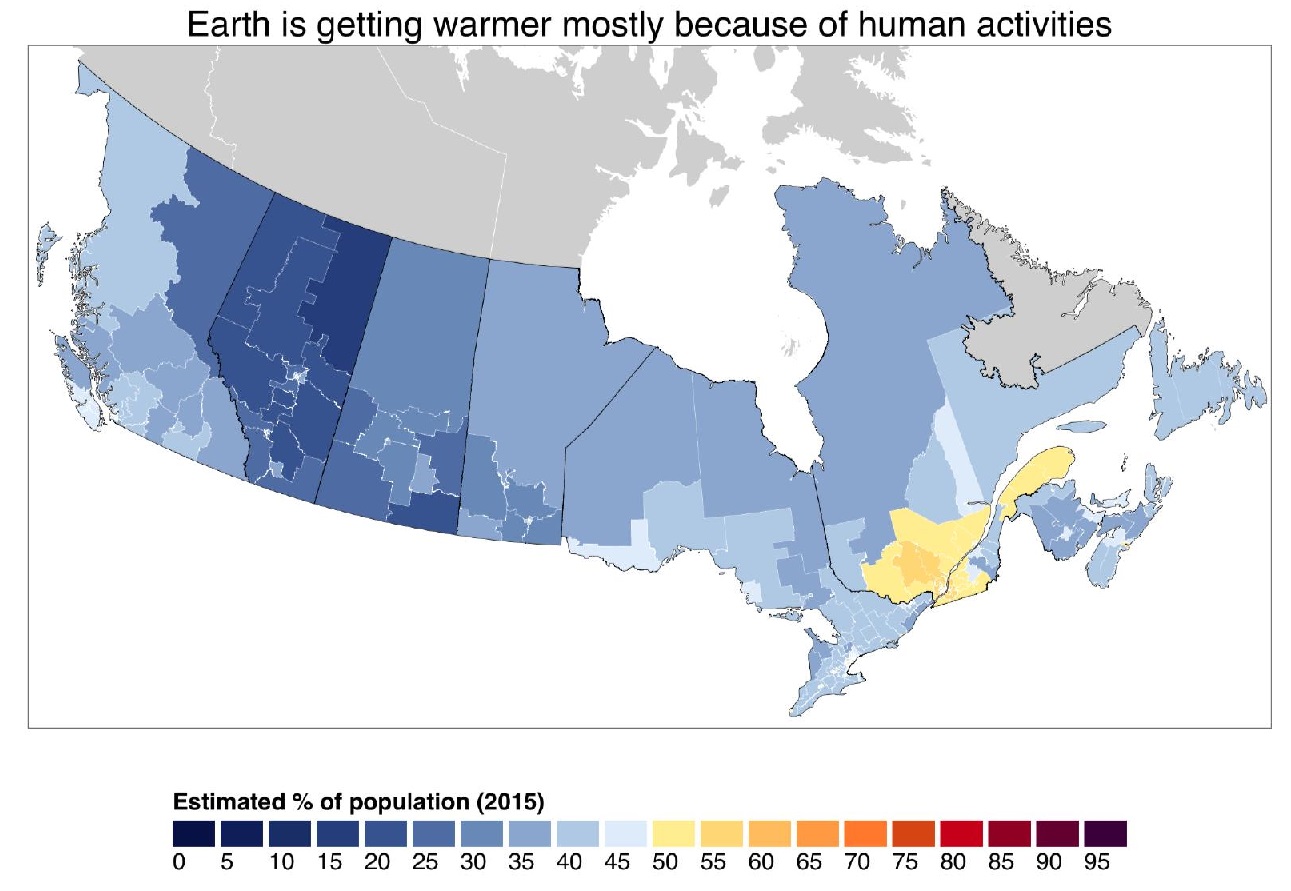
A placard outside the UN headquarters in New York City, November 2011

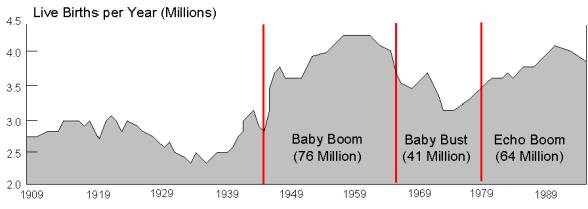
Some years ago I read the book Boom, Bust and Echo. It described how planners for public institutions like schools and hospitals often fail to anticipate demographic shifts. The authors described how in North America, the baby Boom after WWII overcrowded schools, and governments struggled to build and staff more facilities. Just as they were catching up came the sexual revolution and the drop in fertility rates, resulting in a population Bust in children entering the education system. Now the issue was to close schools and retire teachers due to overcapacity, not easy to do with sentimental attachments. Then as the downsizing took hold came the Echo. Baby boomers began bearing children, and even at a lower birth rate, it still meant an increased cohort of students arriving at a diminished system.

The story is similar to what is happening today with world population. Zachary Karabell writes in Foreign Affairs The Population Bust: Demographic Decline and the End of Capitalism as We Know It. Excerpts in italics with my bolds.

For most of human history, the world’s population grew so slowly that for most people alive, it would have felt static. Between the year 1 and 1700, the human population went from about 200 million to about 600 million; by 1800, it had barely hit one billion. Then, the population exploded, first in the United Kingdom and the United States, next in much of the rest of Europe, and eventually in Asia. By the late 1920s, it had hit two billion. It reached three billion around 1960 and then four billion around 1975. It has nearly doubled since then. There are now some 7.6 billion people living on the planet.

Just as much of the world has come to see rapid population growth as normal and expected, the trends are shifting again, this time into reverse. Most parts of the world are witnessing sharp and sudden contractions in either birthrates or absolute population. The only thing preventing the population in many countries from shrinking more quickly is that death rates are also falling, because people everywhere are living longer. These oscillations are not easy for any society to manage. “Rapid population acceleration and deceleration send shockwaves around the world wherever they occur and have shaped history in ways that are rarely appreciated,” the demographer Paul Morland writes in The Human Tide, his new history of demographics. Morland does not quite believe that “demography is destiny,” as the old adage mistakenly attributed to the French philosopher Auguste Comte would have it. Nor do Darrell Bricker and John Ibbitson, the authors of Empty Planet, a new book on the rapidly shifting demographics of the twenty-first century. But demographics are clearly part of destiny. If their role first in the rise of the West and now in the rise of the rest has been underappreciated, the potential consequences of plateauing and then shrinking populations in the decades ahead are almost wholly ignored.

The mismatch between expectations of a rapidly growing global population (and all the attendant effects on climate, capitalism, and geopolitics) and the reality of both slowing growth rates and absolute contraction is so great that it will pose a considerable threat in the decades ahead. Governments worldwide have evolved to meet the challenge of managing more people, not fewer and not older. Capitalism as a system is particularly vulnerable to a world of less population expansion; a significant portion of the economic growth that has driven capitalism over the past several centuries may have been simply a derivative of more people and younger people consuming more stuff. If the world ahead has fewer people, will there be any real economic growth? We are not only unprepared to answer that question; we are not even starting to ask it.

BOMB OR BUST?
At the heart of The Human Tide and Empty Planet, as well as demography in general, is the odd yet compelling work of the eighteenth-century British scholar Thomas Malthus. Malthus’ 1798 Essay on the Principle of Population argued that growing numbers of people were a looming threat to social and political stability. He was convinced that humans were destined to produce more people than the world could feed, dooming most of society to suffer from food scarcity while the very rich made sure their needs were met. In Malthus’ dire view, that would lead to starvation, privation, and war, which would eventually lead to population contraction, and then the depressing cycle would begin again.

Yet just as Malthus reached his conclusions, the world changed. Increased crop yields, improvements in sanitation, and accelerated urbanization led not to an endless cycle of impoverishment and contraction but to an explosion of global population in the nineteenth century. Morland provides a rigorous and detailed account of how, in the nineteenth century, global population reached its breakout from millennia of prior human history, during which the population had been stagnant, contracting, or inching forward. He starts with the observation that the population begins to grow rapidly when infant mortality declines. Eventually, fertility falls in response to lower infant mortality—but there is a considerable lag, which explains why societies in the modern world can experience such sharp and extreme surges in population. In other words, while infant mortality is high, women tend to give birth to many children, expecting at least some of them to die before reaching maturity. When infant mortality begins to drop, it takes several generations before fertility does, too. So a woman who gives birth to six children suddenly has six children who survive to adulthood instead of, say, three. Her daughters might also have six children each before the next generation of women adjusts, deciding to have smaller families.

The population bust is going global almost as quickly as the population boom did in the twentieth century.  The burgeoning of global population in the past two centuries followed almost precisely the patterns of industrialization, modernization, and, crucially, urbanization. It started in the United Kingdom at the end of the nineteenth century (hence the concerns of Malthus), before spreading to the United States and then France and Germany. The trend next hit Japan, India, and China and made its way to Latin America. It finally arrived in sub-Saharan Africa, which has seen its population surge thanks to improvements in medicine and sanitation but has not yet enjoyed the full fruits of industrialization and a rapidly growing middle class.

With the population explosion came a new wave of Malthusian fears, epitomized by the 1968 book The Population Bomb, by Paul Ehrlich, a biologist at Stanford University. Ehrlich argued that plummeting death rates had created an untenable situation of too many people who could not be fed or housed. “The battle to feed all of humanity is over,” he wrote. “In the 1970’s the world will undergo famines—hundreds of millions of people are going to starve to death in spite of any crash programs embarked on now.”

Ehrlich’s prophecy, of course, proved wrong, for reasons that Bricker and Ibbitson elegantly chart in Empty Planet. The green revolution, a series of innovations in agriculture that began in the early twentieth century, accelerated such that crop yields expanded to meet humankind’s needs. Moreover, governments around the world managed to remediate the worst effects of pollution and environmental degradation, at least in terms of daily living standards in multiple megacities, such as Beijing, Cairo, Mexico City, and New Delhi. These cities face acute challenges related to depleted water tables and industrial pollution, but there has been no crisis akin to what was anticipated.

Doesn’t anyone want my Green New Deal?

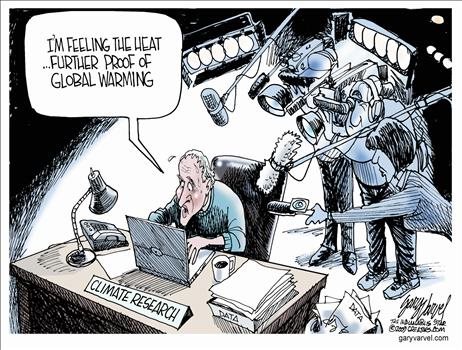
Yet visions of dystopic population bombs remain deeply entrenched, including at the center of global population calculations: in the forecasts routinely issued by the United Nations. Today, the UN predicts that global population will reach nearly ten billion by 2050. Judging from the evidence presented in Morland’s and Bricker and Ibbitson’s books, it seems likely that this estimate is too high, perhaps substantially. It’s not that anyone is purposely inflating the numbers. Governmental and international statistical agencies do not turn on a dime; they use formulas and assumptions that took years to formalize and will take years to alter. Until very recently, the population assumptions built into most models accurately reflected what was happening. But the sudden ebb of both birthrates and absolute population growth has happened too quickly for the models to adjust in real time. As Bricker and Ibbitson explain,

“The UN is employing a faulty model based on assumptions that worked in the past but that may not apply in the future.”

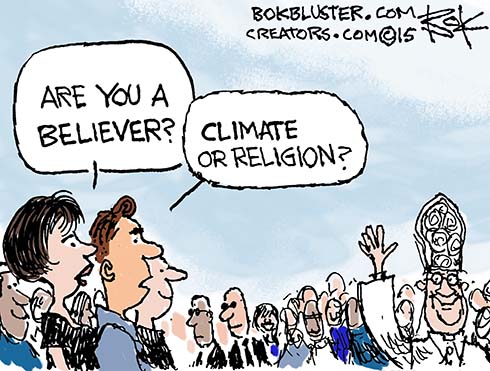
Population expectations aren’t merely of academic interest; they are a key element in how most societies and analysts think about the future of war and conflict. More acutely, they drive fears about climate change and environmental stability—especially as an emerging middle class numbering in the billions demands electricity, food, and all the other accoutrements of modern life and therefore produces more emissions and places greater strain on farms with nutrient-depleted soil and evaporating aquifers. Combined with warming-induced droughts, storms, and shifting weather patterns, these trends would appear to line up for some truly bad times ahead.

Except, argue Bricker and Ibbitson, those numbers and all the doomsday scenarios associated with them are likely wrong. As they write,

“We do not face the challenge of a population bomb but a population bust—a relentless, generation-after-generation culling of the human herd.”

Already, the signs of the coming bust are clear, at least according to the data that Bricker and Ibbitson marshal. Almost every country in Europe now has a fertility rate below the 2.1 births per woman that is needed to maintain a static population. The UN notes that in some European countries, the birthrate has increased in the past decade. But that has merely pushed the overall European birthrate up from 1.5 to 1.6, which means that the population of Europe will still grow older in the coming decades and contract as new births fail to compensate for deaths. That trend is well under way in Japan, whose population has already crested, and in Russia, where the same trends, plus high mortality rates for men, have led to a decline in the population.

What is striking is that the population bust is going global almost as quickly as the population boom did in the twentieth century. Fertility rates in China and India, which together account for nearly 40 percent of the world’s people, are now at or below replacement levels. So, too, are fertility rates in other populous countries, such as Brazil, Malaysia, Mexico, and Thailand. Sub-Saharan Africa remains an outlier in terms of demographics, as do some countries in the Middle East and South Asia, such as Pakistan, but in those places, as well, it is only a matter of time before they catch up, given that more women are becoming educated, more children are surviving their early years, and more people are moving to cities.

Both books note that the demographic collapse could be a bright spot for climate change. Given that carbon emissions are a direct result of more people needing and demanding more stuff—from food and water to cars and entertainment—then it would follow that fewer people would need and demand less. What’s more, larger proportions of the planet will be aging, and the experiences of Japan and the United States are showing that people consume less as they age. A smaller, older population spells some relief from the immense environmental strain of so many people living on one finite globe.

The Reinvention of Chess

That is the plus side of the demographic deflation. Whether the concomitant greening of the world will happen quickly enough to offset the worst-case climate scenarios is an open question—although current trends suggest that if humanity can get through the next 20 to 30 years without irreversibly damaging the ecosystem, the second half of the twenty-first century might be considerably brighter than most now assume.

The downside is that a sudden population contraction will place substantial strain on the global economic system.

Capitalism is, essentially, a system that maximizes more—more output, more goods, and more services. That makes sense, given that it evolved coincidentally with a population surge. The success of capitalism in providing more to more people is undeniable, as are its evident defects in providing every individual with enough. If global population stops expanding and then contracts, capitalism—a system implicitly predicated on ever-burgeoning numbers of people—will likely not be able to thrive in its current form. An aging population will consume more of certain goods, such as health care, but on the whole aging and then decreasing populations will consume less. So much of consumption occurs early in life, as people have children and buy homes, cars, and white goods. That is true not just in the more affluent parts of the world but also in any country that is seeing a middle-class surge.

The future world may be one in which capitalism at best frays and at worst breaks down completely.
But what happens when these trends halt or reverse? Think about the future cost of capital and assumptions of inflation. No capitalist economic system operates on the presumption that there will be zero or negative growth. No one deploys investment capital or loans expecting less tomorrow than today. But in a world of graying and shrinking populations, that is the most likely scenario, as Japan’s aging, graying, and shrinking absolute population now demonstrates. A world of zero to negative population growth is likely to be a world of zero to negative economic growth, because fewer and older people consume less. There is nothing inherently problematic about that, except for the fact that it will completely upend existing financial and economic systems. The future world may be one of enough food and abundant material goods relative to the population; it may also be one in which capitalism at best frays and at worst breaks down completely.

The global financial system is already exceedingly fragile, as evidenced by the 2008 financial crisis. A world with negative economic growth, industrial capacity in excess of what is needed, and trillions of dollars expecting returns when none is forthcoming could spell a series of financial crises. It could even spell the death of capitalism as we know it. As growth grinds to a halt, people may well start demanding a new and different economic system. Add in the effects of automation and artificial intelligence, which are already making millions of jobs redundant, and the result is likely a future in which capitalism is increasingly passé.

If population contraction were acknowledged as the most likely future, one could imagine policies that might preserve and even invigorate the basic contours of capitalism by setting much lower expectations of future returns and focusing society on reducing costs (which technology is already doing) rather than maximizing output.

But those policies would likely be met in the short term by furious opposition from business interests, policymakers, and governments, all of whom would claim that such attitudes are defeatist and could spell an end not just to growth but to prosperity and high standards of living, too. In the absence of such policies, the danger of the coming shift will be compounded by a complete failure to plan for it.

Different countries will reach the breaking point at different times. Right now, the demographic deflation is happening in rich societies that are able to bear the costs of slower or negative growth using the accumulated store of wealth that has been built up over generations. Some societies, such as the United States and Canada, are able to temporarily offset declining population with immigration, although soon, there won’t be enough immigrants left. As for the billions of people in the developing world, the hope is that they become rich before they become old. The alternative is not likely to be pretty: without sufficient per capita affluence, it will be extremely difficult for developing countries to support aging populations.

So the demographic future could end up being a glass half full, by ameliorating the worst effects of climate change and resource depletion, or a glass half empty, by ending capitalism as we know it. Either way, the reversal of population trends is a paradigm shift of the first order and one that is almost completely unrecognized. We are vaguely prepared for a world of more people; we are utterly unprepared for a world of fewer. That is our future, and we are heading there fast.

See also Control Population, Control the Climate. Not.

On Stable Electric Power: What You Need to Know

electric-power-system

nzrobin commented on my previous post Big Wind Blacklisted   that he had more to add.  So this post provides excerpts from a 7 part series Anthony wrote at kiwithinker on Electric Power System Stability. Excerpts are in italics with my bolds to encourage you to go read the series of posts at kiwithinker.

1. Electrical Grid Stability is achieved by applying engineering concepts of power generation and grids.

Some types of generation provide grid stability, other types undermine it. Grid stability is an essential requirement for a power supply reliability and security. However there is insufficient understanding of what grid stability is and the risk that exists if stability is undermined to the point of collapse. Increasing grid instability will lead to power outages. The stakes are very high.

2.Electric current is generated ‘on demand’. There is no stored electric current in the grid.

The three fundamental parts of a power system are:

its generators, which make the power,
its loads, which use the power, and
its grid, which connects them together.

The electric current delivered when you turn on a switch is generated from the instant you operate the switch. There is no store of electric current in the grid. Only certain generators can provide this instant ‘service’.

So if there is no storage in the grid the amount of electric power being put into the grid has to very closely match that taken out. If not, voltage and frequency will move outside of safe margins, and if the imbalance is not corrected very quickly it will lead to voltage and frequency excursions resulting in damage or outages, or both.

3. A stable power system is one that continuously responds and compensates for power/ frequency disturbances, and completes the required adjustments within an acceptable timeframe to adequately compensate for the power/frequency disturbances.

Voltage is an important performance indicator and it should of course be kept within acceptable tolerances. However voltage excursions tend to be reasonably local events. So while voltage excursions can happen from place to place and they cause damage and disruption, it turns out that voltage alone is not the main ‘system wide’ stability indicator.

The key performance indicator of an acceptably stable power system is its frequency being within a close margin from its target value, typically within 0.5 Hz from either 50 Hz or 60 Hz, and importantly, the rise and fall rate of frequency deviations need to be managed to achieve that narrow window.

An increasing frequency indicates more power is entering the system than is being taken out. Likewise, a reducing frequency indicates more is being taken out than is entering. For a power supply system to be stable it is necessary to control the frequency. Control systems continuously observe the frequency, and the rate of change of the frequency. The systems control generator outputs up or down to restore the frequency to the target window.

Of course energy imbalances of varying size are occurring all the time. Every moment of every day the load is continuously changing, generally following a daily load curve. These changes tend to be gradual and lead to a small rate of change of frequency. Now and then however faults occur. Large power imbalances mean a proportionately faster frequency change occurs, and consequently the response has to be bigger and faster, typically within two or three seconds if stability is to be maintained. If not – in a couple blinks of an eye the power is off – across the whole grid.

If the system can cope with the range of disturbances thrown at it, it is described as ‘stable’. If it cannot cope with the disturbances it is described as ‘unstable’.

4.There are two main types of alternating current machines used for the generation of electricity; synchronous and asynchronous. The difference between them begins with the way the magnetic field of the rotor interacts with the stator. Both types of machine can be used as either a generator or motor.

There are two key differences affecting their contribution to stability.

The kinetic energy of the synchronous machine’s rotor is closely coupled to the power system and therefore available for immediate conversion to power. The rotor kinetic energy of the asynchronous machine is decoupled from the system by virtue of its slip and is therefore not easily available to the system.

Synchronous generators are controllable by governors which monitor system frequency and adjust prime mover input to bring correction to frequency movements. Asynchronous generators are typically used in applications where the energy source is not controllable, eg: wind turbines. These generators cannot respond to frequency movements representing a system energy imbalance. They are instead a cause of energy imbalance.

Short -term stability

The spinning kinetic energy in the rotors of the synchronous machines is measured in megawatt seconds. Synchronous machines provide stability under power system imbalances because the kinetic energy of their rotors (and prime movers) is locked in synchronism with the grid through the magnetic field between the rotor and the stator. The provision of this energy is essential to short duration stability of the power system.

Longer-term stability

Longer term stability is managed by governor controls. These devices monitor system frequency (recall that the rate of system frequency change is proportional to energy imbalance) and automatically adjust machine power output to compensate for the imbalance and restore stability.

5.For a given level of power imbalance the rate of rise and fall of system frequency is directly dependent on synchronously connected angular momentum.

The rotational form of Newton’s second law of motion; Force = Mass * Acceleration describes the power flow between the rotating inertia (rotational kinetic energy) of a synchronous generator and the power system. It applies for the first few seconds after the onset of a disturbance, i.e.: before the governor and prime mover have had opportunity to adjust the input power to the generator.

Pm – Pe = M * dw/dt

Pm is the mechanical power being applied to the rotor by the prime mover. We consider this is a constant for the few seconds that we are considering.

Pe is the electrical power being taken from the machine. This is variable.

M is the angular momentum of the rotor and the directly connected prime mover. We can also consider M a constant, although strictly speaking it isn’t constant because it depends on w. However as w is held within a small window, M does not vary more than a percent or so.

dw/dt is the rate of change of rotor speed, which relates directly to the rate of increasing or reducing frequency.

The machine is in equilibrium when Pm = Pe. This results in dw/dt being 0, which represents the rotor spinning at a constant speed. The frequency is constant.

When electrical load has been lost Pe is less than Pm and the machine will accelerate resulting in increasing frequency. Alternatively when electrical load is added Pe is greater than Pm the machine will slow down resulting in reducing frequency.

Here’s the key point, for a given level of power imbalance the rate of rise and fall of system frequency is directly dependent on synchronously connected angular momentum, M.

It should now be clear how central a role that synchronously connected angular momentum plays in power system stability. It is the factor that determines how much time generator governors and automatic load shedding systems have to respond to the power flow variation and bring correction.


6 .Generation Follows Demand. The machine governor acts in the system as a feedback controller. The governor’s purpose is to sense the shaft rotational speed, and the rate of speed increase /decrease, and to adjust machine input via a gate control.

The governor’s job is to continuously monitor the rotational speed w of the shaft and the rate of change of shaft speed dw/dt and to control the gate(s) to the prime mover. In the example below, a hydro turbine, the control applied is to adjust the flow of water into the turbine, and increasing or reducing the mechanical power Pm compensate for the increase or reduction in electrical load, ie: to approach equilibrium.

It should be pointed out that while the control systems aim for equilibrium, true equilibrium is never actually achieved. Disturbances are always happening and they have to compensated for continuously, every second of every minute of every hour, 24 hours a day, 365 days a year, year after year.

The discussion has been for a single synchronous generator, whereas of course the grid has hundreds of generators. In order for each governor controlled generator to respond fairly and proportionately to a network power imbalance, governor control is implemented with what is called a ‘droop characteristic’. Without a droop characteristic, governor controlled generators would fight each other each trying to control the frequency to its own setting. A droop characteristic provides a controlled increase in generator output, in inverse proportion to a small drop in frequency.

In New Zealand the normal operational frequency band is 49.8 to 50.2 Hz. An under frequency event is an event where the frequency drops to 49.25 Hz. It is the generators controlled by governors with a droop characteristic that pick up the load increase and thereby maintain stability. If it happens that the event is large and the governor response is insufficient to arrest the falling frequency, under frequency load shedding relays turn off load.

Here is a record of an under frequency event earlier this month, where a power station tripped.

The generator tripped at point A which started the frequency drop. The rate of drop dw/dt is determined by size of the power imbalance divided by the synchronous angular momentum (Pm – Pe)/M. In only 6 seconds the frequency drop was arrested at point B by other governor controlled generators and under frequency load shedding, and in about 6 further seconds additional power is generated, once again under the control of governors, and the frequency was restored to normal at point C. The whole event lasting merely 12 seconds.

So why would we care about a mere 12 second dip in frequency of less than 1 Hz. The reason is that without governor action and under frequency load shedding, a mere 12 second dip would instead be a complete power blackout of the North Island of New Zealand.

Local officials standing outside substation Masterton NZ .

7.An under frequency event on the North Island of New Zealand demonstrates how critical is electrical system stability.

The graph below which is based on 5 minute load data from NZ’s System Operator confirms that load shedding occurred. The North Island load can be seen to drop 300 MW, from 3700 MW at 9.50 to 3400 MW at 9.55. The load restoration phase can also be observed from this graph. From 10.15 through 10.40 the shed load is restored in several steps.

The high resolution data that we’ll be looking at more closely was recorded by a meter with power quality and transient disturbance recording capability. It is situated in Masterton, Wairarapa, about 300 km south of the power station that tripped. The meter is triggered to capture frequency excursions below 49.2 Hz. The graph below shows the captured excursion on June 15th. The graph covers a total period of only one minute. It shows the frequency and Masterton substation’s load. I have highlighted and numbered several parts of the frequency curve to help with the discussion.

The first element we’ll look at is element 1 to 2. The grid has just lost 310 MW generation and the frequency is falling. No governors nor load shedding will have responded yet. The frequency falls 0.192 Hz in 0.651 seconds giving a fall rate df/dt of -0.295 Hz/s. From this df/dt result and knowing the lost generation is 310 MW we can derive the system angular momentum M as 1,052 MWs/Hz from -310 = M * -0.295.

It is interesting (and chilling) to calculate how long it would take for blackout to occur if no corrective action is taken to restore system frequency and power balance. 47 Hz is the point where cascade tripping is expected. Most generators cannot operate safely below 47 Hz, and under frequency protection relays disconnect generators to protect them from damage. This sets 47 Hz as the point at which cascade outage and complete grid blackout is likely. A falling frequency of -0.295 Hz/s would only take 10.2 seconds to drop from 50 to 47 Hz. That’s not very long and obviously automated systems are required to arrest the decline. The two common automatic systems that have been in place for decades are governor controlled generators and various levels of load shedding.

The fall arrest between 4 and 5 has been due to automatic load shedding. New Zealand has a number of customers contracted to disconnect load at 49.2 Hz. From these figures we can estimate a net shed load of 214 MW (114 MW + 100 MW).

From 7 to 8 the frequency is increasing with df/dt of 0.111 Hz/s and the system has a surplus of 117 MW of generation. At point 8 the system reached 50 Hz again, but the system then over shoots a little and governor action works to reduce generation to control the overshoot between 8 and 9.

This analysis shows how system inertia, under frequency load shedding and governor action work together to maintain system stability.

Summary: The key points

  • The system needs to be able to maintain stability second by second, every minute, every hour, every day, year after year. Yet when a major disturbance happens, the time available to respond is only a few seconds.
  • This highlights the essential role of system inertia in providing this precious few seconds. System inertia defines the relationship between power imbalance and frequency fall rate. The less inertia the faster the collapse and the less time we have to respond. Nearly all system inertia is provided by synchronous generators.
  • Control of the input power to the generators by governor action is essential to control frequency and power balance, bringing correction to maintain stability. This requires control of prime mover, typically this is only hydro and thermal stations.
  • When the fall rate is too fast for governor response, automatic load shedding can provide a lump of very helpful correction, which the governors later tidy up by fine tuning the response.

Big Wind Blacklisted

What is wrong with wind farms? Let us count the ways.

Dear Congress, stop subsidizing wind like it’s 1999 and let the tax credit expire is written by Richard McCarty at Daily Torch.  Excerpts in italics with my bolds.

Congress created the production tax credit for wind energy in 1992. In other words, wind turbine owners receive a tax credit for each kilowatt hour of electricity their turbines create, whether the electricity is needed or not. The production tax credit was supposed to have expired in 1999; but, instead, Congress has repeatedly extended it. After nearly three decades of propping up the wind industry, it is past time to let the tax credit expire in 2020.

All Congress needs to do is nothing.

Addressing the issue of wind production tax credits, Americans for Limited Government President Rick Manning stated, “Wind energy development is no longer a nascent industry, having grown from 0.7 percent of the grid in 2007 to 6.6 percent in 2018 at 275 billion kWh. The rationale behind the wind production tax credit has always been that it is necessary to attract investors.”

Manning added, “wind energy development has matured to the point where government subsidization of billionaires like Warren Buffett cannot be justified, neither from an energy production standpoint nor a fiscal one. Americans for Limited Government strongly urges Congress to end the Wind Production Tax Credit. The best part is, they only need to do nothing as it expires at the end of the year.”

There are plenty of reasons for ending the tax credit. Here are some of them:

  • Wind energy is unreliable. Wind turbines require winds of six to nine miles per hour to produce electricity; when winds speeds reach approximately 55 miles per hour, turbines shut down to prevent damage to the equipment. Wind turbines also shut down in extremely cold weather.
  • Due to this unreliability, relatively large amounts of backup power capacity must be kept available.
  • Wind energy often requires the construction of costly, new high-voltage transmission lines. This is because some of the best places to generate wind energy are in remote locations far from population centers or offshore.
  • Generating electricity from wind requires much more land than does coal, natural gas, nuclear, or even solar power. According to a 2017 study, generating one megawatt of electricity from coal, natural gas, or nuclear power requires about 12 acres; producing one megawatt of electricity from solar energy requires 43.5 acres; and harnessing wind energy to generate one megawatt of electricity requires 70.6 acres.
  • Wind turbines have a much shorter life span than other energy sources. According to the Department of Energy’s National Renewable Energy Laboratory, the useful life of a wind turbine is 20 years while coal, natural gas, nuclear, and hydroelectric power plants can remain in service for more than 50 years.
  • Wind power’s inefficiencies lead to higher rates for customers.
  • Higher electricity rates can have a chilling effect on the local economy. Increasing electricity rates for businesses makes them less competitive and can result in job losses or reduced investments in businesses.
  • Increasing rates on poor consumers can have an even more negative impact sometimes forcing them to go without heat in the winter or air conditioning in the summer.
  • Wind turbines are a threat to aviators. Wind turbines are a particular concern for crop dusters, who must fly close to the ground to spray crops. Earlier this summer, a crop dusting plane clipped a wind turbine tower and crashed.
  • Wind turbines are deadly for birds and bats, which help control the pest population. Even if bats are not struck by the rotors, some evidence suggests that they may be injured or killed by the sudden drop in air pressure around wind turbines.

Large wind turbines endanger lives, the economy, and the environment. Even after decades of heavy subsidies, the wind industry has failed to solve these problems. For these and other reasons, Congress should finally allow the wind production tax credit to expire.

Richard McCarty is the Director of Research at Americans for Limited Government Foundation.

Update August 16, 2019

nzrobin commented regarding more technical detail about managing grid reliability.  A new post is a synopsis of his series on the subject On Stable Electric Power: What You Need to Know

EU Update: Pipelines and Pipe Dreams

Daniel Markind writes at Forbes The Nord Stream 2 Pipeline And The Dangers Of Moving Too Rashly Toward Renewable Energy. Excerpts in italics with my bolds.

Few Americans likely noticed last week that Denmark refused to grant a permit for finishing construction of the Russian natural gas pipeline Nord Stream 2, but its international significance is enormous. Denmark’s refusal is the latest chapter in a story of how good intentions in fighting climate change go bad. It is a cautionary tale of how a country – in this case, Germanywhile seeking to make itself and its energy use cleaner, more efficient and more self-sufficient, can produce the opposite of all three. As climate change becomes more of an issue in America heading into the 2020 election season, Nord Stream 2 provides a case study of the potential peril we face when our desire to switch as rapidly as possible to cleaner energy overwhelms current scientific, technological, political and economic realities.

The back story of Nord Stream 2 involves the desire of Germany to be the world leader in clean energy. In 2010, Germany embarked on a program called “Energiewende” – meaning literally, energy transition. This was designed to transform the German energy economy from being based on fossil fuels to being based on so-called “renewables”. In practical effect, the German government refused to approve any energy project that did not involve renewable energy. Germany hoped that Energiewende would reduce drastically Germany’s CO2 emissions and also end the country’s reliance on fossil fuels. This would strike a blow both for German energy independence and for the fight against climate change.

It didn’t work. At first the country’s CO2 emissions fell, but Germany never was able to generate enough reliable renewable energy to sustain itself. Instead, partially because it had not properly planned for its energy needs during the transition period to full renewable energy, Germany had to fall back on coal produced in the former Communist Eastern part. Ironically, the renewed reliance on this coal, called “lignite”, only made Germany’s short-term pollution problems worse, as lignite is a peculiarly dirty form of coal. By 2015, despite closing nuclear power plants and preventing new fossil fuel energy investment, Germany’s CO2 emissions started again to increase. They eventually dropped in 2018, but few are confident that decrease will continue.

Worse still, prices for German energy kept soaring, becoming among the highest in Europe. Simultaneously, Germany’s energy needs became more dependent on natural gas from Russia. Mainly for political reasons, Russia hardly is a reliable energy source. It certainly is not an environmentally conscious one. Instead of making Germany more self-reliant and a world clean energy leader, Energiewende actually drove Germany further into the arms of Russia. In addition, it otherwise thwarted Germany’s goal of a rapid renewable energy transition.

Had it been available, a more attractive and environmentally beneficial choice for Germany would have been imports of abundant, readily available, and above all relatively clean natural gas from the Marcellus Shale region of Pennsylvania, Ohio and West Virginia – at least on an interim basis until renewable energy transition could catch up to the political and economic realities. While there is more than enough gas in Appalachia and Northeastern Pennsylvania to export overseas to places like Germany and not delete supplies for domestic usage, American energy politics have prevented the needed pipeline and export infrastructure from being built. Simply put, without approved pipelines, the gas has no way to get from the point of production to ports where it can be shipped overseas. The Philadelphia area, which could be a center for the energy industry and for breaking Russia’s gas energy monopoly on Europe, remains woefully oblivious even of its possibilities.

The result is that instead of having natural gas transported to Germany from a NATO ally that drills and transports using stringent environmental safeguards, Germany now relies on Russia, a country that drills in a sensitive Arctic ecosystem with few environmental limitations. The money that could have gone to American companies, landowners and taxes goes instead to Gazprom, the Russian gas giant.

This still is not the end of the story. Germany receives its natural gas via pipelines that traverse Ukraine, Poland, and the Baltic States. Indeed the revenue to Ukraine for allowing transshipments of gas from Russia to Germany via existing overland pipelines within Ukraine’s borders constitutes over 2% of the total Ukrainian GDP. That mostly will end when Nord Stream 2 becomes operational. Nord Stream 2 will bypass the current overland route. That would largely cut out Ukraine, Poland and the Baltic States – all important United States and Western Europe allies.

Last July at the annual NATO summit, President Trump publicly excoriated German Chancellor Angela Merkel over Nord Stream 2. She rebuffed him, insisting on making her country more susceptible to Russian control while also upsetting other NATO allies. With the Nord Stream 2 pipeline currently 70% built and with the Ukrainian-Russian transshipment contract ending in 2020, it looked like all systems go.

Then Denmark stepped in. One of four countries that needs to approve the Nord Stream 2 pipeline route as it passed through Denmark’s territorial waters in the Baltic Sea, the Danes refused to grant the final permits. They demanded the pipeline be moved farther away from the country. At the least, based on published projections that may even understate the impacts, Denmark’s decision means an additional cost of €740M and an eight month delay, going beyond the end date for the current Ukrainian transit contract. This now will need to be extended, giving some consolation to Ukraine.

Still, Nord Stream 2 likely will be completed eventually, and by the same Europeans who routinely preach the loudest about climate change.

It appears to be a loser in every way a pipeline can.

Nord Stream 2 ties Germany closer to Russia, puts more money in the pockets of Gazprom, increases incentives for Russian President Vladimir Putin to ratchet up his environmentally unsound natural gas drilling in and transporting from the Arctic, gives Russia more ability to blackmail the West using its natural gas weapon, cuts out Western-leaning countries in Eastern Europe from needed revenue, and keeps money and investment out of the United States where it could go via exports from the Marcellus Shale deposits.

As always, reasonable people can argue about the wisdom of building new fossil fuel infrastructure when we hope to switch to renewables. However, given the current state of scientific knowledge and of world affairs, failure to do so also has real world adverse environmental, economic and political consequences.

To anyone serious about renewables and reducing our world-wide carbon footprint, the story of Energiewende and Nord Stream 2 should be studied carefully. Our desire to do something good for the planet cannot overwhelm our common sense and world realities. We must be very clear-eyed about how soon and how efficiently we can, in fact, switch from a carbon based energy infrastructure to one based entirely on renewable resources. The Danes just dealt Nord Stream 2 a temporary setback, but the only real winners from the Nord Stream 2 saga long term will be people in Moscow whose concern for the environment certainly is not equal to those who enacted Energiewende or who fight in the United States to stop oil and gas pipeline construction. This surely is not the result anyone in the West would have desired, nor is it good for the future of the planet.

Daniel Markind is a shareholder at Flaster Greenberg PC who practices in Energy, Real Estate, Corporate, and Aviation Law. He can be reached at daniel.markind@flastergreenberg.com.