New Icebreaker Tanker Opens NSR

Its strong, ultra-lightweight steel reinforced hull makes it the largest commercial ship to receive Arc7 certification and allows it to sail through ice up to 2.1 meters thick.

Alarmist media like the Guardian are claiming this event signals the demise of Arctic ice, when in fact it is a triumph of modern technology over natural challenges.  Headlines are announcing a tanker transited the Northern Sea Route (NSR) without icebreaker escort, neglecting to mention that the vessel in question is an icebreaker that functions as a tanker.

Operated by Sovcomflot on behalf of Total, Novatek, CNPC and the Silk Road Fund, this 300 meter long carrier has a capacity of 172,600 cubic meters of LNG.

From Total Inaugurates the Northern Sea Route with LNG Carrier Christophe de Margerie

It’s on its way! After loading its cargo at the Snøhvit LNG export terminal in Norway, in which Total has an 18.4% interest, the Christophe de Margerie is taking the Northern Sea Route to Boryeong in South Korea, where it will deliver a cargo for Total Gas & Power. It’s the first unescorted merchant LNG vessel ever to take this route, which makes it possible to reach Asia via the Bering Strait in 15 days versus 30 days via the Suez Canal.

This technological feat was made possible through the participation of Total teams to the design of these next-generation LNG carriers. Compilations of technology, they efficiently transport large quantities of LNG year-round, without requiring escort icebreakers during the period from July to November. The Christophe de Margerie is the first of a total of 15 planned LNG carriers that will be gradually deployed.

They have been specially designed for Yamal LNG, a flagship Total project (20%) in northern Russia to develop the giant onshore South Tambey gas and condensate field with the construction of a liquefaction plant. Ultimately, close to 16.5 million tons of LNG a year will transit through the port of Sabetta, built specifically for the project.

Energy companies are planning for ice and are building equipment to deal with it.  It is not evidence of global warming but human ingenuity.

Climate Hype Running Amok

The climate hype machine has switched into overdrive with the release of a draft US climate assessment report.  Read about it with caution, as explained in recent post Impaired Climate Vision.

Meanwhile a good synopsis of wrong-headed thinking about climate is provided by John Stossel in a review of Al Gore’s science fictions (here).  (Excerpts below with my bolds)

John Stossel: Al Gore and me — Don’t believe the hype

I was surprised to discover that Al Gore’s new movie begins with words from me!

While icebergs melt dramatically, Gore plays a clip of me saying, “‘An Inconvenient Truth’ won him an Oscar, yet much of the movie is nonsense. ‘Sea levels may rise 20 feet’ — absurd.” He used this comment from one of my TV shows.

The “20 feet” claim is absurd — one of many hyped claims in his movie.

His second film, “An Inconvenient Sequel,” shows lower Manhattan underwater while Gore intones: “This is global warming!”

My goodness! Stossel doubts Al Gore’s claim, but pictures don’t lie: The 9/11 Memorial is underwater! Gore is right! Stossel is an ignorant fool!

But wait. The pictures were from Superstorm Sandy. Water is pushed ashore during storms, especially “super” storms. But average sea levels haven’t risen much.

Over the past decade, they have risen about 1 inch. But this is not because we burn fossil fuels. Sea levels were rising long before we burned anything. They’ve been rising about an inch per decade for a thousand years.

In his new movie, Gore visits Miami Beach. No storm, but streets are flooded! Proof of catastrophe!

But in a new e-book responding to Gore’s film, climate scientist Roy Spencer points out that flooding in “Miami Beach occurs during high tides called ‘king tides,’ due to the alignment of the Earth, sun and moon. For decades they have been getting worse in low-lying areas of Miami Beach where buildings were being built on reclaimed swampland.”

It’s typical Al Gore scaremongering: Pick a place that floods every year and portray it as evidence of calamity.

Spencer, a former NASA scientist who co-developed the first ways of monitoring global temperatures with satellites, is no climate change “denier.” Neither am I. Climate changes.

Man probably plays a part. But today’s warming is almost certainly not a “crisis.” It’s less of a threat than real crises like malaria, terrorism, America’s coming bankruptcy, etc. Even if increasing carbon dioxide warming the atmosphere were a serious threat, nothing Al Gore and his followers now advocate would make a difference.

“What I am opposed to is misleading people with false climate science claims and alarming them into diverting vast sums of the public’s wealth into expensive energy schemes,” writes Spencer.

Gore does exactly that. He portrays just about every dramatic weather event as proof that humans have changed weather. Watching his films, you’d think that big storms and odd weather never occurred before and that glaciers never melted.

In his first movie, Gore predicted that tornadoes and hurricanes would get worse. They haven’t. Tornado activity is down.

What about those dramatic pictures of collapsing ice shelves?

“As long as snow continues to fall on Antarctica,” writes Spencer, “glaciers and ice shelves will continue to slowly flow downhill to the sea and dramatically break off into the ocean. That is what happens naturally, just as rivers flow naturally to the ocean. It has nothing to do with human activities.”

Gore said summer sea ice in the Arctic would disappear as early as 2014. Nothing like that is close to happening.

Gore’s movie hypes solar power and electric cars but doesn’t mention that taxpayers are forced to subsidize them. Despite the subsidies, electric cars still make up less than 1 percent of the market.

If electric cars do become more popular, Spencer asks, “Where will all of the extra electricity come from? The Brits are already rebelling against existing wind farms.”

I bet most Gore fans have no idea that most American electricity comes from natural gas (33 percent), coal (30 percent) and nuclear reactors (20 percent).

Gore probably doesn’t know that.

I’d like to ask him, but he won’t talk to me. He won’t debate anyone.

Critics liked “An Inconvenient Sequel.” An NPR reviewer called it “a hugely effective lecture.” But viewers were less enthusiastic. On Rotten Tomatoes, my favorite movie guide, they give “Sequel” a “tipped over popcorn bucket” score of 48 percent. Sample reviews: “Dull as can be.” “Faulty info, conflated and exaggerated.”

Clearly, Nobel Prize judges and media critics are bigger fans of big government and scaremongering than the rest of us.

Summary:  Al Gore is Jumping the Shark

“Jumping the shark” is attempting to draw attention to or create publicity for something that is perceived as not warranting the attention, especially something that is believed to be past its peak in quality or relevance. The phrase originated with the TV series “Happy Days” when an episode had Fonzie doing a water ski jump over a shark. The stunt was intended to perk up the ratings, but it marked the show’s low point ahead of its demise.

Judiciary Climate Confusion

On August 8, 2017 a ruling by the DC Court of Appeals was hailed by me as a “gamechanger”, since the text was the most sensible thinking from judges I have seen regarding the climate issue.  More on that decision later on.  Then yesterday we get a ruling from the same court coming down on the opposite, “same old, same old” side.  Looking at the two rulings reveals how the judiciary is struggling with claims of global warming/climate change.  Let’s look at the most recent decision first.

Overview of the August 22 Ruling on Sabal Trail Florida Pipeline Project

Activists won a huge victory when a Washington, D.C. appellate court panel sided with the Sierra Club, saying the federal agency that reviewed the project had made a huge error. In the narrow 2-1 decision, U.S. Circuit Judge Thomas B. Griffith wrote that the Federal Energy Regulatory Commission (FERC) should have considered the impact of the pipeline’s added greenhouse gas emissions.

Though the D.C. judges said there was nothing wrong with FERC’s consideration of the poor, minority residents who live along the pipeline, they did agree the agency failed to estimate the amount of carbon emissions that would be generated by Sabal Trail. (Celebratory language from thinkprogress)

Synopsis of Ruling and Dissenting Opinion

The court document is On Petitions for Review of Orders of the Federal Energy Regulatory Commission  heard by Circuit Judges Rogers, Brown, and Griffith.  Opinion for the Court filed by Circuit Judge GRIFFITH.  Opinion concurring in part and dissenting in part filed by Circuit Judge BROWN. (Excerpts below provide a synopsis, my bolds)

The Case and the Ruling

The three segments of the project have different owners,1 but they share a common purpose: to serve Florida’s growing demand for natural gas and the electric power that natural gas can generate. At present, only two major natural-gas pipelines serve the state, and both are almost at capacity. Two major utilities, Florida Power & Light and Duke Energy Florida, have already committed to buying nearly all the gas the project will be able to transport. Florida Power & Light claims that without this new project, its gas needs will begin to exceed its supply this year. But the project’s developers also indicate that the increased transport of natural gas will make it possible for utilities to retire older, dirtier coal-fired power plants.

Despite these optimistic predictions, the project has drawn opposition from several quarters. Environmental groups fear that increased burning of natural gas will hasten climate change and its potentially catastrophic consequences. Landowners in the pipelines’ path object to the seizure of their property by eminent domain. And communities on the project’s route are concerned that pipeline facilities will be built in low-income and predominantly minority areas already overburdened by industrial polluters.

The Federal Energy Regulatory Commission FERC launched an environmental review of the proposed project in the fall of 2013. The agency understood that it would need to prepare an environmental impact statement (EIS) before approving the project, as the National Environmental Policy Act of 1969 (NEPA) requires for each “major Federal action[] significantly affecting the quality of the human environment.” See 42 U.S.C. § 4332(2)(C). FERC solicited public comment and held thirteen public meetings on the project’s environmental effects, and made limited modifications to the project plan in response to public concerns, before releasing a draft impact statement in September 2015 and a final impact statement in December 2015.

The role of the courts in reviewing agency compliance with NEPA is accordingly limited. Furthermore, because NEPA does not create a private right of action, we can entertain NEPA-based challenges only under the Administrative Procedure Act and its deferential standard of review. See Theodore Roosevelt Conservation P’ship v. Salazar, 616 F.3d 497, 507 (D.C. Cir. 2010). That is, our mandate “is ‘simply to ensure that the agency has adequately considered and disclosed the environmental impact of its actions and that its decision is not arbitrary or capricious.’”

To sum up, the EIS acknowledged and considered the substance of all the concerns Sierra Club now raises: the fact that the Southeast Market Pipelines Project will travel primarily through low-income and minority communities, and the impact of the pipeline on the city of Albany and Dougherty County in particular. The EIS also laid out a variety of alternative approaches with potential to address those concerns, including those proposed by petitioners, and explained why, in FERC’s view, they would do more harm than good. The EIS also gave the public and agency decisionmakers the qualitative and quantitative tools they needed to make an informed choice for themselves. NEPA requires nothing more.

It’s not just the journey, though, it’s also the destination. All the natural gas that will travel through these pipelines will be going somewhere: specifically, to power plants in Florida, some of which already exist, others of which are in the planning stages. Those power plants will burn the gas, generating both electricity and carbon dioxide. And once in the atmosphere, that carbon dioxide will add to the greenhouse effect, which the EIS describes as “the primary contributing factor” in global climate change. J.A. 915. The next question before us is whether, and to what extent, the EIS for this pipeline project needed to discuss these “downstream” effects of the pipelines and their cargo. We conclude that at a minimum, FERC should have estimated the amount of power-plant carbon emissions that the pipelines will make possible.

BROWN, Circuit Judge, concurring in part and dissenting in part:

I join today’s opinion on all issues save the Court’s decision to vacate and remand the pipeline certificates on the issue of downstream greenhouse emissions. Case law is clear: When an agency “‘has no ability to prevent a certain effect due to’ [its] ‘limited statutory authority over the relevant action[],’ then that action ‘cannot be considered a legally relevant cause’” of an indirect environmental effect under the National Environmental Policy Act (“NEPA”).

Here, FERC declined to engage in an in-depth examination of downstream greenhouse gas emissions because there is no causal relationship between approval of the proposed pipelines and the downstream greenhouse emissions; and, even if a causal relationship exists, any additional analysis would not meaningfully contribute to its decision making. Both determinations were reasonable and entitled to deference.

Regarding causation, the Court is correct that NEPA requires an environmental analysis to include indirect effects that are “reasonably foreseeable,” Freeport, 827 F.3d at 46, but it misunderstands what qualifies as reasonably foreseeable. The Court blithely asserts it is “not just the journey,” it is “also the destination.” Maj. Op. at 18. In fact, NEPA is a procedural statute that is all about the journey. It compels agencies to consider all environmental effects likely to result from the project under review, but it “does not dictate particular decisional outcomes.”

While the Court concludes FERC’s approval of the proposed pipelines will be the cause of greenhouse gas emissions because a significant portion of the natural gas transported through the pipeline will be burned at power plants, see Maj. Op. at 19, the truth is that FERC has no control over whether the power plants that will emit these greenhouse gases will come into existence or remain in operation.

Even if the Court is correct that the Commission has the power to deny pipeline certificates based on indirect environmental concerns, such a denial represents the limit of the Commission’s statutory power. Nothing would prevent the Florida Board from independently approving the construction or expansion of the power plants at issue. In fact, the record shows the Board has already approved some of these projects prior to the Commission reaching a decision on the proposed pipelines. JA 910–11. Moreover, there is also nothing preventing the Intervenors from pursuing an alternative method of delivery to account for the same amount of natural gas. Practical considerations point in the opposite direction. Both the Board and the Commission have concluded Florida has a need for additional natural gas, and nothing in today’s opinion takes issue with those holdings.

Thus, just as FERC in the DOE cases and the Federal Motor Carrier Safety Administration in Public Citizen did not have the legal power to prevent certain environmental effects, the Commission here has no authority to prevent the emission of greenhouse gases through newly-constructed or expanded power plants approved by the Board.

The DC Appeals Court Decision August 8, 2017

Overview

A major clarification came today from the DC Court of Appeals ordering EPA (and thus the Executive Branch Bureaucracy) to defer to Congress regarding regulation of substances claimed to cause climate change.  While the issue and arguments are somewhat obscure, the clarity of the ruling is welcome.  Basically, the EPA under Obama attempted to use ozone-depleting authority to regulate HFCs, claiming them as greenhouse gases.  The judges decided that was a stretch too far.

The EPA enacted the rule in question in 2015, responding to research showing hydroflourocarbons, or HFCs, contribute to climate change.

The D.C. Circuit Court of Appeals’ 2-1 decision said EPA does not have the authority to enact a 2015 rule-making ending the use of hydrofluorocarbons commonly found in spray cans, automobile air conditioners and refrigerators. The three-judge panel said that because HFCs are not ozone-depleting substances, the EPA could not use a section of the Clean Air Act targeting those chemicals to ban HFCs.

“Indeed, before 2015, EPA itself maintained that Section 612 did not grant authority to require replacement of non ozone-depleting substances such as HFCs,” the court wrote.

“EPA’s novel reading of Section 612 is inconsistent with the statute as written. Section 612 does not require (or give EPA authority to require) manufacturers to replace non ozone-depleting substances such as HFCs,” said the opinion, written by Judge Brett Kavanaugh, joined by Judge Janice Brown.

Contextual Background from the Court Document On Petitions for Review of Final Action by the United States Environmental Protection Agency  Excerpts below (my bolds)

In 1987, the United States signed the Montreal Protocol. The Montreal Protocol is an international agreement that has been ratified by every nation that is a member of the United Nations. The Protocol requires nations to regulate the production and use of certain ozone-depleting substances.

As a result, in the 1990s and 2000s, many businesses stopped using ozone-depleting substances in their products. Many businesses replaced those ozone-depleting substances with HFCs. HFCs became prevalent in many products. HFCs have served as propellants in aerosol spray cans, as refrigerants in air conditioners and refrigerators, and as blowing agents that create bubbles in foams.

In 2013, President Obama announced that EPA would seek to reduce emissions of HFCs because HFCs contribute to climate change.

Consistent with the Climate Action Plan, EPA promulgated a Final Rule in 2015 that moved certain HFCs from the list of safe substitutes to the list of prohibited substitutes. . .In doing so, EPA prohibited the use of certain HFCs in aerosols, motor vehicle air conditioners, commercial refrigerators, and foams – even if manufacturers of those products had long since replaced ozonedepleting substances with HFCs. Id. at 42,872-73.

Therefore, under the 2015 Rule, manufacturers that used those HFCs in their products are no longer allowed to do so. Those manufacturers must replace the HFCs with other substances that are on the revised list of safe substitutes.

In the 2015 Rule, EPA relied on Section 612 of the Clean Air Act as its source of statutory authority. EPA said that Section 612 allows EPA to “change the listing status of a particular substitute” based on “new information.” Id. at 42,876. EPA indicated that it had new information about HFCs: Emerging research demonstrated that HFCs were greenhouse gases that contribute to climate change. See id. at 42,879. EPA therefore concluded that it had statutory authority to move HFCs from the list of safe substitutes to the list of prohibited substitutes. Because HFCs are now prohibited substitutes, EPA claimed that it could also require the replacement of HFCs under Section 612(c) of the Clean Air Act even though HFCs are not ozone-depleting substances.

EPA’s current reading stretches the word “replace”  beyond its ordinary meaning. . .
Under EPA’s current interpretation of the word “replace,” manufacturers would continue to “replace” an ozone-depleting substance with a substitute even 100 years or more from now. EPA would thereby have indefinite authority to regulate a manufacturer’s use of that substitute. That boundless interpretation of EPA’s authority under Section 612(c) borders on the absurd.

In any event, the legislative history strongly supports our conclusion that Section 612(c) does not grant EPA continuing authority to require replacement of non-ozone-depleting substitutes.. . In short, although Congress contemplated giving EPA broad authority under Title VI to regulate the replacement of substances that contribute to climate change, Congress ultimately declined.

However, EPA’s authority to regulate ozone-depleting substances under Section 612 and other statutes does not give EPA authority to order the replacement of substances that are not ozone depleting but that contribute to climate change. Congress has not yet enacted general climate change legislation. Although we understand and respect EPA’s overarching effort to fill that legislative void and regulate HFCs, EPA may act only as authorized by Congress. Here, EPA has tried to jam a square peg (regulating non-ozone depleting substances that may contribute to climate change) into a round hole (the existing statutory landscape).

The Supreme Court cases that have dealt with EPA’s efforts to address climate change have taught us two lessons that are worth repeating here. See, e.g., Utility Air Regulatory Group v. EPA, 134 S. Ct. 2427 (2014). First, EPA’s well intentioned policy objectives with respect to climate change do not on their own authorize the agency to regulate. The agency must have statutory authority for the regulations it wants to issue. Second, Congress’s failure to enact general climate change legislation does not authorize EPA to act. Under the Constitution, congressional inaction does not license an agency to take matters into its own hands, even to solve a pressing policy issue such as climate change.

Summary

As the August 6 ruling makes clear, judges are making decisions in a legislative vacuum.  The law of the land regarding “greenhouse gases” has yet to be enacted.  Congress could put on their big boy pants and pass a declaration that CO2 can not be considered a “pollutant” as classified by the Clean Air Act.  Failing that, rulings will come down on all sides, unless and until the Supreme Court takes up the issue.  I suppose then Judge Kennedy will make the call.

Judges are not experts in the fields of knowledge involved in cases that come before them.  Instead, they make decisions as “reasonable people”, nominated in fact as the most reasonable people we can find in our society.  How disappointing it is to see many of them accepting social proof instead of weighing the evidence undermining the notion of CO2 as the climate control knob.  How frustrating to see some of them twisting and stretching to kowtow to an hypothetical “consensus” rather than apply the law as written.

Footnote:  It appears that in July Judge Janice Brown announced her future retirement before taking the position of reason in both these rulings.

Notes from the Judicial Climate Battleground

Flashes of lucidity from the bench in recent proceedings Climate Case: Judge Defends Rule of Law

On lawsuits fronted by children Climate War Human Shields

Legal entanglements for corporations How Climate Law Relies on Paris

On the legal case exonerating fossil fuels Claim: Fossil Fuels Cause Global Warming


August Arctic Ice Unalarming

Click on image to enlarge.

The image above shows ice extents for day 233 from 2007 to 2017.  Particularly interesting is the variation in the CAA (Canadian Arctic  Archipelago), crucial for the Northwest Passage.  (The region is located just north of the words “Ice Extent” in gold.)  Note that 2016 was a fine year for cruising with the passage completely open at this date.  That was not the case in 2014, and this year is also frozen solid.

The graph of August NH ice extents shows 2017 virtually tied with the decadal average as of yesterday. This year is now 550k km2 greater than 2016 and exceeds 2007 by 250k km2.  SII (Sea Ice Index) 2017 is also 400k km2 lower.  A previous post Beware the Arctic Storms of August discussed how late summer storms have dramatic impacts, and the graph shows both 2012 and 2016 plummeting in the last five days.  By the end of the month in nine days, those two years will go below 4.4M km2.

The Table compares 2017 day 233 ice extents with the decadal average and 2007.  it is evident that  this year’s extents are in surplus on the Canadian side and Central Arctic, offset by deficits on the Pacific side.

Region 2017233 Day 233
Average
2017-Ave. 2007234 2017-2007
 (0) Northern_Hemisphere 5634884 5652704 -17820 5388004 246880
 (1) Beaufort_Sea 569472 643245 -73773 731647 -162175
 (2) Chukchi_Sea 285855 399788 -113934 222895 62959
 (3) East_Siberian_Sea 386603 517871 -131268 81989 304614
 (4) Laptev_Sea 308812 244158 64655 295384 13428
 (5) Kara_Sea 65151 86439 -21288 161780 -96628
 (6) Barents_Sea 33482 22883 10599 18656 14826
 (7) Greenland_Sea 184582 222908 -38326 335976 -151394
 (8) Baffin_Bay_Gulf_of_St._Lawrence 92400 37803 54597 51008 41392
 (9) Canadian_Archipelago 494273 353728 140546 325028 169245
 (10) Hudson_Bay 34936 43613 -8677 61078 -26141
 (11) Central_Arctic 3178159 3079193 98966 3101306 76853

By the way, Barents is still above average and just added some ice.

The black line is average for the last 11 years.  2007 in purple appears close to an average year.  2014 had the highest annual extent in Barents Sea, due to higher and later maximums, holding onto ice during the summer, and recovering quickly.  In contrast, 2016 was the lowest annual extent, melting out early and recovering later.  2017 in blue started out way behind, but grew rapidly to reach average, and then persisted longer to exceed even 2014.  It will be important to see when the recovery of ice begins.

For more on why Barents Sea matters see Barents Icicles

Summary and Outlook

As discussed above, weather these few weeks will determine the fate of ice extents.  Here is the Arctic Oscillation and Polar Vortex Analysis and Forecast from  August 21, 2017 by Dr. Judah Cohen from Atmospheric and Environmental Research (AER).

The AO is currently neutral (Figure 1), reflective of mostly mixed geopotential height anomalies across the Arctic and mixed geopotential height anomalies across the mid-latitudes of the NH (Figure 2). Geopotential height anomalies are also mixed across Greenland and Iceland (Figure 2), and therefore the NAO is also neutral. However blocking/high pressure will strengthen first across Northern Canada and eventually across Greenland forcing the AO/NAO into negative territory over the next two weeks.

New snowfall is also predicted over the Arctic sea ice over the coming two weeks, a sign that the Arctic sea ice melt season is coming to an end. It was never in doubt that once again Arctic sea ice would be well below normal this summer. However predicted new snowfall will retard sea ice melt and a new record low minimum seems unlikely. The trajectory of sea ice extent seems similar to 2007, 2011, 2015 and 2016 and will likely bottom out close to those group of years. If the melt season ends early then there is even an outside chance it could even match the years of 2008 and 2010.

Footnote

Some people unhappy with the higher amounts of ice extent shown by MASIE continue to claim that Sea Ice Index is the only dataset that can be used.  This is false in fact and in logic.  Why should anyone accept that the highest quality picture of ice day to day has no shelf life, that one year’s charts can not be compared with another year?  Researchers do this, including Walt Meier in charge of Sea Ice Index.  That said, I understand his interest in directing people to use his product rather than one he does not control.  As I have said before:

MASIE is rigorous, reliable, serves as calibration for satellite products, and continues the long and honorable tradition of naval ice charting using modern technologies.  More on this at my post Support MASIE Arctic Ice Dataset

Impaired Climate Vision

We are entering the season where governments, especially the US are reviewing and finalizing Climate Assessments.  Whenever citizens or decision makers are presented with an assessment and recommendations, it is important to take the stance of a “reasonable person.”  That means one applies critical intelligence by asking if assertions are well-founded and logical.

In starting to read the draft Climate Assessment reports, it strikes me that the difference between alarmists and others is not so much in the data or facts, but in the perspective through which one sees and interprets the information.  From experience the last few years, I suggest that readers of these reports need to be alert for two errors that crop up often.  The general impairments are stated below followed by some examples for illustration.

  1. CO2 Alarm is Myopic: Claiming CO2 causes dangerous global warming is too simplistic. CO2 is but one factor among many other forces and processes interacting to make weather and climate.

Myopia is a failure of perception by focusing on one near thing to the exclusion of the other realities present, thus missing the big picture. For example: “Not seeing the forest for the trees.” AKA “tunnel vision.”

2. CO2 Alarm is Lopsided: CO2 forcing is too small to have the overblown effect claimed for it. Other factors are orders of magnitude larger than the potential of CO2 to influence the climate system.

Lopsided

Lop-sided refers to a failure in judging values, whereby someone lacking in sense of proportion, places great weight on a factor which actually has a minor influence compared to other forces. For example: “Making a mountain out of a mole hill.”

Correcting for Myopia and/or Lop-sidedness

Example of Greenland Ice Sheet

It was recently suggested to me that we should all be concerned about the Greenland ice sheet melting resulting in dangerous rising sea levels.  The evidence presented came from US climate.gov in the form of this chart.

On the NOAA page where it appears, they explain:

The ups and downs in the graph track the accumulation of snow in the cold season and the melting of the ice sheet in the warm season. The Arctic Report Card: Update for 2016 reported that between April 2015 and April 2016, Greenland lost approximately 191 gigatonnes of ice, roughly the same amount that was lost between April 2014 and April 2015. Though the April 2015–April 2016 mass loss was lower than the average April-to-April decline over the entire observation period, it continued the long-term melt trend: approximately 269 gigatonnes per year from 2002 to 2016.

Now that NOAA graph needs to be understood in context.  That means looking at the data in the largest relevant scope (test for myopia) and checking that conclusions are in proportion (not lop-sided) compared to the base reality.

First, it turns out that the years since 2002 are not representative.  From DMI (Danish Meteorological Institute Aerial photos from Greenland topple climate models

Between 1985 and 1992, Greenland experienced a large loss of ice mass because of dynamic ice-mass loss. But the glaciers stabilised and there was no dynamic ice-mass loss for more than ten years.

This loss started again in 2004 and has continued until today.

“We can see that the dynamic ice-mass loss is not accelerating constantly, as we had believed,” says Shfaqat Abbas Khan, a senior researcher at DTU Space – the National Space Institute.

“It is only periodically that the ice disappears as rapidly as is happening today. We expect that the reduction in Greenland’s ice mass due to the dynamic ice-mass loss will ease over the next couple of years and will reach zero again.”

And sure enough Greenland is making a surplus of ice this year

But the call for concern is also lop-sided in the context of the actual massiveness of Greenland’s ice sheet which has persisted for millennia. (That’s why they go there for ice cores.)

Doing the numbers: Greenland area 2.1 10^6 km2 80% ice cover, 1500 m thick in average- That is 2.5 Million Gton. Simplified to 1 km3 = 1 Gton

200 Gton is 0.008 % of that mass.

Annual snowfall: From the Lost Squadron, we know at that particular spot, the ice increase since 1942 – 1990 was 1.5 m/year ( Planes were found 75 m below surface)
Assume that yearly precipitation is 100 mm / year over the entire surface.
That is 168000 Gton. Yes, Greenland is Big!

Inflow = 168,000Gton. Outflow is 168,200 Gton.

So if that 200 Gton rate continued, an assumption not warranted by observations above, that ice loss would result in a 1% loss of Greenland ice in 800 years.

Seen in the proper perspective, there is no reason for panic.

Example: Movement of Ecological Life Zones

I have been referred to studies in places like Arizona finding that certain species are moving to higher altitudes because of warming to their native habitat.  The research seems solid and I do not doubt either that climate zones shift over time or that plant and animal life adapt.  But how serious is the problem?  The US Southwest has warmed in recent decades, while the US Southeast has cooled.  What is the global story on changing climate zones?

188767-004-6bde1150

Köppen climate zones as they appear in the 21st Century.

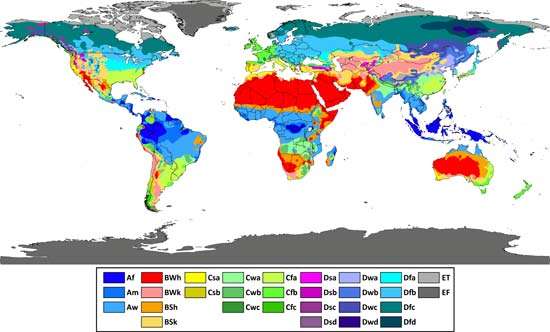
Fortunately we have a well-established framework classifying climate zones based upon temperature and precipitation patterns.  And researchers have addressed this question in this paper: Using the Köppen classification to quantify climate variation and change: An example for 1901–2010  By Deliang Chen and Hans Weiteng Chen Department of Earth Sciences, University of Gothenburg, Sweden

Hans Chen has built an excellent interactive website (here): The purpose of this website is to share information about the Köppen climate classification, and provide data and high-resolution figures from the paper Chen and Chen, 2013: Using the Köppen classification to quantify climate variation and change: An example for 1901–2010 (pdf). A synopsis is at my post Data vs. Models #4: Climates Changing.

Briefly, for this discussion, Chen and Chen presented tables and charts showing that most places have had at least one entire year with temperatures and/or precipitation atypical for that climate. It is much more unusual for abnormal weather to persist for ten years running. At 30-years and more the zones are quite stable, such that is there is little movement at the boundaries with neighboring zones.  Over time, there is variety in zonal changes, albeit within a small range of overall variation.

A Final Example: Rising Temperatures

A tv show in Australia illustrated how vision is impaired on this subject.  A typical graph was used to claim warming is alarming.  It came from the NASA Goddard Institute of Space Studies (GISS):

The graph shows no pause whatsoever.  This is accomplished by lowering the 1998 El Nino spike relative to 2015 El Nino. To see what is going on, here is a helpful chart from Dr. Ole Humlum at Climate4you.

It shows that indeed, GISS is showing 1998 peak lower than several years since, especially 2002, 2010 and 2016. In contrast, the satellite record is dominated by 1998, and may still be in that position once La Nina takes hold. The differences arise because satellites measure air temperature in the lower troposphere, while GISS combines records from land stations with sea surface temperatures (SSTs) to fabricate a global average anomaly, including adjusting, gridding and infilling to make the estimate of Global Mean Temperatures and compare to a 30-year average.

An insight into the adjustments is displayed below.  Dr. Humlum demonstrates that GISS is an unstable temperature record.

Dr. Humlum:

Based on the above it is not possible to conclude which of the above five databases represents the best estimate on global temperature variations. The answer to this question remains elusive. All five databases are the result of much painstaking work, and they all represent admirable attempts towards establishing an estimate of recent global temperature changes. At the same time it should however be noted, that a temperature record which keeps on changing the past hardly can qualify as being correct. (my bold)

All of these charts also suffer from lop-sidedness.  Considering the range of temperatures experienced by most Americans in a typical year, the following graph is more representative.

Why did GISS ignore the platinum standard satellite temperature dataset?  Why should the current graph be believed when it differs from previous ones, and maybe the next one?  Was not the 1C warming since 1850 a boon for civilization and the biosphere?  Should we wish for it to get cooler and start the slide into the next ice age?

Summary

There are a great many claims assembled in these Climate Assessments, all of them in support of policies like the Paris accord.  Reasonable people need to test for myopia and maintain a sense of proportion in order not to be taken in.

Astronomy is Science. Climatology Not.

A nice tongue in cheek essay appeared in the Atlantic The Eclipse Conspiracy: Something doesn’t add up.

It is a whimsical spoof on anyone skeptical that the solar eclipse will happen tomorrow. (Excerpts)

Meanwhile the scientists tell us we can’t look at it without special glasses because “looking directly at the sun is unsafe.”

That is, of course, unless we wear glasses that are on a list issued by these very same scientists. Meanwhile, corporations like Amazon are profiting from the sale of these eclipse glasses. Is anyone asking how many of these astronomers also, conveniently, belong to Amazon Prime?

Let’s follow the money a little further. Hotels along the “path of totality”—a region drawn up by Obama-era NASA scientists—have been sold out for months. Some of those hotels are owned and operated by large multinational corporations. Where else do these hotels have locations? You guessed it: Washington, D.C.

In fact the entire politico-scientifico-corporate power structure is aligned behind the eclipse. This includes the mainstream media. How many news stories have you read about how the eclipse won’t happen?

That’s a great example of “conspiracy ideation” and a subtle dig at people who don’t trust NASA on climate matters. In fact, many of the real NASA scientists are extremely critical of NASA’s participation in climate activism.  Journalists or Senators who raise NASA as evidence of climate change should be directed to The Right Climate Stuff, where esteemed NASA scientists give plenty of good reasons to doubt NASA on this topic.

Bottom Line: A Real Science Makes Predictions that Come True.

The article, perhaps unwittingly, shows why Astronomy is a real science we can trust while Climatology is faith-based, like Astrology. When the eclipse happens, it confirms Astronomers have knowledge about the behavior of planetary bodies. When numerous predictions of climate catastrophes are unfulfilled, it demonstrates scientists’ lack of knowledge about our climate system. Anyone claiming certainty about the climate is exercising their religious freedom, but not doing science.


Global Warming Fails to Convince

I happened to read an article at Real Clear Science An Inconvenient Truth About ‘An Inconvenient Truth’ by Eric Merkley & Dominik Stecula August 18, 2017. The article itself is of middling interest, mainly being a lament that Al Gore became the leading promoter of public awareness about the dangers of global warming. The authors contend that Republicans were predetermined to reject claims from such a high-profile liberal Democrat.

It is not new nor interesting to hear warmists diss skeptics as simplistic right-wingers having a knee jerk reaction to global warming claims. But reading the comment thread was illuminating and undercut the presumptions of the article. Instead of pointing to all the leftist knee jerkers swearing allegiance to climatism, posts by several scientists made comments hitting the credibility problem at its core.

Two comments reprinted below deserve a wide audience for expressing what many think but have not expressed so clearly.

@Gabe Kesseru

I spent an entire career in applied sciences and know the difference between true science and lesser areas of study. Climatology is one of the latter. It is mostly a field of historical trend analysis trying desperately to be a field of trend prediction (and doing very poorly at that).

Climatologists have done themselves a disservice by calling themselves scientists, since by doing so we expect them to use the scientific method. The use of scientific method will always be impossible in climatology, since the most important step in the SM is experimentation to prove the hypothesis. And experimentation is impossible when we can’t perform a laboratory equivalent of the earth’s climate over centuries in a laboratory experiment.

Secondarily, science requires that we gather data to laboratory accuracy levels which again is impossible with haphazard worldwide thermometer measurements originally meant to measure weather at casual levels of accuracy and casual levels of repeatability.

@Dan Ashley · Northcentral University

Dan Ashley here. PhD statistics, PhD Business.

I am not a climate, environment, geology, weather, or physics expert. However, I am an expert on statistics. So, I recognize bad statistical analysis when I see it. There are quite a few problems with the use of statistics within the global warming debate. The use of Gaussian statistics is the first error. In his first movie Gore used a linear regression of CO2 and temperature. If he had done the same regression using the number of zoos in the world, or the worldwide use of atomic energy, or sunspots, he would have the same result. A linear regression by itself proves nothing.

The theory that CO2 is a greenhouse gas has been proven correct in a small greenhouse only. As a matter of fact, plants like higher CO2 and it is frequently pumped into greenhouses because of that. There has never been a definitive experiment regarding CO2, at or near the concentrations in our atmosphere. This theory actually has much less statistical support than the conspiracy theories regarding JFK’s assassination.

Gaussian statistics REQUIRE the events being published to be both independent and random. The temperatures experienced in one part of the world are dependent on temperatures in other locales. The readings are not independent. A better statistical method would be Mandlebroten (fractal). Mandlebroten statistics are not merely “fat tailed” statistics.

A more problematic issue with the data is that it has been adjusted. Data adjustments are frequently needed –for example, if a measuring device fails. However 100% of the data adjustments used are in favor of proving global warming. 100%. Not 100% minus one adjustment. Not nearly 100%. 100% –that is ALL– of the adjustments were in one direction only. Any student that put data like that in a PHD dissertation would never receive a doctoral degree.

One study published showed parts of the Earth where warming was occuring faster than other parts of the globe. The study claimed to be of data solely from satellites. The study identified several areas (Gambia for one) which have greater warming than other areas. Unfortunately, in three of those areas there have been no climate satellite observations for years.

The statements that claim “less arctic ice in recorded history” are equally spurious. We started gathering data on that in 1957 with the first satellite fly overs. On this issue “recorded history” is a very short time period.

Some geologist friends told me that a significant amount of Earth’s heat comes from the hot Earth’s core. They further stated that they do not know what percentage of heat that is. They do know it is probably over 20% and probably less than 70%. Whereas either of those extremes seems unlikely to me, remember that I am not a geologist.

As to rising oceans, that should be measured accurately. Measuring it with a stick stuck in the sand is inappropriate. Geologists tell me that the land is shifting and moving. Measuring it against the gravitational center of the Earth is the only accurate way. However, we do not know how to do that. As a matter of fact, we don’t know precisely where the gravitational center of the Earth is. (Any physicists around that want to explain the two body and the three body problem as it relates to the Earth, Moon, and Sun, please do so.

So, according to climate scientists the world is warming up. They may be correct, they may be incorrect. However, they have been unable to support their thesis via the use of statistics.

I personally see no reason to disassemble the world’s economic systems over an unproven, and somewhat implausible theory.

Summary

The scientific claims made in Gore’s movies do not stand up to scrutiny.  Changing the salesman is not going to make the pitch any more believable.

See also

Reasoning About Climate

Big Al’s Sequel Flawed at its Core

Beware the Arctic Storms of August

The Great Arctic Cyclone August 2012

The next two weeks will determine where this year’s minimum will rank compared to recent years. And much will depend upon storm activity which breaks up ice edges, compacts ice chunks and transports ice out through Fram Strait where it melts in the warmer Norwegian Sea.

We have two recent examples in 2012 and 2016. The Great Arctic Cyclone of 2012 produced the lowest minimum of the decade. The NASA photo of the storm is above.  The image below presents the impact of the 2012 storm upon ice extents from mid-August to mid-September annual minimum.  (Click on image to enlarge.)

In contrast, a more normal, non-stormy year is represented by 2014.  Progression of ice extents for 2014 is shown below.

Then again in 2016 several sizable Arctic storms struck late August.  The image below shows cyclonic winds (center left) over the Arctic Ocean on August 22, 2016.

The storms effect on 2016 sea ice appears in the image below.

Summary

Arctic ice extents these three years were not far apart mid-August, but they ended the melt season quite differently.  The Great Arctic Cyclone made 2012 the lowest of the decade, bottoming out at 3.4M km2.  2016 August storms also produced a low annual minimum of 4.2M km2.  In contrast, the absence of major storms in 2014 resulted in a much higher September minimum of 5.13M km2.  All of these compare to 2007 minimum of 4.05M km2, with no major storms reported.

It is difficult to extract a climate signal out of fluctuating ice extent minimums when they are so dependent on the vagaries of weather events.  It also means that anything can happen in the next few weeks.


August 11 Arctic Ice Report


Arctic sunset to occur in the next weeks. Nunavut is already having Civil Twilight, meaning the sun is less than 6 degrees below the horizon during the night.

The extent of Arctic ice fell to a new wintertime low in March 2017. But springtime ice persisted and extents since June are hanging around the decadal average.  Below shows the last 27 days through yesterday, August 11, 2017.

For this period 2017 was mostly average or higher, continuing into August. This year is now almost 300k km2 greater than 2016 and exceeds 2007 by 600k km2.  SII 2017 is also 600k km2 lower.

As we shall see, this year’s extents are in surplus on the Atlantic side, offset by deficits on the Pacific side.  The image compares day 223 with the same day in 2007.

The Table compares 2017 day 223 ice extents with the decadal average and 2007.

Region 2017223 Day 223
Average
2017-Ave. 2007223 2017-2007
 (0) Northern_Hemisphere 6295153 6338630 -43477 5690646 604507
 (1) Beaufort_Sea 646803 740583 -93779 767724 -120921
 (2) Chukchi_Sea 342601 479258 -136657 261771 80831
 (3) East_Siberian_Sea 411714 663564 -251849 207590 204124
 (4) Laptev_Sea 430221 329873 100349 310764 119458
 (5) Kara_Sea 140411 123400 17011 215854 -75443
 (6) Barents_Sea 60001 28883 31118 15996 44005
 (7) Greenland_Sea 236735 253185 -16450 286393 -49658
 (8) Baffin_Bay_Gulf_of_St._Lawrence 207230 71011 136219 83942 123288
 (9) Canadian_Archipelago 527348 439371 87977 361883 165465
 (10) Hudson_Bay 70437 87621 -17184 94262 -23825
 (11) Central_Arctic 3220493 3120642 99851 3083211 137282

Deficits to average are in the BCE region, and surpluses appear almost everywhere else.  Ice is particularly strong in Laptev, Baffin, CAA and the Central Arctic.

The graph below shows Barents this year continues to be above average but fell behind the record year of 2014. After pausing at 70K km2, it dipped to 50k km2, then bounced back to 60k yesterday.

The black line is average for the last 11 years.  2007 in purple appears close to an average year.  2014 had the highest annual extent in Barents Sea, due to higher and later maximums, holding onto ice during the summer, and recovering quickly.  In contrast, 2016 was the lowest annual extent, melting out early and recovering later.  2017 in blue started out way behind, but grew rapidly to reach average, and then persisted longer to exceed even 2014.  It will be important to see when the recovery of ice begins.

For more on why Barents Sea matters see Barents Icicles


Big Al’s Sequel: Flawed at its Core


maxresdefault
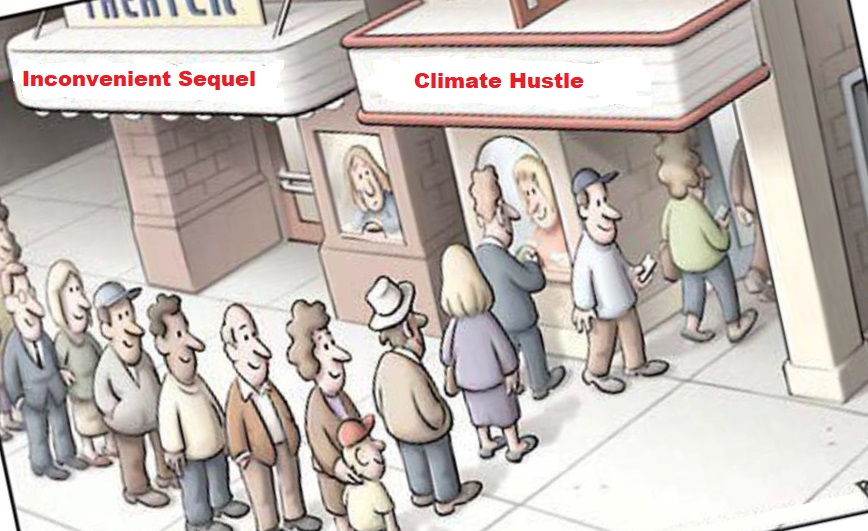
Fortunately, box offices show few other than die-hard Gore fans are subjecting themselves to the Inconvenient Sequel. When people go to see cli-sci-fi (Climate Science Fiction) movies like Water World or Day After Tomorrow, they know in advance it will be someone’s imaginary portrayal of an undesirable future. The difference with Al Gore, and also with the writers of the draft US Climate Assessment is their claim that their imaginings are “the Truth.”

Despite the low box office numbers, the media will inundate us with flawed messages from the film, so this post is required for protection around the office water cooler or the kitchen table. Text below in italics are excerpts from Alex Epstein’s article in the Financial Post Al Gore can’t deny that his climate crusade involves great suffering  Alex Epstein: Gore has to make the case that climate dangers warrant so much human misery

Good Reasons to reject Al Gore’s alarms.

The running theme throughout An Inconvenient Sequel is that Gore’s first film was even more right than he expected. The movie begins with defenders of fossil fuels mocking or ignoring the dramatic predictions of An Inconvenient Truth. Leaving aside a heroic (and highly disputed) portrayal of Gore rescuing the Paris climate accord, the rest of the movie focuses on vindicating Gore’s two chief predictions: 1) That we could replace fossil fuels with cheap solar- and wind-powered “renewables”; and 2) that continued use of fossil fuels would lead to catastrophic temperature rises, catastrophic sea-level rises, catastrophic flooding, catastrophic drought, catastrophic storms, and catastrophic disease proliferation.

Let’s deal first with Gore’s second supposition.

Alarmists Substitute Models for Observations and Data

Since the last IPCC report (AR5), activists no longer respect what consensus scientists say. Observations and data are set aside, and only alarming projections from models count. As we know, computer simulations of the climate system are flawed, and running hotter than even adjusted global datasets. And we also know, since model outputs can only project modeler’s assumptions into the future, the models cannot prove the validity of those assumptions.

Berkeley physicist Richard Muller gives a mainstream scientist view of Gore’s claims.

“The problem is not with the survey, which asked a very general question. The problem is that many writers (and scientists!) look at that number and mis-characterize it. The 97% number is typically interpreted to mean that 97% accept the conclusions presented in An Inconvenient Truth by former Vice President Al Gore. That’s certainly not true; even many scientists who are deeply concerned by the small global warming (such as me) reject over 70% of the claims made by Mr. Gore in that movie (as did a judge in the UK; see footnote below).”

“I like to ask scientists who “believe” in global warming what they think of the data. Do they believe hurricanes are increasing? Almost never do I get the answer “Yes, I looked at that, and they are.” Of course they don’t say that, because if they did I would show them the actual data! Do they say, “I’ve looked at the temperature record, and I agree that the variability is going up”? No. Sometimes they will say, “There was a paper by Jim Hansen that showed the variability was increasing.” To which I reply, “I’ve written to Jim Hansen about that paper, and he agrees with me that it shows no such thing. He even expressed surprise that his paper has been so misinterpreted.”

“A really good question would be: “Have you studied climate change enough that you would put your scientific credentials on the line that most of what is said in An Inconvenient Truth is based on accurate scientific results? My guess is that a large majority of the climate scientists would answer no to that question, and the true percentage of scientists who support the statement I made in the opening paragraph of this comment, that true percentage would be under 30%. That is an unscientific guestimate, based on my experience in asking many scientists about the claims of Al Gore.”  Full text at Meet Richard Muller, Lukewarmist

Our Actual Climate is Mild and Not Dangerous

Nothing out of the ordinary is happening to our weather and climate, despite lots of claims otherwise. Gore’s sequel is long on anecdotes and fears, but lacks any references to the statistics contradicting him. Recent decades have been remarkably benign and agriculture is booming. IPCC scientists wrote that no evidence yet exists to connect extreme weather with human activities.  Alex Epstein:

Gore and others should be free to make the case that the danger of greenhouse gases is so serious as to warrant that scale of human misery. But they should have to quantify and justify the magnitude of climate danger. And that brings us to the truth about climate.

The overall trend in climate danger is that it is at an all-time low. The Emergency Events Database (EM-DAT) shows 6,114 climate-related deaths in 2016. In other recent years the numbers have maxed out in the tens of thousands. Compare this to the 1930s when, adjusted for population, climate-related deaths hit the 10-million mark several times.

The most significant cause of our radically reduced climate danger is industrial development, which takes a naturally dangerous climate and makes it unnaturally safe. And industrial development is driven by cheap, plentiful, reliable energy — which, today, overwhelmingly means fossil fuels. Climate will always be dangerous so priority number one is to have the energy and development to tame it. Modern irrigation, residential heating and air conditioning have made once uninhabitable places perfectly comfortable.

Controlling Human CO2 Emissions Will Not Change the Weather

The really inconvenient truth is that governments are not able to ensure favorable weather for humans. Nothing yet attempted, from corrupt carbon markets, to biofuels, to renewable electrical power, to carbon taxes has done anything beyond enriching cronies and filling government coffers.

Alex Epstein details Gore’s misdirecting us to renewables as our salvation.

Some of his anecdotes are meant to prove that cheap solar and wind are, as 2006 Gore prophesied, quickly dominating the world’s energy supply and, as 2006 Gore also warned us, that our rapidly warming climate is killing more and more people each year. But he has not given us the whole picture.

Take the rising dominance of solar and wind, which is used to paint supporters of fossil fuels as troglodytes, fools, and shills for Big Oil. The combined share of world energy consumption from renewables is all of two per cent. And it’s an expensive, unreliable, and therefore difficult-to-scale two per cent.

Because solar and wind are “unreliables,” they need to be backed up by reliable sources of power, usually fossil fuels, or sometimes non-carbon sources including nuclear and large-scale hydro power (all of which Gore and other environmentalists refuse to support). This is why every grid that incorporates significant solar and wind has more expensive electricity. Germans, on the hook for Chancellor Angela Merkel’s self-righteous anti-carbon commitments, are already paying three times the rates for electricity that Americans do.

Stories about “100-per-cent renewable” locations like Georgetown, Tex. are not just anecdotal evidence, they are lies. The Texas grid from which Georgetown draws its electricity is comprised of 43.7 per cent natural gas, 28.8 per cent coal, 12 per cent nuclear, and only 15.6 per cent renewable. Using a virtue-signalling gimmick pioneered by Apple, Facebook, and Google, Georgetown pays its state utility to label its grid electricity “renewable” — even though it draws its power from that fossil-fuel heavy Texas grid — while tarring others on the grid as “non-renewable.”

If we look at the overall trends instead of engaging in anecdotal manipulation we see that fossil fuel energy is the fastest-growing energy source in the world — still. Fossil fuels have never been more vital to human flourishing. There are 1,600 coal plants planned for the near future, which could increase international coal capacity 43 per cent. Advances in technology are making fossil fuels cleaner, safer, and more efficient than ever. To reduce their growth let alone to radically restrict their use — which is what Gore advocates — means forcing energy poverty on billions of people.

Conclusion

Gore’s Inconvenient Sequel gives a biased, self-serving, and convenient picture of fossil fuels and climate — convenient for Gore’s legacy, that is, but inconvenient for the billions his energy poverty policies will harm. As citizens, we must start demanding responsible thought leaders who will give us the whole picture that life-and-death energy and climate decisions require.

Note the contrast between Al Gore’s propaganda and Richard Lindzen’s short video:

Footnote:

Errors in “An Inconvenient Truth” Highlighted by UK High Court Judge Michael Burton:

1.) The sea level will rise up to 20 feet because of the melting of either West Antarctica or Greenland in the near future. (This “Armageddon scenario” would only take place over thousands of years, the judge wrote.)

2.) Some low-lying Pacific islands have been so inundated with water that their citizens have all had to evacuate to New Zealand. (“There is no evidence of any such evacuation having yet happened.”)

3.) Global warming will shut down the “ocean conveyor,” by which the Gulf Stream moves across the North Atlantic to Western Europe. (According to the Intergovernmental Panel on Climate Change, “it is very unlikely that the Ocean Conveyor will shut down in the future…”)

4.) There is a direct coincidence between the rise in carbon dioxide in the atmosphere and the rise in temperature over the last 650,000 years. (“Although there is general scientific agreement that there is a connection, the two graphs do not establish what Mr. Gore asserts.”)

5.) The disappearance of the snows on Mount Kilimanjaro is expressly attributable to global warming. (“However, it is common ground that, the scientific consensus is that it cannot be established that the recession of snows on Mount. Kilimanjaro is mainly attributable to human-induced climate change.”)

6.) The drying up of Lake Chad is a prime example of a catastrophic result of global warming. (“It is generally accepted that the evidence remains insufficient to establish such an attribution” and may be more likely the effect of population increase, overgrazing and regional climate variability.)

7.) Hurricane Katrina and the consequent devastation in New Orleans is because of global warming. (“It is common ground that there is insufficient evidence to show that.”)

8.) Polar bears are drowning because they have to swim long distances to find ice. (“The only scientific study that either side before me can find is one, which indicates that four polar bears have recently been found drowned because of a storm.”)

9.) Coral reefs all over the world are bleaching because of global warming and other factors. (“Separating the impacts of stresses due to climate change from other stresses, such as overfishing and pollution, was difficult.”)