In 2008 Nigel Lawson published An Appeal To Reason: A Cool Look at Global Warming. The Tory radical who served as Margaret Thatcher’s Chancellor of the Exchequer was promptly attacked for having the temerity to write about the theory of global warmingabsent scientific credentials.
Lawson thankfully didn’t cower amid the arrows directed his way. Instead, Lawson responded that he would cease talking about global warming as soon as other non-scientists like Al Gore, Tony Blair, and other self-serious hysterics did the same. Brilliant!
As readers surely know, the Al Gores of the world never took Lawson up on his offer. The non-scientist Gore continues to express alarm about “global warming,” and he continues to attack those who disagree with him.
Indeed, Gore recently went after David Malpass, president of the World Bank. Gore described Malpass as a “climate denier,” only for the World Bank head to be asked his views on whether or not human progress is the cause of a warming planet. Malpass’s response was, “I’m not a scientist.”
Please think about Malpass’s response, along with the vitriol directed at Lawson fourteen years ago. For writing a book about so-called “global warming” without scientific credentials, Lawson was demonized.
In which case, Malpass’s response to the question was seemingly the correct one
for the warming nail-biters in our midst.
Not a scientist, Malpass would leave the question of warming to the scientists. Gore et al should have been thrilled, except that Malpass’s response actually brought on more frothing at the mouth from warming’s religionists.
Applied to Lawson, it’s all a reminder that warmists really don’t care about one’s scientific credentials so long as the individual being asked about a warming planet is answering the questions the right way. Translated, you can be a dog-catcher and comment about global warming so long as you conclude that human progress born of fossil fuel consumption is the cause.
It’s all a reminder of how very surface is the embrace of “science” by warmists.
Survey in 2009 first to claim “97% of scientists agree”. Participation excluded private sector and skeptical disciplines (engineering, astrophysicists, etc.), then counted only 77 published climate specialists.
Call “science” their shield. In contending that “97% of scientists believe” life defined by much greater health and exponentially greater living standards has a “warming” downside, the warmists in their delusional minds feel as though they have immunity from reasonable discussion. They’re twice incorrect.
For one, arguably the surest sign you’re in the presence of “scientists” is if they’re arguing. In which case this laughable notion that scientists near monolithically believe as warming mouth breathers do near totally ignores just how much scientists debate everything. The previous truth further reminds us that it’s not science without the doubt.
From there, we just have to be reasonable. We have to stop and think about what life was like before the discovery that planet earth had immense and seemingly endless amounts of oil, coal and surely other commodities that provide us with power. Life before uses were discovered for the earth’s plenty was nothing short of brutal.
As Alex Epstein reminds us in Fossil Future, death from extreme cold was the annual norm, and actually much greater than deaths that resulted from extreme heat. There was also the problem of highly limited drinking water that was actually potable. After which, much of life was defined by an endless pursuit of food in quantities never sufficient to feed us. An “extra mouth to feed” used to be a very real worry, versus today when eating is taken for granted.
How did we get here? Fossil fuels, plain and simple. That’s the case because the fuels powered the various machines that freed us humans to increasingly specialize our work. Thanks to the mechanization of so much that was formerly done by human hands, the human beings that populate the world were more and more able to fulfill their specialized potential. In other words, a local and eventually global division of labor revealed itself on the way to staggering abundance that those who lived in a pre-fossil fuel past could never imagine.
In the words of Epstein, “climate mastery” born of incredibly sophisticated global symmetry meant that people had the means to heat their surroundings when it was bitterly cold, and cool their surroundings when it was brutally hot. Clean water was plentiful such that the world’s population could – yes – greatly reduce consumption of liquids with alcohol in it. And then houses and buildings could be built in rapid fashion that would similarly protect us from an “environment” that wasn’t always kind.
Crucial about these advances that were and are a direct consequence of machines, the ever-widening global division of labor that I write about in my new book The Money Confusion has given the world both the means to care about planet earth along with more and more specialized, Will tomorrow’s energy replace oil and coal? It’s impossible to say. But what can be said with certainty is that without an advanced society that’s a direct consequence of fossil-fuel consumption, we would never have the means to pursue oil’s replacement; assuming there is one.
Back to Malpass, it’s not just that his knuckle-dragging critics want it both ways in criticizing his true admission that he’s not a scientist. That’s just politics. What’s really sad is that global warming fanatics can’t see that the very human progress they disdain (and that they couldn’t live happily without) is what sets the stage for even better care of the planet they claim to want to save.
And it doesn’t take a scientist to understand what the warmists do not.
Tom Nelson posted this interview with Ross McKitrick on Big problems with paleoclimate data and land temperature records. H/T Climate-Science.press.
Ross McKitrick is a Professor of Economics at the University of Guelph where he specializes in environment, energy and climate policy. He has published widely on the economics of pollution, climate change and public policy. His book Economic Analysis of Environmental Policy was published by the University of Toronto Press in 2010.
His background in applied statistics has also led him to collaborative work across a wide range of topics in the physical sciences including paleoclimate reconstruction, malaria transmission, surface temperature measurement and climate model evaluation.
Professor McKitrick has made many invited academic presentations around the world and has testified before the US Congress and committees of the Canadian House of Commons and Senate.
The discussion is wide-ranging, and I provide below a lightly edited transcript on the main theme, starting around minute 41. Text is in italics with my bolds and added images. TN refers to Tom Nelson’s comments and RM to Ross McKitrick.
Transcript
RM: People need to understand that for the 20th century as a whole there’s temperature data for less than 50 percent of the Earth’s surface. And a lot of stuff is just being filled in with with assumptions or or modeling work, so it’s really the output of models. And so as you go back in time back to the 1920s for instance, here in Southern Ontario we have great temperature records back to the 1920s. Here in Guelph we have temperature data that goes back to the late 1800s.
One of the first assignments I have my students do in my environmental economics courses is just to take a few locations in Ontario that have more than 100 Years of temperature data and plot the records for average daily highs back 100 years or more. That always surprises them because they just don’t see what they’re expecting to see in terms of an upward trend. There’s a visible trend up to the 1930s or so. And then after that it’s kind of up and down flat.
Summertime temperatures especially, have gone down, they’ve gone up,
but haven’t really changed much since the 1930s.
We happen to be in a part of the world where we’ve got those kinds of long temperature records. For the vast majority of the world there’s just no data at all, or there are short temperature records or fragments of temperature records over various intervals. Yet what we see are these temperature graphs going back to the 1860s that they call the observational record. There’s so many problems with those records, and unfortunately a lot of the problems are of the form that introduces an upward bias in the trend. And it’s very difficult to measure it and remove it, though I did some work on that I hope eventually to go and do some more.
TN I wish more people took an interest in that kind of topic. Have you followed the work of Tony Heller when he’s looking back at adjustments to cool the past. It seems pretty interesting.
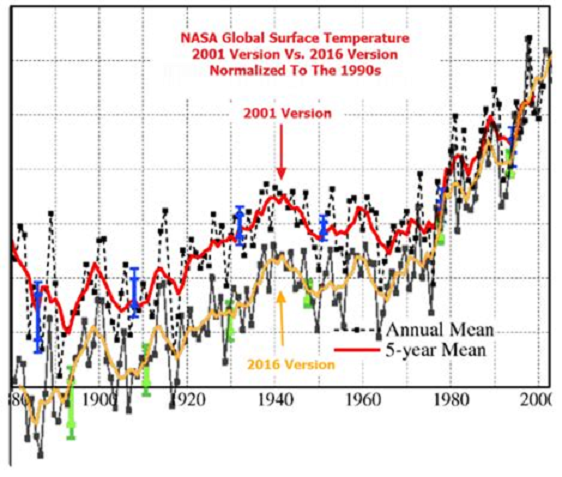
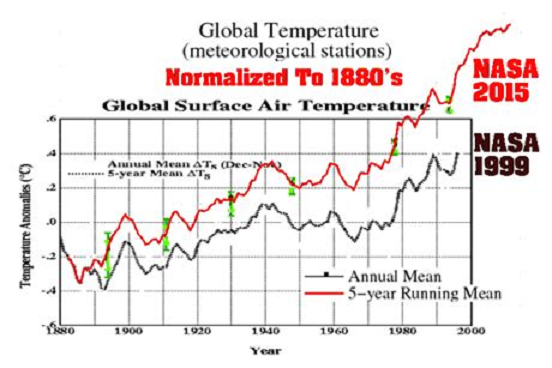
RM: Yes. I’ve seen many of his videos and now he’s focusing on the U.S record in a lot of his videos. There I think the point that he conveys is how frustrating it is for an observer. Just this notion that you’ve got the raw temperature observations and then the adjustments and they all seem to pivot around 1960.
So that anything prior to 1960, the Adjustment goes down,
and anything after 1960 the Adjustment goes up.
They create this picture that somehow in 1960 everyone in the US knew how to measure temperature perfectly. So that’s the year we’re going to leave as it is, and prior to that everybody made the same mistake. Everybody was always overestimating temperature so we’ve got to adjust those records downward. Then ever since 1960 people haven’t known how to measure temperature so we have to raise those those measurements. The pattern of adjustment is so consistent in so many places in the U.S records that at a certain point it’s just on its face implausible that these adjustments are based on some objective algorithm.
I know the people who make the adjustments will say: Well we’ve got to deal with time of observation bias you know. But if these were the sort of standard measurement errors, you would expect a mix of positive and negative mistakes. Instead, there’s such a pattern to it. The adjustments account for all the warming.
When you look at the post-1960 U.S record the adjustments are as large as the warming itself.
Remember that the warming trend is such an important input into thinking about the policy. We really need to have absolute confidence in these adjustment processes, but the people who make the adjustments do not respond in a constructive and forthright fashion to these kinds of criticisms. In my experience, they instead take such offense that anyone would question what they’re doing. And they respond with abuse and indignation when perfectly reasonable questions are put to them.
That’s another thing that makes it frustrating to an outside observer looking at these these adjusted data sets. So Tony does a very effective job in letting people see: Okay, this is a graph you’re shown. This is what the data looked like when they first collected it, and this is what the observers wrote down. And then this is what it looks like after the adjustment process. Obviously, this whole warming Trend in the U.S record is coming through the adjustments. So we have a right to a very detailed and skeptical review of these adjustments. The the lack of constructive engagement on a question like that ignores that at a certain point, the burden of proof here is on you guys, the record keepers. It’s not on the people who look at the data to go into every station record and prove it’s wrong.
The burden of proof here is on the people making the adjustments. For a long time they would refer back to a paper that was done in the 1980s for the Department of energy by Tom Wigley as the scientific basis of the adjustments. Eventually I got a hold of that document (because it’s hard to find). It turned out it was really just a lot of: Okay we think this record here moved around 1925, they moved the station from here to there, so we’re gonna make a little few changes here and we’ll bump this stretch of the data set up by this amount. And so it wasn’t like a a detailed scientific methodology that you could subject to some testing and validation.
It was really and for the time, it was all anyone really would have expected: Which is go through the data set and discuss the potential flaws and what the ad hock adjustments were. But for a long time that was that was it as far as documenting the adjustments. Now I think they’ve got more information out online to help people understand it. But that’s a long answer to your question. I go back to point out the adjustment really matters for the overall conclusion. And so if we’re going to accept the conclusion, we need to have absolute confidence in these adjustments.
And the people who could have over the years helped us gain that kind of confidence
haven’t done so.
They’ve done the opposite by being so resistant to any questioning of of their work, and made it so difficult for people to critique it. In my experiences, when you do get stuff into print and journals, then the IPCC misrepresents it and even makes up stuff that isn’t true. So I’m quite sympathetic if people just want to dismiss the the adjusted temperature record as being the product of a process where people put their thumb on the scale to get a certain result.
TN: What do you think, do you have any predictions on where climate science is going in the next 10 or 20 years? Just more of the same, or is it eventually going to crumble? It just seems like this can’t keep going on, that the lies are so big that it can’t keep going on but what do you think?
RM: My observations began 20 years ago. When I started, if you think of where people are in the spectrum, you’ve got someone like me (whatever the opposite of the word alarmist would be). I’m not particularly worried about climate change. I think the evidence is: It’s not a big deal. And there’ll be changes and things to adapt to, but they’re on a small scale compared to the normal course of events and things that we we adapt to in life.
And then you’ve got the alarmists who are you know, throwing cans of soup at paintings and gluing themselves to the sidewalk and and having a complete emotional meltdown. In the early days the the IPCC was sort of on the alarmist camp over against the Skeptics, in the sense that they were the ones trying to pull everybody away from a viewpoint like the one I hold. It was: No, you guys have to be worried about this. Look at these charts and see what we got to be worried about.
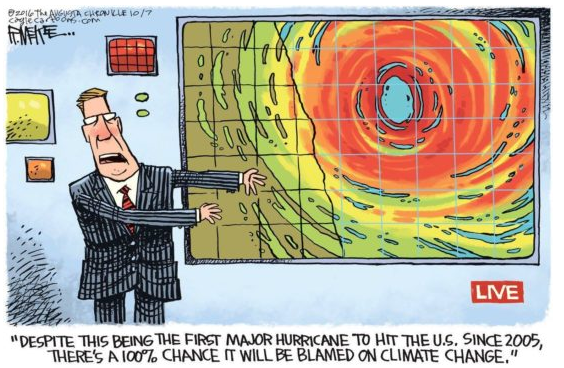
Now the alarm side has moved so far up the scale now that I think the IPCC is having to face the fact they have to begin to pull everybody back in you know my direction, our direction. So far, they’re not very good at that. Take for instance, discussions around hurricanes. You’ll get everybody from President Biden on down to some local weather caster on the the Channel 6 Nightly News confidently declaring that your tailpipe emissions caused hurricane Ian. And it’s your fault that all those homes are blown down. And you got the experts in places like NOAA and IPCC thinking: Oh we just put out a report that doesn’t say that that; in fact says the opposite. We don’t want to draw that connection and we can’t see a trend that would be consistent with that story.
But they say it in a very quiet heavily, coached language. For a long time they were happy to intervene early on when trying to fact check or, you know, counter messages from skeptics who were saying look this isn’t a big deal. They were happy to jump up and tell world leaders: No don’t listen to those guys, we tell you this is a big problem, blah blah blah.
Now they’ve got an even bigger problem with these crazy extremists saying all kinds of stuff that isn’t true and isn’t in their reports. What they should be doing is jumping up and saying to world leaders: Don’t listen to those guys, they’re nuts we we disavow that message. They’re not doing that and at this point they’re not yet capable of doing that.
Culturally within the IPCC, meaning the mainstream various branches such as the climate modeling groups, the atmospheric science groups and and oceanography groups. These are people that are all sort of comfortable with each other in terms of an overall set of assumptions. They may disagree on all kinds of other things, but culturally they’re comfortable with each other. And I think they’re all kind of looking at each other nowand saying; Well, somebody’s got to stand up here and and say that’s not actually what we are arguing.
But nobody wants to do that; nobody wants to be the one to actually speak out. Look what happened when someone like Roger Pielke Jr said, Okay I’ll do it. I’ll stand up and and debunk some of the nonsense around hurricanes and extreme weather. Then what happens: They discover they’ve got so many extremists and activists in their own ranks who then attack a guy like Roger Pielke Jr. And that sends a message to the whole rest of the climate Community:
Don’t be like Roger Pielke Jr. Or you won’t get to eat lunch with the cool kids either.
So they’ve got this police network now in the climate field who make it impossible for them to stand up and and distance the field from the kooky extremists. It’s gonna take a long time for that to get sorted out, but I think there’s a few Milestones that are coming up quickly.
One is that 2030 will be an interesting year because first of all there will not have been any major reductions in CO2 emissions between now and 2030.
Well there were some during the Covid recession but things quickly return to trend. This year’s winter in Europe their CO2 emissions will go way down. Because they’re all going to freeze to death due to their stupid policy decisions that have left them without a reliable energy supply.
But any emission reductions taking place in the West are small and sporadic, and are more than offset by emission increases in China and India and places like that. As industry just leaves the crazy places like Europe and well, Canada unfortunately, places where energy is being made prohibitively expensive. Heavy industry is just packing up and moving somewhere else so by 2030 we won’t have done the emission reductions that the extreme alarmists have been calling for but at the same time we won’t have experienced the climate changes that they’ve been warning about.
In all this language that came out a couple of years ago, we have until 2030 to prevent extreme climate damages in the apocalyptic vision that they created. We’re going to get to 2030 and people will have seen the price that they paid for climate policy, they will have experienced the harm, experienced these winters that we’re in for. Europeans especially are in for the next couple of winters where they don’t have enough fossil energy sources to get through.
And just the cost of living effects of climate policy and 2030 will come
and we won’t have experienced climate Armageddon.
And they won’t be able to turn around and say: Well yeah, but we avoided it because we cut emissions because we didn’t cut emissions either. And so that’s where I would hope there’ll be a certain Reckoning and maybe some of it will have happened up to that point.
But heading to that point we still have the problem that there are lots of people that see this narrative as unsustainable. This whole ESG movement, the climate alarmist movement, isn’t sustainable since it doesn’t make sense. But then someone like Stuart Kirk at HSBC stood up, even though he thought he had approval from his higher ups to make a speech at a finance conference that said none of us really believe in climate alarmism. And he had this great line about the previous speaker said something to the effect of that by 2030 you’re all going to die from climate extremes and none of you even looked up from your phones.
“And so you don’t believe it, I don’t believe it, our clients don’t believe it.”
And soon after he got sacked.
So we’re still at the point where the sensible people, and they’re fortunately still many of them, sensible people in positions of influence don’t yet know how to talk about this. They don’t yet know how to pull the discussion back onto sensible grounds. I’ll return to the point I was making in the beginning: The IPCC were supposed to be the objective scientific thinkers who just call it straight. I think they found it easy in the early days when they felt like their job was to up the level of alarm above what the general public felt. Well now the public has leapfrogged them and and they’re all falling for these crazy alarmist extremes. Well it’s IPCC’s job to fix that.
But culturally within the IPCC and the climate science movement, I don’t think they’re able to do it. And the few people who try seem to get their heads bitten off.
It will eventually come back on the IPCC when when it becomes clear that the alarmist message was way over the top. People will be entitled at that point to say: Well this is your job to put a the brakes on this and straighten people out. And you didn’t do it so how can we trust you now?
TN: Are there any other points you’d like to make?
RM: Sometimes people wonder why would an economist presume to talk about these things? It turns out climate science is a lot like economics in terms of the tools that people use. To a large extent it’s applied statistical analysis. And yes you have to know where your data comes from and you have to be able to interpret it. But the techniques are applied statistics and a lot of those techniques came out of econometrics or at least they came out of the same sources but a lot of the development of the technique has been in econometrics
It’s very hard for people in the climate field to follow those discussions because it’s a it’s econometrics it’s econometric Theory. I teach econometrics at the third year level and so I was just going through stuff I would expect my undergrads maybe the fourth year students to understand. But for a lot of people in the climate field you know this is the first time anyone’s really critiqued the theory behind that method.
It’s the kind of question Steve and I were asked with the Paleo climate stuff: Why are we doing this, why is why wasn’t it people in the field who noticed these flaws in the methods, who dug out the data figured out the method and pointed out the obvious flaws in it. So here I am 20 years after this technique was established I’m publishing a paper that says your fundamental results are invalid; you invoke the theorem incorrectly and your method does not generate unbiased and efficient results like you claimed. In fact it automatically fails the condition so you don’t know anything about what your results are.
TN: I was reading an article and a phrase in there mentioned 2100 expert climate economists. And I just thought that was mind-blowing; there’s such a thing as a climate Economist and there’s 2100 of them. Does that sound right to you? Like what would they do all day?
RM: When I started work in 1996 when I graduated from my PhD, there were only a couple of people who did anything to do with climate change. But like any field there’s a lot of money pumped into climate institutes and into universities to study climate change. So it’s not a standard field in the same sense as trade economics or labor economics or environmental economics would be. So a lot of people will call themselves climate economists now.
So a popular genre now would be impacts analysis. People will take climate model outputs at face value usually the RCP 8.5 scenario, which is garbage but they’ll use it anyway. And then they’ll look at some aspect of the economy, say that pineapple growers are going to experience a five percent reduction in output by 2100 because of climate change.
So there’s that group and among that group, kind of like the hockey stick crowd, where there was sort of an unstated prize for who can get the flattest handle the farthest back. In the climate economics group there’s an unstated prize for who can come up with a highest social cost of carbon. So you can tweak the models and get a social cost of carbon above two hundred dollars, and then above five hundred dollars. Can you get it above 800, and the higher you get, the the more likely your paper is to be into one of the nature journals.
The models that generate social cost of carbon: It’s pretty well known how they operate, and there’s a few knobs on them it’s pretty easy to adjust to get really high social cost of carbon numbers. And it’s also easy to get low social cost of carbon numbers. Then the question becomes, which of these assumptions are more defensible? That’s the part where the question typically doesn’t get asked.
I would guess that a lot of those 2100 climate economists don’t have a big picture approach to the field like they don’t necessarily see climate policy is embedded in the whole array of economic socioeconomic policies, where the ultimate question is what will make people better off on balance all things considered. Because you can get a lot of these young climate economists who will happily endorse Net Zero, even sign letters to the European Parliament encouraging them to pursue Net Zero.
And all they’ve ever studied is what would get us to Net Zero faster and more effectively. But they don’t step back and ask: Is NetZero a very good Target for us to pursue and is the cure worse than the disease? And what would be a climate policy that we could confidently say would be consistent with making people better off around the world over the next 80 years, all things considered?
There aren’t many economists that think about it in that framework. One one of them who does is William D. Nordhaus who won a Nobel Prize in 2018 for his work in climate economics. A lot of the activist crowd were jubilant, thinking finally the economists have noticed climate change. And look at William Nordhaus: He’s an advocate for carbon taxes he won the Nobel Prize. They don’t want to mention the fact that his modeling work showed that: We should do a bit of mitigation to eliminate some of the lowest value activities that generate greenhouse gas emissions, but otherwise the optimal policy is just to live with it and adapt to it. And that’s the upshot of his modeling work and it’s been a very robust result over the 20 or so years that he’s been doing this modeling work. And it convinced the profession enough that his papers are in the best journals and he won a Nobel Prize for it.
Yet as I say the implications are lost on people including a lot of people in this climate economics field that you refer to. Who somehow think the fact that William Nordhaus got the Nobel prize in economics means we should all rush to net zero, even though his own analysis would say absolutely not. That result is not defensible and would make us incomparably worse off and be worse than doing nothing; be worse than just ignoring the climate issue altogether and pursuing economic growth.
TN: I do wonder what percent of the climate economists think that it would be a great thing if we could get back to 280 PPM CO2 and whatever the temperature was in 1850 like end of the little Ice Age with shorter growing seasons etc. Because that seems completely insane to me as an outsider that we would want to spend trillions of dollars to do that, totally crazy yeah.
RM: I doubt even the most enthusiastic climate Economists, meaning the most worried about climate change and most wanting to push a net zero agenda; I think if you really pin them down, very few of them would say, yeah we should try to reverse engineer the 20th century and get back to 280 parts per million, if we could even do it.
Imagine if we could go back in time to 1800 or whatever and and present people with the choice: okay here’s here’s a future path, one where we don’t develop the use of fossil fuels, the economy stays roughly where it is now in terms of living standards, and the atmospheric concentration of CO2 stays at about 280 parts per million and it remains as cold as it is now. We could do that or here’s the other path: We develop fossil fuels, we grow our economies so by 2100 basically everyone around the world is living in a developed economy with a good standard of living and the atmospheric concentration of CO2 goes up to 500 parts per million, and we get a degree and a half or two degrees of warming.
If you presented that choice to people the answer would have been obvious. People would have chosen the path that we chose and halfway along it no one in their right mind would say, oh let’s go back to where we started and and not have all these changes. It’s literally the biggest no-brainer out there.
It was the development of industrial civilization, a net benefit to the world, and the proof is that the places where they didn’t experience that development are doing everything they can to experience it.
And all the supposed harms that people talk about, getting back to extreme weather which we talked about at the beginning: Where are people in the United States moving to? They’re all moving to the extreme weather areas, to the Florida coast and California coast and leaving behind the areas like the Midwest which have the four seasons but not exactly subject to tornadoes and hurricanes. As soon as they can retire they leave those places and go to where they they’ll either have heat waves in the desert or droughts in California or hurricanes on the Florida coast. And that’s where they want to retire to. And then when they get there they can become climate activists and protest greenhouse gases.
Iron Triangle of Public Crises
Postcript:
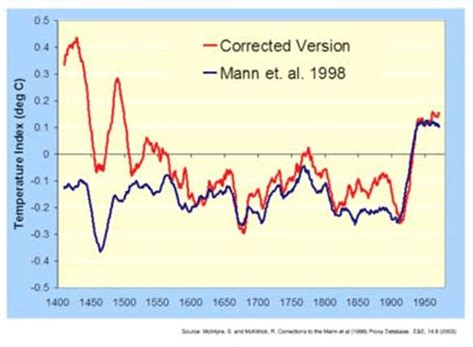
For more on McKitrick and McIntyre versus the Mann-made Climate hockey stick, see post:
The first graph appeared in the IPCC 1990 First Assessment Report (FAR) credited to H.H.Lamb, first director of CRU-UEA. The second graph was featured in 2001 IPCC Third Assessment Report (TAR) the famous hockey stick credited to M. Mann.
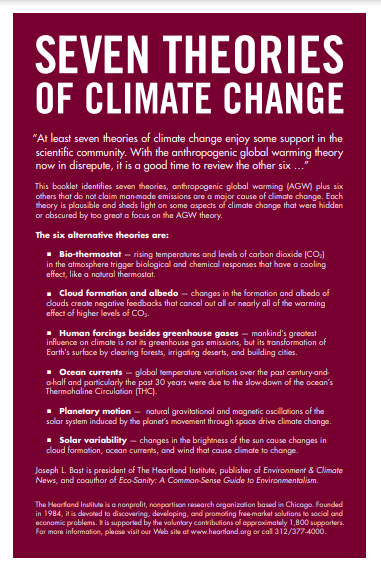
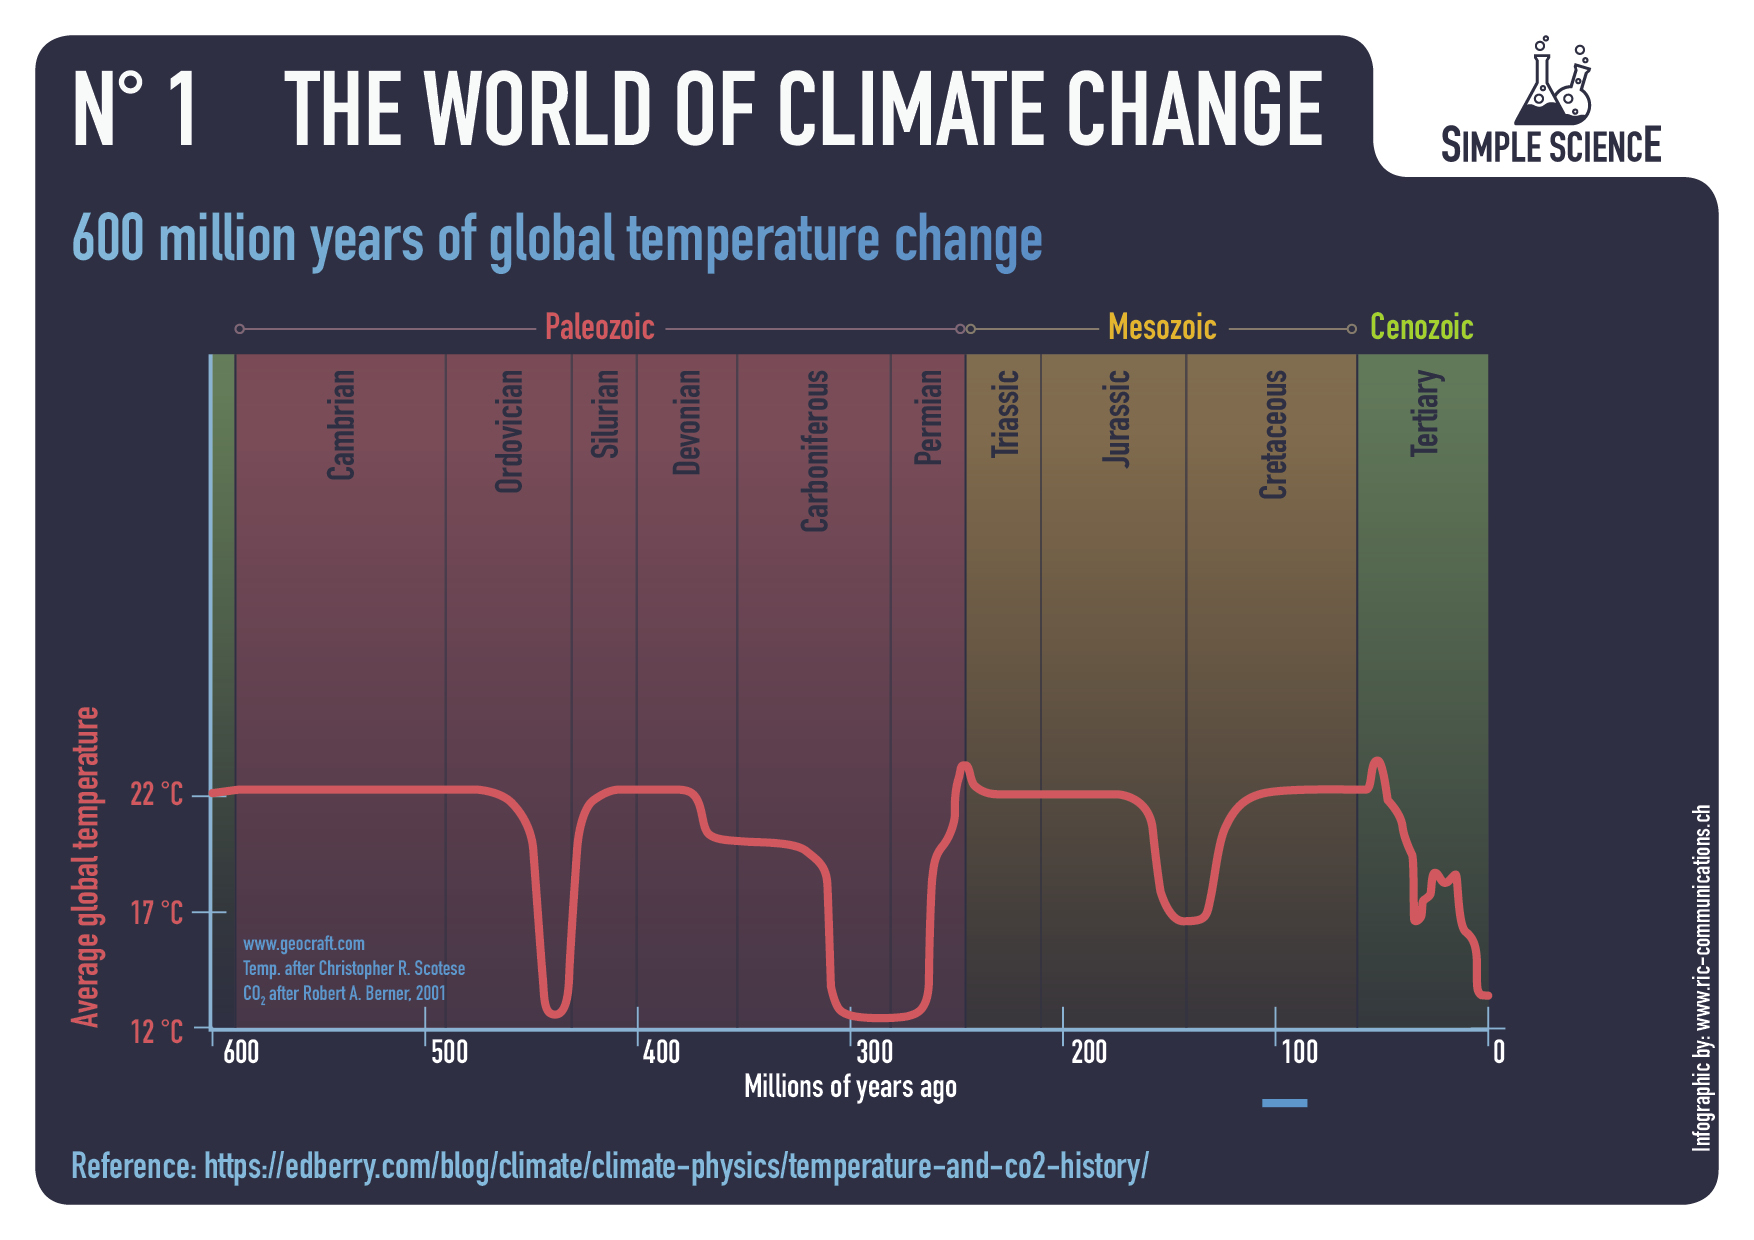
How long have we been talking about climate change now? On a grand scale at the latest since James Hansen’s appearance in the US Senate in 1988, when he explained that mankind’s use of fossil substances is causing the atmosphere to warm up. At least since this statement, climate change has been discussed as the greatest danger to mankind. But is the discussion on the right track or are we talking past key issues? Science would also like to clarify this question in a binding manner for so-called skeptics. To date, both groups are far from it. 12 years ago the Heartland Institute (HI), a voice in the skeptic camp,published a booklet on “7 Theories of Climate Change”, and the US Environment Protection Agency (EPA) a corresponding text, (updated: (08/19/22): “ Human Versus Natural Causes”.
Both explanations do not in any way indicate that they sufficiently take into account the fundamental mechanisms for short-term and long-term changes in atmospheric weather processes.
For analyzing the situation, the question is not about James Hansen’s 1988 Congressional testimony on CO2 induced global warming, or meanwhile the reasoning of the Intergovernmental Panel on Climate Change (IPCC, 2021) that “it is unequivocal that human influence has warmed the atmosphere, ocean and land”. The issue is: whether this point can be sufficiently understood, when the discussion is by far too narrow to address all actions by man with a potential of affecting the atmospheric system.
To do this, it is necessary to know how CO2 warming is currently differentiated from other potential causes and then to ask oneself whether this is sufficient to ensure a comprehensive risk discussion.
1. Bio-thermostat — rising temperatures and levels of carbon dioxide (CO2) in the atmosphere trigger biological and chemical responses that have a cooling effect, like a natural thermostat.
2. Cloud formation and albedo — changes in the formation and albedo of clouds create negative feedbacks that cancel out all or nearly all of the warming effect of higher levels of CO2.
3. Human forcing besides greenhouse gases — mankind’s greatest influence on climate is not its greenhouse gas emissions, but its transformation of Earth’s surface by clearing forests, irrigating deserts, and building cities.
4. Ocean currents — global temperature variations over the past century-and-a- half and particularly the past 30 years were due to the slow-down of the ocean’s Thermohaline Circulation (THC).
5. Planetary motion — natural gravitational and magnetic oscillations of the solar system induced by the planet’s movement through space drive climate change.
6. Solar variability — changes in the coronal ejections and magnetic fields of the sun cause changes in cloud formation, ocean currents, and wind that cause climate to change.
Discussion
(A)The topics in comparison
The topics (a-e) and (1–6) are widely comparable in substance, but only partly so in more precise individual points. With the topics (a+b and 5+6) one can ask oneself to what extent these are of importance in the upcoming discussion. Earth’s rotation is about hundreds of thousands of years. Also, the solar radiation does not fluctuate to an extent that causes significant climate changes in relatively short periods of time (50–200 years). The EPA states that satellites measured the amount of energy the earth has received from the sun since 1978 have not shown a net increase in the sun’s output, even as global surface temperatures have risen.
By and large the topics ( c) Changes in the Earth’s Reflectivity and (d) Changes in Naturally Occurring Carbon Dioxide Concentrations are differently presented, but address the same subjects as the HI topic 1+2.
Surprisingly HI doesn’t mention EPA’s point: Volcanic Activity (d); whereas it mentions instead (point 3): Human forcing by clearing forests, irrigating deserts, and building cities. Both areas are extraordinarily important for understanding the earth system, but do not reach the dimension of CO2-induced warming by far. Even the last great volcanoes, Tambora (1815) and Krakatoa (1883), brought weather changes only over a few years. Man will not be able to prevent volcanic activities. But the world should be prepared for that.
The points raised by HI in (3) are a far less dangerous aspect than vulcans; although one should nevertheless understand the connections. For example, the Romans certainly endangered their breadbasket in North Africa by cutting down forests from Spain to Turkey, and the deforestation large areas of the Northern Hemisphere since the 18th century, most likely contributed to the end of the Little Ice Age around 1850 and to the rise in global temperatures. As far as irrigating deserts and building cities are still relevant today, this hazard potential is far below that of a larger volcanic eruption.
(B)What is missing? Water in the Air! Water in the Ocean!
The great deficiency of the current ‘climate debate’ is the missing focus on water. We mean all water in the air, soil and the oceans. The ratio is that the ocean hold about 1000 times more than the atmosphere and the soil. Only mentioning the “Ocean currents” (Heartland point (4)) is only a minor aspect in the overall system that drives the enteral weather pattern. The EPA fails to mention this at all.
Understanding climate change without trying to understand global water masses
is like trying to bake a cake without flour.
This shortcoming also leads to constant reference to ‘natural causes’. The atmospheric system is governed by the laws of physics, nothing is natural. Instead, it would have to be more correctly admitted that the full mechanism is not (yet) understood. As it is unlikely that we will ever succeed in fully understanding the entire global water system, but that should not be an excuse to deny the priority of the water complex.
The discussion, as represented by the IPCC and EPA, but also by the so-called skeptics, such as the Heartland Institute, is still far away from this.
Fig. 7.1. Changes in the Atlantic Multidecadal Oscillation and solar activity are consistent with temperature changes. Top, above average solar activity reduces poleward transport causing warming. Bottom, the ascending half-period of the Atlantic Multidecadal Oscillation causes an even bigger reduction in transport and has a bigger temperature effect. Middle, temperature evolution for the past 120 years is consistent with the effect of these two factors on transport. Data from SILSO sunspots (top), HadCRUT4 deseasonalized temperature (middle), and AMO deseasonalized (bottom), have been smoothed with a gaussian filter.
A recent post was Seven Theories of Climate Change, summarizing an array of explanations for fluctuations in temperatures and precipitation over Earth’s surface. Now, thanks to Javier Vinós & Andy May, we have a new hypothesis combining solar variability with oceanic/atmospheric oscillations to explain the climate record. An introduction to their findings is published at Climate Etc. The Winter Gatekeeper Hypothesis (VII). A summary plus Q&A. Excerpts in italics with my bolds and some added images. My first exposure to meridional cooling was provided by Clive Best, and later on is a repost of that understanding consistent with Vinós & May.
Update September 24, 2022 at end Richard Lindzen Weighs In
A synopsis of the Winter Gatekeeper hypothesis
The IPCC assessment reports published since 1990, reflect a scientific consensus that natural forces, including solar activity and ocean-atmosphere oscillations, like the Atlantic and Pacific multidecadal oscillations, had a net zero effect on the observed global average surface temperature changes since 1951. The IPCC consensus does not allow for changes in the poleward (meridional) transport of energy to have significantly affected this average temperature over the past 75 years.
The Winter Gatekeeper hypothesis proposes that changes in the meridional transport of energy and moisture are the main way the climate changes now and in the past.
Meridional transport variability has many causes and forces that act simultaneously and in different time frames on the climate system. They integrate into a very complex poleward energy transportation system. Among these are multidecadal ocean-atmosphere oscillations, solar variability, ozone, stratospheric-reaching tropical volcanic eruptions, orbital changes, and changing luni-solar gravitational pull. Meridional transport is therefore an integrator of internal and external signals.
It is not the only way the climate changes, but evidence suggests it is the main one.
The Winter Gatekeeper hypothesis does not disprove greenhouse gas effect induced climate change—manmade or otherwise—in fact, it acts through it. But it does not require changes in the atmospheric content of non-condensing greenhouse gases to cause significant climate change. Therefore, it does refute the hypothesis that CO2 is the main climate change control knob.
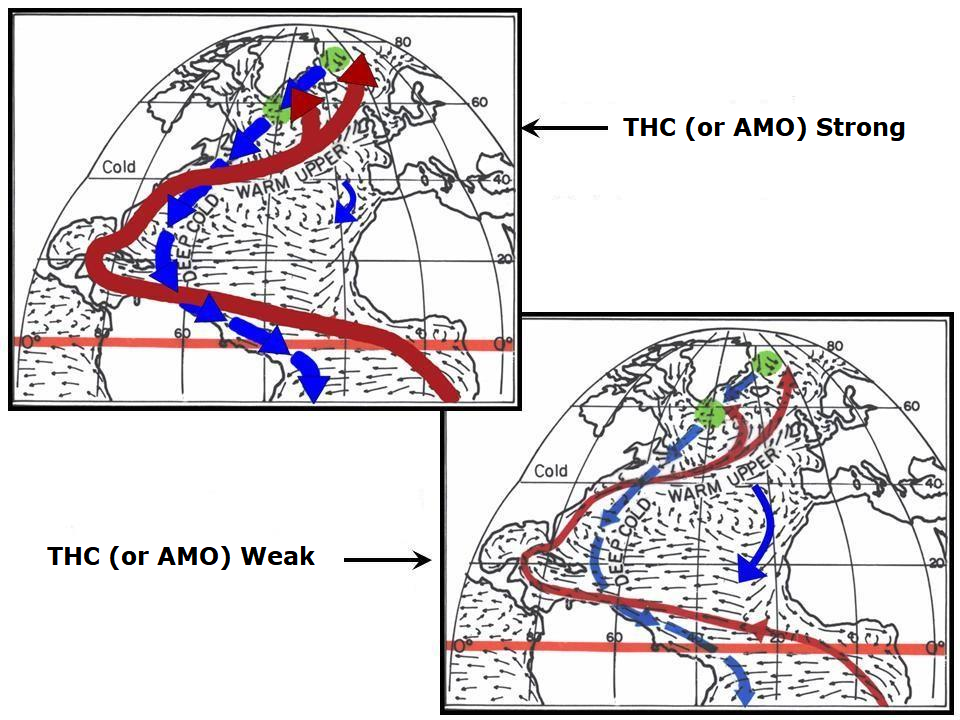
Meridional transport moves energy that is already in the climate system toward its exit point at the top of the atmosphere at a higher latitude. It is carried out mainly by the atmosphere, in both the stratosphere and troposphere, with an important oceanic contribution. The greenhouse effect is not homogeneous over the planet due to the unequal distribution of water vapor, and it is stronger in the wet tropics, weaker over deserts, and much weaker at the poles in winter. When meridional transport is stronger, more energy reaches the poles. There it can more efficiently exit the climate system, particularly during the winter, when there is no Sun in the sky. Most polar imported moisture in winter freezes, emitting its latent heat. Additional CO2 molecules increase outward radiation, as they are warmer than the surface. The net result is that all imported energy into the polar regions in winter exits the climate system at the top of the atmosphere (Peixoto & Oort, 1992, p. 363), and increasing the energy transported there at that time can only increase the loss.
When meridional transport is stronger, the planet loses more energy and cools down (or warms less) in a non-homogeneous way, because the net energy loss is greater in the polar regions. However, as more energy is directed toward the poles, the Arctic region warms, even as the rest of the world cools or warms more slowly. When meridional transport is weaker, less energy reaches the poles and exits the climate system. Then the planet loses less energy and warms, while the Arctic cools, because it receives less energy from the lower latitudes.
Figure 12: The effect of strong and weak Atlantic THC. Idealized portrayal of the primary Atlantic Ocean upper ocean currents during strong and weak phases of the thermohaline circulation (THC) Source: Bill Gray: H20 is Climate Control Knob, not CO2
Most of the energy is transported through the lower troposphere and ocean track. As a result, changes in multidecadal ocean oscillations produce a greater effect on climate in the multidecadal timeframe than changes in solar activity. Solar changes have a stronger effect on stratospheric energy transport. Even so, there is a non-well defined link between changes in solar activity and changes in the multidecadal oscillations that result in major multidecadal climate shifts right after 11-year solar cycle minima (see Part IV). Nevertheless, modern global warming started c. 1850, when the Atlantic Multidecadal Oscillation increased its amplitude and period (Moore et al. 2017). The overall multidecadal oscillation (aka the stadium wave) currently has a period of c. 65 years, and the 20th century included two rising phases of the oscillation, explaining its two warming phases (1915-1945, and 1976-1997; Fig. 7.1).
Meridional transport was further reduced during the 20th century by the coincidence of the Modern Solar Maximum (Fig. 7.1 at top): A long period of above average solar activity between 1935 and 2004. It is the longest such period in at least 600 years. Solar activity acts mainly on stratospheric energy transport, but since it affects the strength of the polar vortex and the El Niño/Southern Oscillation (see Part II), it also influences tropospheric transport.
As it can be seen in Fig. 7.1, most of the warming during the 20th century can be explained by the combined effect of the ocean multidecadal oscillations and the Modern Solar Maximum on meridional transport. No other proposed factor can satisfactorily explain the early 20th century warming period, the mid-20th century shallow cooling, and the late 20th century strong warming period, without resorting to ad-hoc explanations. In a single century two periods of reduced transport (warming), coincided with the ascent of the Atlantic Multidecadal Oscillation and the effect of the modern solar maximum.
This resulted in 80 years of diminished transport that contributed to the greatest warming in 600 years, triggering political and scientific alarm.
Background Post Arctic “Amplification” Not What You Think
HT to Dr. David Whitehouse writing at GWPF regarding a recent study claiming Arctic Amplification is causing a wavey polar vortex, resulting in winter warming and cooling extremes. His critique is Extreme cold snaps and global warming: A speculative explanation.
This post is challenging the notion of Arctic Amplification itself. The term is bandied about with the connotation that man-made global warming is multiplied in the Arctic and responsible for weather extremes.
As the animation above shows, there have been in recent years alternating patterns of unusually cold or warm weather in the Northern Hemisphere. There are several problems in the attempt to link these events to global warming/climate change, i.e. claiming causation from a slow increase in baseline global average temperatures.
Arctic Amplification is an artifact of Temperature Anomalies
Arctic Surface Stations Records Show Ordinary Warming
Arctic Warmth Comes from Meridional Heat Transport, not CO2
Clive Best provides this animation of recent monthly temperature anomalies which demonstrates how most variability in anomalies occur over northern continents.
1. Arctic Amplification is an artifact of Temperature Anomalies
Beyond the issues with the measurements and the questionable adjustments, there is a more fundamental misconception about air temperatures in relation to “climate change.” Clive Best does a fine job explaining why Global Mean Temperature anomalies do not mean what people think. Below is my synopsis of his recent essay entitled Do Global Temperatures make sense? (link)
Background: Earth’s Heat Imbalance
ERBE measurements of radiative imbalance.
The earth’s temperature at any location is never in equilibrium. It changes daily, seasonally and annually. Incoming solar radiation varies enormously especially near the poles which receive more energy per day in summer than the equator.
The earth cools primarily by moving heat from hot tropical regions towards high latitudes where net IR radiation loss cools the planet, thus maintaining a certain temperature profile.
Key Point: GMT Anomalies Are Dominated by the Highest Latitudes
The main problem with all the existing observational datasets is that they don’t actually measure the global temperature at all. Instead they measure the global average temperature ‘anomaly’. . .The use of anomalies introduces a new bias because they are now dominated by the larger ‘anomalies’ occurring at cold places in high latitudes. The reason for this is obvious, because all extreme seasonal variations in temperature occur in northern continents, with the exception of Antarctica. Increases in anomalies are mainly due to an increase in the minimum winter temperatures, especially near the arctic circle.
To take an extreme example here is the monthly temperature data and calculated anomalies for Verkoyhansk in Siberia. Annual temperatures vary from -50C in winter to +20C in summer. That is a seasonal range of 70C each year, and a year to year anomaly variation of ~8C is normal. The only global warming effect evident is a slight increase in the minimum winter temperatures since 1900. That is not due to any localised enhanced greenhouse effect but rather to an enhanced meridional heat transport. Temperatures in equatorial regions meanwhile have only ~4C seasonal variations, and show essentially no warming trend.
2. Arctic Surface Stations Records Show Ordinary Warming
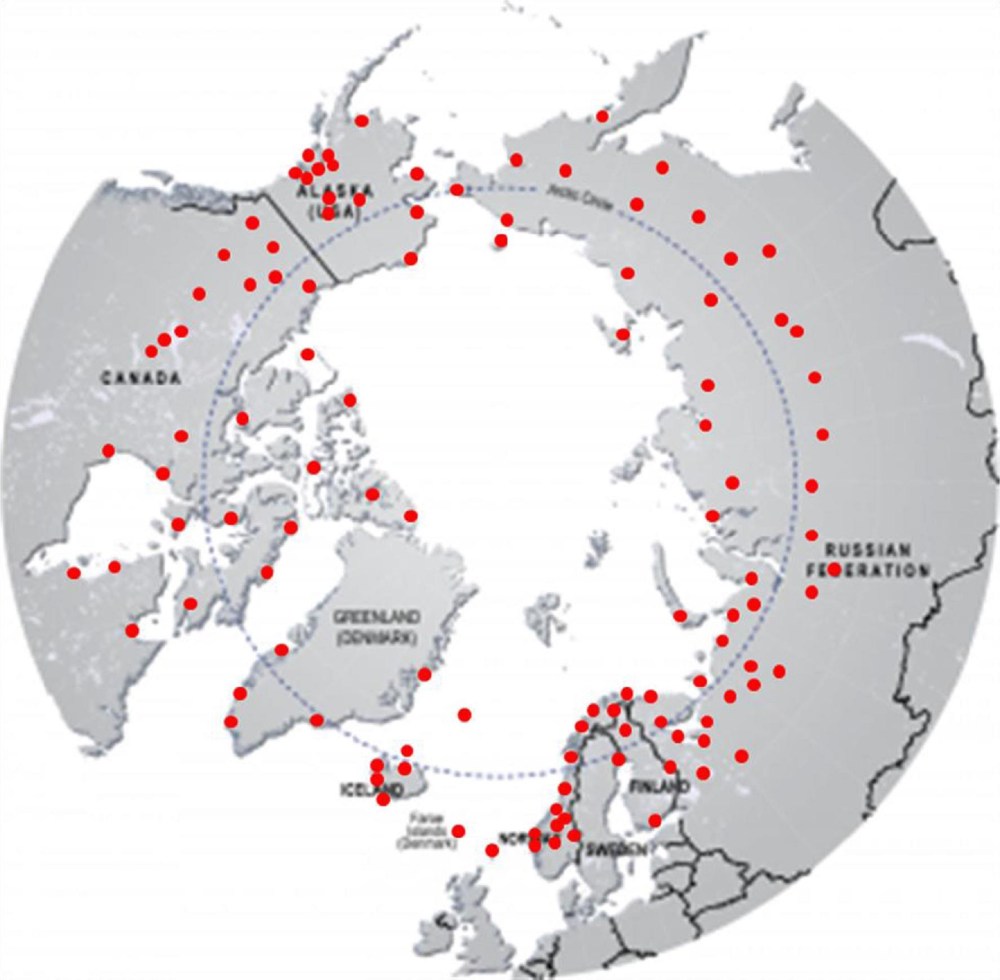
Locations of 118 arctic stations examined in this study and compared to observations at 50 European stations whose records averaged 200 years and in a few cases extend to the early 1700s
A recent extensive analysis of Northern surface temperature records gives no support for Arctic “amplification” fears.
The Arctic has warmed at the same rate as Europe over the past two centuries. Heretofore, it has been supposed that any global warming would be amplified in the Arctic. This may still be true if urban heat island effects are responsible for part of the observed temperature increase at European stations. However, European and Arctic temperatures have remained closely synchronized for over 200 years during the rapid growth of urban centres.
And the warming pattern in Europe and the Arctic is familiar and unalarming.
Arctic temperatures have increased during the period 1820– 2014. The warming has been larger in January than in July. Siberia, Alaska and Western Canada appear to have warmed slightly more than Eastern Canada, Greenland, Iceland and Northern Europe. The warming has not occurred at a steady rate. Much of the warming trends found during 1820 to 2014 occurred in the late 1990s, and the data show temperatures levelled off after 2000. The July temperature trend is even slightly negative for the period 1820–1990. The time series exhibit multidecadal temperature fluctuations which have also been found by other temperature reconstructions.
3. Arctic Warmth Comes from Meridional Heat Transport, not CO2
Key Point: Heat Distribution Changes, not Global Temperatures
Rising CO2 levels modify that radiation imbalance profile slightly. Surface temperatures in the tropics are not really warming at all. Any excess heat induces more clouds and more convection while surface temperatures remain constant. What really happens is that the meridional radiation profile changes. Slightly more heat is transported polewards so that hot places are shifting more heat to cold places which are doing the warming. If CO2 levels stop rising then a new temperature and radiation profile would rather quickly be reached. This is then called ‘climate change’ but any such changes are concentrated in colder regions of the world. The global ‘temperature’ itself is not changing, but instead the global distribution of temperature is changing.
Key Point: More Atmospheric Heat means Warming in the Coldest Places
Temperatures at the poles during 6 months of darkness would fall well below -150C if there was no atmosphere, similar to the moon. Instead heat is constantly being transported from lower latitudes by the atmosphere and ocean and so that temperatures never fall much below -43C. If more heat is transported northwards than previously, then minimum temperatures must rise, and this is what we observe in individual measurements.
Long term changes in temperature anomalies occur mainly in northern continents in winter months. This is not because the earth as a whole is warming up but rather that meridional heat transport from the equator to the poles has increased and the largest effect on ‘anomalies occurs in winter. The average absolute temperature of the earth’s surface is unknown. Basing the evidence for climate change on the 150 year trend in global averaged temperature anomalies still biases the result towards higher latitudes where most of the stations are located.
Summary
When heat is released into the atmosphere from the oceans, it is transported toward the poles to dissipate into space. Places in higher latitudes are warmed, not by radiative effects of greenhouse gases in those locales, but by the incursion of warmer air from the equator.
What happens if more CO2 is added into the atmosphere? No one knows, but there are many opinions, a popular one being that more heat is retained in the atmosphere. But in that case, that additional heat will be shed by the planet in exactly the same manner: transport to the poles with slightly less extremely cold air at the higher latitudes.
Why in the world would we pay anything to prevent a little bit of warming in the world’s coldest places?
London, 23 September – A prominent climate scientist has warned that the picture of climate change presented in the IPCC’s narrative is simplistic, ill-conceived, and undermined by observational evidence. In a new discussion paper, Professor Richard Lindzen of the Massachusetts Institute of Technology (MIT) points out that the official picture, focusing narrowly on carbon dioxide as a warming agent, becomes implausible when applied to the details of the climate system. According to Lindzen,
“If you are going to blame everything on carbon dioxide, you have to explain why, on all timescales, temperatures in the tropics are extremely stable while those in high latitudes are much more variable. The IPCC’s story is that small amounts of greenhouse warming near the equator are ‘amplified’ at high latitudes. But neither theory nor data support the idea of amplification.”
Instead, says Lindzen, this pattern – of stable tropical temperatures and fluctuating ones in high latitudes – is mostly a function of natural processes in the atmosphere and oceans; in other words, changes in oceanic and atmospheric currents that transport heat poleward while drawing varying amounts of heat out of the tropics. These changes in transport affect the tropics, but they are not determined by the tropics.
“The changes in the earth’s so-called temperature are mainly due to changes in the temperature difference between the tropics and the poles – at least for major changes. The changes in tropical temperature, which are influenced by greenhouse processes, are a minor contribution.”
Excerpts from the Introduction in italics with my bolds.
In the past few years, confidence in the AGW theory has declined dramatically. New research points to natural causes of the modern warming, and stabilizing (by some measures, falling) global temperatures have called attention to long-recognized shortcomings of the AGW theory. Tens of thousands of scientists have signed petitions expressing their dissent from the so-called “consensus” in favor of AGW. Opinion polls show a majority of the public in the U.S. and in other countries no longer believes human activity is causing global warming. Evidence of the decline of the AGW theory is presented in the postscript to this booklet.
The demise of the AGW theory makes this a good time to look at other theories of climate change put forward by prominent scientists but overlooked in the rush to judgment. This booklet identifies seven theories – AGW plus six others that do not claim man-made CO2 is a major cause of climate change.
Each theory is plausible and sheds light on some aspects of climate change that were hidden or obscured by too great a focus on the AGW theory.
In some respects these theories are not mutually exclusive: solar variability could be the sustaining force behind what I have called the “cloud formation and albedo” and “ocean currents” theories as well as being its own theory, though the mechanisms in each case differ slightly. Most physicists don’t study biology or chemistry and so don’t pay much attention to biological and chemical feedbacks. If they did, they would probably recognize that such processes play a bigger role in controlling climate than previously believed.
Deeper analysis also reveals that these theories are not all trying to answer the same questions or necessarily achieve predictive power. Trying to discern a human effect on climate is not the primary objective of biologists studying the effect of higher levels of CO2 on plants or of physicists measuring the amount of energy leaving Earth’s atmosphere. While they are “experts” on climate change, they are not part of the search for a “human fingerprint” on Earth’s climate. Nor are they qualified to make predictions based on their narrow expertise, as Kesten Green at the University of South Australia and J. Scott Armstrong at the Wharton School of the University of Pennsylvania have tried to explain.
The six theories of climate change that do not involve
man-made greenhouse gas emissions
are incompatible, though, with the AGW theory.
If evidence exists that negative feedbacks offset whatever warming is caused by man-made greenhouse gases, then the warming during the past 50 years could not be due to the burning of fossil fuels. Similarly, if solar variability explains most or all of the variation in temperatures in prehistoric as well as modern times, then there is no room for speculation about a large role for man-made CO2 .
Over time, the science of climatology will become somewhat more exact, based on examination of the historical record and newly assessed empirical evidence. It probably will not be illuminated much by mathematical models that cannot generate reliable forecasts of a system that even proponents of the anthropogenic global warming theory admit is naturally chaotic. We cannot adequately measure the enormous quantity of data necessary to feed the models, and we are not even sure which variables should be included.
The uncertainty that pervades climate science today,
as climate scientist Mike Hulme has written,
is a function of the limits of science itself.
The object of this essay is not to say which of these seven theories is right or “best,” but only to present them to the reader in a format that allows reflection and balanced consideration. Such dispassionate interest in the subject has been lacking in recent years, and the scientific debate has suffered for it.
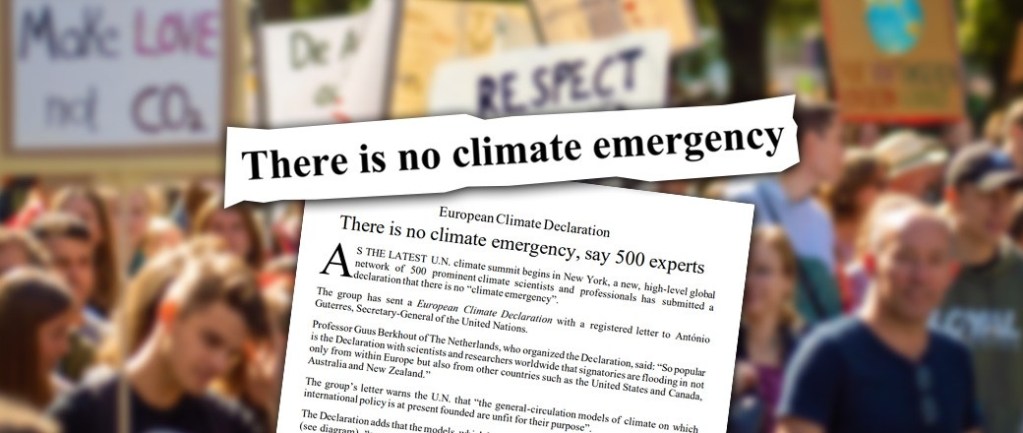
The World Climate Declaration (Global Climate Intelligence Group) follows:
There is no climate emergency Climate science should be less political, while climate policies should be more scientific. Scientists should openly address uncertainties and exaggerations in their predictions of global warming, while politicians should dispassionately count the real costs as well as the imagined benefits of their policy measures.
Natural as well as anthropogenic factors cause warming. The geological archive reveals that Earth’s climate has varied as long as the planet has existed, with natural cold and warm phases. The Little Ice Age ended as recently as 1850. Therefore, it is no surprise that we now are experiencing a period of warming.
Warming is far slower than predicted. The world has warmed significantly less than predicted by IPCC on the basis of modeled anthropogenic forcing. The gap between the real world and the modeled world tells us that we are far from understanding climate change.
Climate policy relies on inadequate models Climate models have many shortcomings and are not remotely plausible as policy tools. They do not only exaggerate the effect of greenhouse gases, they also ignore the fact that enriching the atmosphere with CO2 is beneficial.
CO2 is plant food, the basis of all life on Earth CO2 is not a pollutant. It is essential to all life on Earth. More CO2 is favorable for nature, greening our planet. Additional CO2 in the air has promoted growth in global plant biomass. It is also profitable for agriculture, increasing the yields of crops worldwide.
Global warming has not increased natural disasters There is no statistical evidence that global warming is intensifying hurricanes, floods, droughts and suchlike natural disasters, or making them more frequent. However, there is ample evidence that CO2 mitigation measures are as damaging as they are costly.
Climate policy must respect scientific and economic realities There is no climate emergency. Therefore, there is no cause for panic and alarm. We strongly oppose the harmful and unrealistic net-zero CO2 policy proposed for 2050. Go for adaptation instead of mitigation; adaptation works whatever the causes are.
Our advice to the European leaders is that Science should strive for a significantly better understanding of the Climate System, while Politics should focus on minimizing potential climate damage by priortizing adapation strategies based on proven and affordable technologies
COP27 is several months ahead. The world is recommitting itself to fossil fuels, while only government largesse keeps the wind/solar/battery gravy train going. Global Climate Intelligence Group’s World Climate Declaration stands as a beacon light to a wholly different approach of free-market adaptation, not government mitigation.
H/T to Ghengis for reminding me of this insightful analysis of the climatist ideology. The GWPF publication is here: GLOBAL WARMING A case study in groupthink My transcript of the video is below in italics with my bolds and added images.
For most of the last 30 years climate change has been called settled science. As letters, observations and scientific advances have shed more light on the problem, it became clear that many of the most alarming and urgent fears about the effects of global warming were unfounded.
These dramatic stories were not just the work of fringe activists. World leaders and internationally renowned scientists too often departed from science to speculate about how terrible the future would be.
“Heat waves, droughts, wildfires, floods all are now more frequent and more intense.” -Obama
But when the truth of these stories was discovered very few politicians attempted to bring a sense of calm or reason to the political debate.
“Global warming is man-made and it’s happening. We’re all agreed that climate change is one of the greatest and most daunting challenges of our age.”
“The scientific reality is compelling us to act. We are on the course for a very, very dangerous world over the next century.”
“The scientific evidence is stronger than ever, and science itself has been slow to correct alarmist claims.”
“Human influence on the climate system is clear.” (IPCC)
Even worse attempts to question the scientific basis of scare stories has been met with hostility.
“We don’t need another meeting of the Flat Earth Society. We need to get on and tackle climate change.”
Given the emphasis placed on science, data and evidence in the debate, how is this possible?
One answer might be a theory formulated in 1972 by psychologist Irving Janus. He argued that groupthink occurs when a single-minded group dominates a decision-making process, excluding alternative perspectives and criticism. Janus discovered that groupthink was the cause of many catastrophic failures of military planning. Groupthink theory is the basis of a new report by Christopher Booker for the Global warming Policy Foundation
Booker looks at the history of climate change consensus building, policymaking and coverage of the issue in the media. Three rules of groupthink emerge from this historical view. Booker finds that though a consensus on the role of anthropogenic global warming did emerge, this consensus was not dominant in official thinking and coverage. Scientists as well as politicians, campaigners and journalists told stories that owed much more to speculation than to settled science.
“We have built a society, an agricultural system and cities. And everything that we do based on assumptions that basically the climate is not going to change. Eventually this is going to be a problem that is so large that we will transition . . .”
“But after damaging scandals at East Anglia University and the UN’s Intergovernmental Panel on Climate Change, it is Mr Miliband’s side who need to change their approach.”
These unfounded stories cost serious setbacks for the climate agenda.
“Or we can choose to believe in the overwhelming judgment of science and act before it’s too late.” (Obama)
Increasingly in cases where mainstream thinking was shown to be wrong, it was defended from criticism not on its scientific merits but on the basis of the scientific consensus that climate change is real, is happening and will be dangerous.
“But they’re wasting everybody’s time on a settled debate. Climate change is a fact.” (Obama)
“Of the scientists who expressed a view, ninety-seven percent said that climate change was happening and it was human-made activity.”
“Certainly of course that has been substantially discredited.” (Hugh Mathers)
“Isn’t it exactly the stifling of dissent that has got the climate scientists into this mess in the first place? Why are you going down this road again?”
“Oh, I’m not trying to stifle dissent, Krishnan, but you’ve got to make the judgment: When there’s a mistake does it undermine the basic facts about climate science?”
Even where criticism of alarmism has come from inside the consensus it was excluded from public debate rather than allowed to improve scientific understanding. Consequently without debate, climate change became the explanation for ever more things from poverty, migration, to war and even mental illness.
“There are a number of statements that have been attributed to me that are not correct. I don’t believe I called anybody here a denier, and yet that’s been stated over and over again. So I’ve been misrepresented quite a bit today by several.” (Michael Mann)
“But it’s in your written testimony. I’ll read it again.” (Judith Curry)
The growing distance between climate stories and reality led to increasingly hostile public campaigns against dissenting opinions.
Scientists openly criticizing climate change alarmism have been forced into silence under the threat of losing their jobs. Dissent in the media has led to campaigns to remove skeptics from public attention and for increasing control over the media.
“I complained about this article and have just heard from the media self regulator that they found nothing wrong at all with the newspaper article. And so I wrote to them and complained. I complained to the Press Complaints Commission there have even been calls for climate skeptics to face criminal prosecution and even the death penalty.”
“Right kids, just before you go, there’s a brilliant idea in the air that I’d like to run by you . . .”
The insistence that everyone in the public sphere must adhere to the consensus has harmed research, political debate and journalistic coverage of climate change. The result of such climate change groupthink may be the least scrutinized, most expensive and counterproductive policies ever conceived. To find out more about how groupthink has been confused for the scientific consensus on climate change download the report from the G WPF website.
The UN and WEF have declared a War on Fertilizers with conflicts erupting in Sri Lanka, the Netherlands and Canada. Fear of “greenhouse gases” provide the moral justification for mandating reductions in the production and use of fertilizers.
This will in turn deprive many farmers of their way of life. As a group, farmers belong to the “yeomanry” social class: independent, self-reliant small businessmen and women who don’t trust government and want it only to leave them alone. This makes them (like truckers) public enemies no.1, according to the control freaks increasingly entrenched in public authorities.
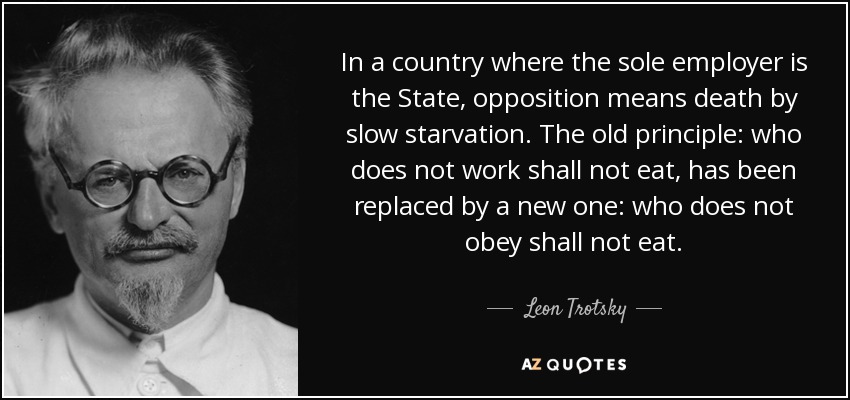
Most important is the objective to take over and regulate the food supply, along with governmental direction of the energy sector. The reason for this was well articulated by Leon Trotsky decades ago.
The United Nations Environment Programme (UNEP) describes itself as “the global authority that sets the environmental agenda… and serves as an authoritative advocate for the global environment.” Through its “Economics of Ecosystems and Biodiversity for Agriculture and Food” program launched in 2014, the UNEP advocates that nations “steer away from the prevailing focus on per hectare productivity.”
But today the world is in its worst food crisis since 2008.
The number of people suffering acute food insecurity increased by 25% since January 2022 to 345 million, according to the United Nations World Food Programme. Why, then, is the UNEP trying to steer nations away from fertilizers that increase food production?
The UNEP’s Acting Director in 2019 said the reason was humankind’s “long-term interference with the Earth’s nitrogen balance.” In October of that year, the UNEP hosted a meeting in the capital of Sri Lanka, Colombo and issued a “road map” to push nations to cut nitrogen pollution in half.
But the Netherlands proves that nations can slash nitrogen pollution
from livestock by 70% while also increasing meat production. Same for crops.
Since the early 1960s, the Netherlands has doubled its yields while using the same amount of fertilizer. While rich nations produce 70 percent higher yields than poor nations, they use just 54 percent more nitrogen.
One month after the Colombo meeting in 2019, which generated significant media attention in Sri Lanka, voters in that nation elected an anti-fertilizer president, H.E. Gotabaya Rajapaksa, who claimed, without scientific evidence, that synthetic fertilizers were causing kidney diseases. In April 2021, he banned fertilizer imports.
In June, 2021, two months after the fertilizer ban, Sri Lanka hosted a UN-sponsored “Food System Dialogue” aimed at influencing the UN’s broader anti-fertilizer agenda for the world. “Sri Lanka’s inaugural Food System Dialogue is part of a series of national and provincial dialogues conducted by the Ministry of Agriculture ahead of the 2021 UN Food System Summit set to take place in New York later this year.”
Netherlands and Canada Invoke Nitrous Oxide (N2O) Hysteria
LifeSiteNews While the event went mostly unreported, a large group of Canadians formed a convoy late last month in Winnipeg, Manitoba to voice their support for Dutch farmers currently protesting their government’s fertilizer reduction policies.
In the footage, many of the vehicles can be seen donning the Netherlands flag, with some of the flags being flown upside-down, which is a practice done throughout the world as a way to signal distress.
One large tractor had a sign on it that read, “No fertilizers, No Farmers, No food,” while a pick-up truck had a sign reading, “Government is lying. Fight for freedom.”
Under the guise of “climate change,” Rutte and his government have created a “nitrogen and nature” ministry to curb nitrogen oxide and ammonia emissions in the country, and told farmers that failure to comply with the new policies would lead to an expropriation of their land.
According to the Dutch farmers, compliance with the policies would mean far smaller crop yields and insufficient food production – nitrogen and ammonia are integral ingredients in fertilizers – and would lead to a massive loss of income or having to sell their farms altogether.
Despite the pleas of thousands of farmers to have the implementation of the policies reconsidered, Rutte dismissed the group as “small” and “unacceptable,” echoing the statement made by Canadian Prime Minister Justin Trudeau earlier this year, when he called the anti-COVID mandate “Freedom Convoy” protesters in his country a “small, fringe minority.”
In addition to the similar attitude they express to disgruntled citizens, both politicians are members of the World Economic Forum, and have both signed their countries up for the United Nations 2030 Agenda for Sustainable Development.
In fact, a December 2020 press release from Canada’s Minister of Agriculture and Agri-Food shows that Trudeau has been planning to implement fertilizer policies similar to those being imposed by Rutte for quite some time.
“Fertilizers play a major role in the agriculture sector’s success and have contributed to record harvests in the last decade. They have helped drive increases in Canadian crop yields, grain sales, and exports,” the Trudeau government’s release states.
“However, nitrous oxide emissions, particularly those associated with synthetic nitrogen fertilizer use have also grown significantly. That is why the Government of Canada has set the national fertilizer emissions reduction target, which is part of the commitment to reduce total GHG emissions in Canada by 40-45% by 2030, as outlined in Canada’s Strengthened Climate Plan,” adds the release, which includes references to “the 2030 Agenda” and the U.N.’s “17 Sustainable Development Goals.”
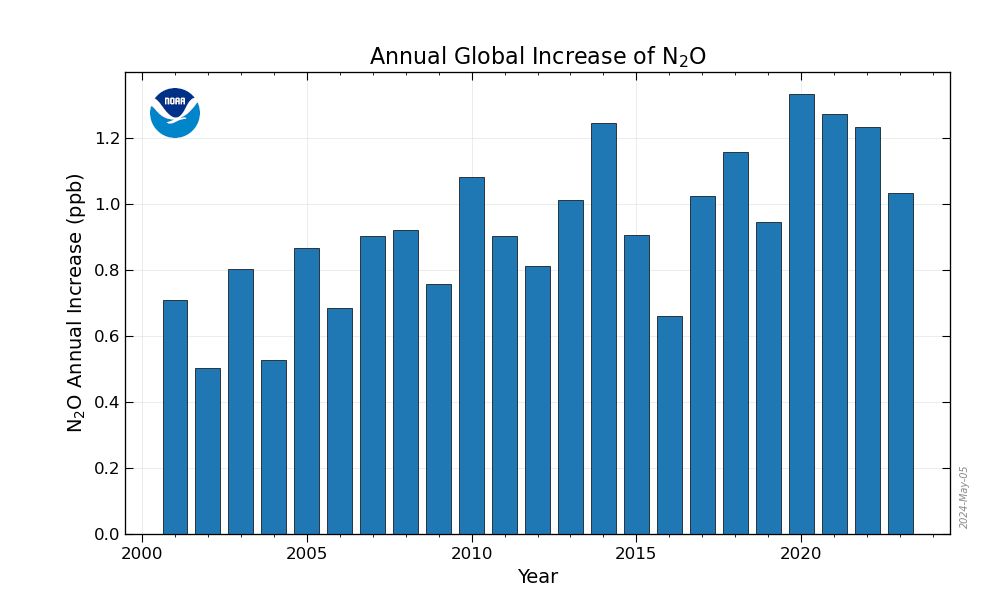
The World of N2O
Just as CO2 is a small part of a planetary Carbon Cycle, so too is N2O an even smaller part of a global Nitrogen cycle. Some charts below provide a perspective on how N2O fits into a larger picture.
Sources of Atmospheric N2O
Source: Global Carbon Project
The chart above shows several important things to know. First, the atmospheric inputs of N20 from natural sources are about 60% and human sources 40%. Note that the estimates of inputs have a range of +/- 20% for natural sources, and +/- 50% for human sources. Over time N2O breaks down into the main atmospheric gases N2 and O2. No uncertainty is provided for the removal of N2O, leading to suspicion it is not measured but calculated to make a balance.
The second chart informs on the scale of N2O concentrations. At first glance, it appears comparable to CO2, but on closer inspection the amounts are in ppb (parts per billion), not ppm (parts per million) as with CO2. To get comparable amounts requires dividing by 1000, thus the vertical axis goes from 0.315 ppm to 0.340 ppm. Yes, the dramatic rise over the last 22 years is 0.025ppm.
Then we have the annual global increase of N2O from all sources ranging from about 0.5 to 1.3 ppb. Does anyone believe they can measure N2O down to 0.0005 ppm?
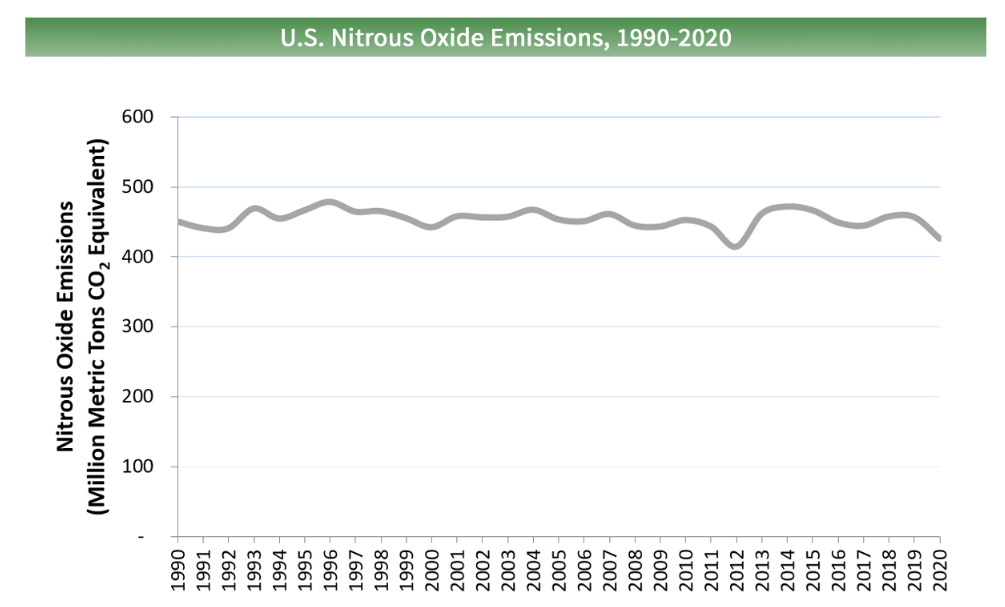
Then there is the matter that Nitrous oxide emissions in the United States decreased by 5% between 1990 and 2020. During this time, nitrous oxide emissions from mobile combustion decreased by 61% as a result of emission control standards for on-road vehicles. Nitrous oxide emissions from agricultural soils have varied during this period and were about the same in 2020 as in 1990. So any increases came from elsewhere, including the majority natural sources.
About Global Warming Potential
IPCC puts out a table like the Ten Commandments listing the Global Warming Potential (GWP) of all the “greenhouse gases.” CO2 is assigned “1”, and all others are given a number as a multiple of CO2. As noted above N2O is assigned ~300, making it a fearful GHG, depending of course on how much warming CO2 actually generates.
Source: GHG Institute
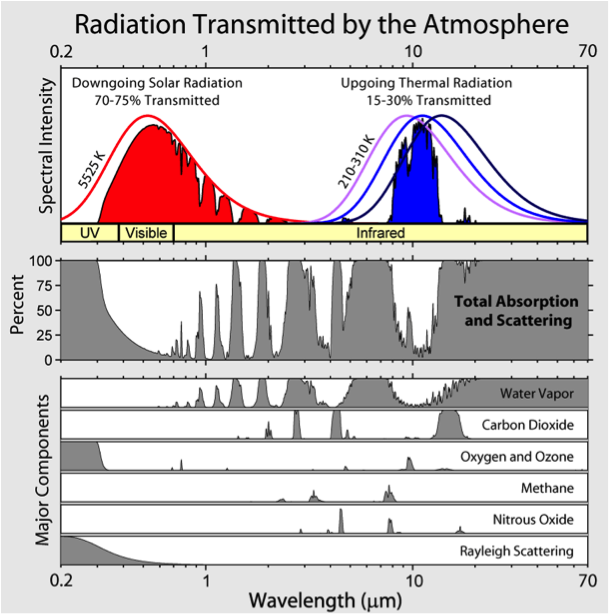
There are no details on the N2O GWP calculation of 300, but one suspects it is mainly due to the projected long residence time (100+ years) compared to about 5 years for CO2 (much shorter for CH4). But no matter the half-life of N2O, consider the above absorption spectra of ghgs. Note that N2O has no peaks, more like three pimples, all on the low energy longer IR wavelengths. Moreover, the one at 4.5m overlaps entirely with CO2, the second at 7.9m is overwhelmed by H2O, and the third at 17.0m can only absorb what CO2 has not.
Getting Perspective on N2O Climate Fear
The Claim: Nitrous Oxide is claimed to be a GHG 300 times as powerful as CO2; claimed to cause 7.5% of warming effect. Nitrous oxide is a potent greenhouse gas with an atmospheric half-life of 120 years. Environmentalists and ecologists share the consensus that there should be an 80% reduction in the total greenhouse gases below the 1990 level.
The Facts:
Start with a wholistic picture of IR active gases (so-called “GHGs”) . H20 is 95% of all such gases, water vapor in the atmosphere ranging from 0 to 4%. CO2 is a trace gas by comparison, 4% of GHGs, at 400 ppm, amounting to 0.04% of the atmosphere, presumed to be well mixed in the troposphere.
Consider that claimed N2O IR activity is less than 1%. And in fact constitutes roughly 1/1000 of the gold blocks representing CO2. An earlier graph showed N2O is presently ~ 0.340 ppm, or 0.00034% of the atmosphere.
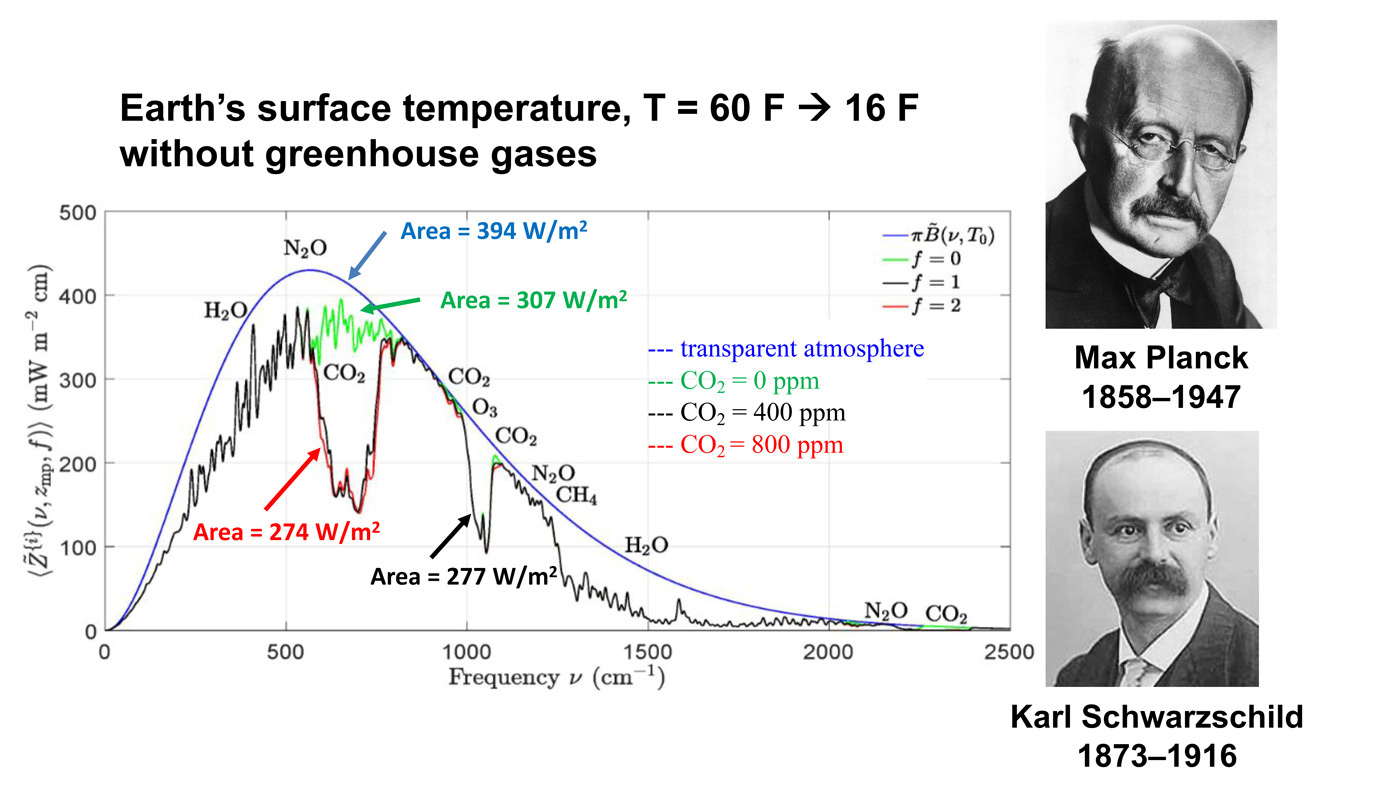
Add in the estimation by Dr. Happer regarding IR activity in our atmosphere. The black line shows gases absorbing radiation at various wavelengths from near IR on the left (shorter wave, higher energy) to far IR on the right (longer wave, lower energy). The big black line notch in the 600s is CO2 absorption in its modern concentration of 400 ppm. The red line shows what will be the absorption should CO2 double in amount to 800 ppm. [See Climate Change and CO2 Not a Problem]
Notice that the difference between the red and black lines is miniscule. Notice also the microscopic effects of N2O across the spectrum. Mathematically, 300 times miniscule = negligible.
Summary
This is a bogus war on fertilizers, farmers and food. Everything is exaggerated for the sake of an extreme agenda to impose controls on free enterprise developed societies. It is true that use of fertilizers results in some release of N2O into the air, but even this has been overstated. And as the video demonstrates, farmers have a vested interest in using fertilizers wisely and are applying techniques that improve efficiency. As well, there is evidence of efficiency gains in the process of producing ammonia and then urea from air and natural gas. The attack on food supply is in effect an effort to reduce the population.
Michael Foley writes at Quora(Excerpts in italics with my bolds and added images.)
Q: Why do most scientists believe that the climate is changing?
A: Because it is. But most scientists do not believe
human activity is the cause of the change.
The 97% of scientists belief fraud, which has been proven to be a fraud over and over again, was based on a review of the scientific literature on climate. Over 10,000 papers were reviewed and of those only about 2,000 mentioned climate change of those 1,900 were eliminated for various reasons (some of those reasons were bias based) resulting in 100 papers. Of those 100 papers 97 concluded that man’s activity may have a roll in climate change. They ranged from very likely to maybe, which is what came to be reported as the 97% figure.
There is no argument that the climate is changing,
it always has and will always continue to change.
From ice cores and ocean sediment cores it has been established that the earth has regular and generally predictable 2 major climate cycles. They are classified as a Greenhouse cycle (defined as a period where there are NO PERMANENT ice sheet anywhere on earth) and Ice Ages ( defined as periods where there are permanent ice sheets in at least 1 Hemisphere).
Each of these major cycles has several sub cycles. Ice ages have 2 major sub cycles called Interglacial and Glaciation. 73% of earth’s existence has been during a a Greenhouse period. The remaining 27% has been in at least 5 ice ages. We are currently in an Ice age. To be more exact we are living in an Interglacial phase of the current Ice age which has been going on for around 11,500 years. The 2 subcycles also have additional subcycles which last on average of 500 years. The two last such mini cycles are known by the names the Little Ice Age and the Medieval Warm Period.
The little ice age ended in the late 1800’s with 1880 being the generally used end date. Interesting enough climate alarmists almost exclusively use this date as the start date for any chart or graph they use in support of their theory. It is also important to realize that man made global warming (by burning fossil fuels and thereby contributing to atmospheric CO2) is a theory and has such remains an unproven theory.
Despite the claim of some who say the science is settled and that there is a scientific consensus.
Both of these claims should raise red flags for anyone who has even an elementary school level of science education. For starters, science is NEVER settled, our scientific understanding and knowledge is constantly changing and theories that have been accepted for decades, centuries and millennia are proven false or modified almost daily. For example, the Big Bang theory is no longer a credible theory of how the universe started. But is still generally accepted in the general public. Secondly, science is not about a consensus period. Science is a search for the true. Either a theory is true or it is false. In order for a theory to reach a level of scientific acceptance requires the use of the scientific method, which involves testing the theory and retesting, them releasing all the information and data gathered in the testing to allow it to be reviewed by others and allowing others to try and duplicate the original experiment.
If just one of these efforts fails to confirm the results of the original finding theory is not validated. Therefore a consensus believing something is the case is irrelevant.
A consensus used to believe that the earth was flat, that the earth was the center of the universe, that the sun orbited around the earth and each of these beliefs were strongly defended. When you look at the efforts of the climate alarmist research and testing of their theory you find that not one of their efforts has resulted in a conclusion that the theory is correct. Not only that but those experiments that have claimed to support the theory have never released their data sets or methodologies for review.
The first graph appeared in the IPCC 1990 First Assessment Report (FAR) credited to H.H.Lamb, first director of CRU-UEA. The second graph was featured in 2001 IPCC Third Assessment Report (TAR) the famous hockey stick credited to M. Mann.
The most famous of these is Michael Mann’s hockey stick graph that purported to show a relatively stable climate prior to the mid 1900’s. This graph became the poster child for the UN’s IPCC 1st climate assessment report. Man refused to release the data sets he used or let others review his methods or computer programs that came up with the hockey stick. However, Mann’s hockey stick graph eventually was proven to be a fraud. The IPCC quietly dropped it from their 3rd assessment. Each IPCC assessment has adjusted the predicted climate change downward to where the latest report has a predicted climate change resulting from human activity to be 2 to 3 degrees C over the next 100 years.
The original MBH graph compared to a corrected version produced by MacIntyre and McKitrick after undoing Mann’s errors.
However, even that amount remains nothing more than a computer model prediction which has not been proven.
Why so many people are so willing to accept a theory without any evidence and are so willing to accept the demanded changes to how we live with no evidence is a truly remarkable thing. Climate alarmist will point to every weather event as proof of man’s destruction of the planet. Even when the science has proven time and again that the supposed weather events are in fact well within the natural cycle of events. All of these claims and efforts are efforts to bring within the human experience (life time) evidence of climate change and the man made use of fossil fuels has the cause.
Even though NONE of the predictions made over the last 50 years has come to fruition. NOT ONE OF THEM. How can a group promoting and claim and being wrong every single time still be consider credible, is simply incredible. Some, maybe most are sincere in their belief but instead of using the evidence that is available they are simply Lemmings. Others, the politicians and those with an economic stake in turning the economy upside down are acting out of basic greed. Greed for power and money.
Climate changes occur on geologic timeframes,
which are measured in thousands and millions of years, not in human life times.
The climate cult never sleeps, and when they see nations in crisis they are always quick to try to exploit the situation by misrepresenting the root problem.
A heat wave is currently hitting Europe along with wild fires and the mainstream media is beating the global warming drum hard. This is nothing new; every time the weather gets hot they cry “climate change!” Every time the weather is extra cold they once again cry “climate change!” The evidence? What about the “record heat” in parts of UK, Spain and Portugal? This is surely proof that the weather is being ruined by that terrible menace known as man-made carbon?
Of course, what they don’t tell you is that the official record for weather and temperatures used by climate scientists only goes back about 140 years (it started in the 1880s). So, millions upon millions of years of Earth weather, and they only count 140 years of it to determine “record temps?” They tend to ignore ice core and tree ring data from centuries ago that indicate much hotter warming periods in our planet’s history (none of which were caused by man-made carbon emissions). In comparison, today’s temperatures are rather tame.
The Earth’s overall temperatures have only risen by 1° Celsius in the past century; this was actually the peak and currently temps have evened out to an increase of 0.8°C. This is the great climate doomsday we are all supposed to be terrified of. This is the looming threat we are supposed to sacrifice all fossil fuel based energy production for – Less than a single degree of heat.
Global warming theory claims added CO2 systematically raises surface temperatures. On the contrary all of the recent warming is episodic, associated with oceanic El Nino events.
It’s important to put the frantic climate change narrative into concrete perspective because the vast majority of climate science is paid for by governments and special interest organizations like the UN, the World Economic Forum and many other globalist groups with an agenda in mind. On average, these governments and institutions spend around $632 billion per year on climate research funding and climate policy initiatives (which they call “meager”). Their goal is to increase this cash flow to $4 trillion by the year 2030. The incentives to jump on the man-made climate change train are MASSIVE; there is almost no monetary incentive for scientists that want to study other potential causes for climate events.
The notion of the stalwart and incorruptible scientist that seeks objective truth rather than cash and notoriety is long dead. Honest scientists are few and far between these days (especially in the medical and climate science fields), and perhaps it has always been that way. The “experts” cannot be blindly trusted because they are just as susceptible to bias and corruption as anyone else.
Climate change hysteria is a nothing burger, but it is being actively promoted by the media to obscure very real threats that the public faces in the near term.
One of those threats is energy shortages, and climate regulations have put a stranglehold on many nations and their ability to adapt. The EU is now implementing carbon policies that call for a 55% reduction of emissions by 2030. Meaning, no new fossil fuel sources are supposed to be utilized. Only reductions are allowed.
Climate scientists and global elitists claim that climate change is the paramount issue of the century and must be dealt with immediately and by any means necessary. They haven’t presented a single shred of hard evidence to support this assertion, but they dictate the policies of most western governments so they don’t really need to. They just initiate restrictions without public input.
In reality, perhaps the greatest threat since WWII is about to land like a hydrogen bomb
in the laps of the European public.
Panic is beginning to take shape as Russia cuts natural gas supplies to the EU down to 20% of their original capacity and alternative sources simply do not exist on a scale that can take up the slack. A large portion of oil exports have also been shut down, and European governments are NOT informing the citizenry of the true gravity of the situation.
At current energy import rates, at least 40% of Europe
will not be able to heat their homes in the winter.
EU plans to replace Russian energy sources in the near term have also been deemed “wildly optimistic.” In other words, the EU public is screwed, and many of them still don’t realize it yet because the government won’t admit it. A disaster of epic proportions is about to strike and this isn’t even counting the enormous price hikes that are coming for the other 60% of people that will still have gas supplies available.
But the climate cult is not letting this visceral reality get in their way. To them, the crisis is an opportunity. A new narrative is rising among intergovernmental bodies, the media and among climate activists; they say this impending disaster is actually “good for Europe” in the long run, because it forces citizens to accept energy reduction policies and carbon controls which climate scientists and globalists have been demanding for years. Inflation in prices means shrinking demand and cuts in the supply chain mean resources are quashed even if demand remains high. Energy is being suffocated slowly leaving room for a “Green New Deal” of sorts.
So, it’s good for the globalists and their agenda, but not really good for anyone else that has to live through harsh winter months with no heat and limited electricity.
If the current trend continues without a dramatic change in the way Europe throttles fossil fuel energy, then there is the very real potential for mass deaths this winter. This is not hyperbole, this is a mathematical certainty. The continued push for even more climate restrictions at this time is making the situation much worse.
There is no impending threat due to climate change, but there is an impending threat due to energy shortages. Europeans need to ask themselves – Why are their governments setting them up for calamity over a non-existent climate bogeyman? Without increased fossil fuel energy from numerous sources including coal and oil the EU is on the path to a historic tragedy this winter.