Scary Warming Everywhere Elsewhere

Recent posts here discussed how rapidly has cooling set in this year.  Of course that reality is inconvenient in the run up to Glasgow COP, so the scramble is on to claim that 2021 is hotter than ever.  A previous post Heat Records Silly Season Again provides background for understanding that there are literally millions of temperature records that can be packaged to support any desirable warming or cooling claim.

A current example of such packaging is found in a recent tweet thread from Zeke Hausfather, a climate analyst who helped build the BEST dataset and a supporter of the IPCC agenda.

A curious person would note that only summer and land is shown, and would wonder: What am I not seeing?  And then in the thread are various comments saying it was not at all warm where I live, this doesn’t add up.  And then someone shows another graph from BEST giving a different impression.

Climate reporting is confusing because the scope of temperature averaging gives very different impressions, and at the mega scale rarely corresponds to anyone’s particular experience.  So generalizations are claimed extrapolating from statistics, contradicted by many persons’ direct experience.

NOAA State of the Climate is another site advocating for the IPCC agenda and illustrates how this works.  First the Global Climate Report:

So there is the #1 warmest land summer, but we now can see the Ocean was 6th and combined Global is 4th, not 1st.  Now let’s look at the year to date (YTD):

Oh oh, that’s not as scary; the first two-thirds of 2021 are not #1, but #6, and with autumn coming on could go even lower. And to understand why most people will be put off by Hausfather’s claim, we go to the Regional Analysis in order to see what the year has been like in various continents (land by definition).

It becomes obvious that no matter where I live, don’t tell me this is the hottest year ever. OK some Africans may agree, but those in Oceania (mostly Australians) will boo you out of the room.  And as for tourist destinations,  forget about it:Footnote: Everyone has an agenda and packages data in support of their POV.  Those who joined the anti-fossil fuel crusade are bound to find and amplify any bit of global warming they can find.  My agenda is for people to consider the full amount of relevant data and facts, and to reason accordingly rather than go along with the crowd or their feelings.  My approach is best expressed in this essay:

I Want You Not to Panic


How Do We Know Humans Cause Climate Change?

Peter J. Wallison and Benjamin Zycher examine the evidence in their Law & Liberty article What We Really Know About Climate Change.  Excerpts in italics with my bolds and added images.

The assumption that humans are the single most significant cause of climate change is unsupported by the available science.

The sixth Assessment Report (AR6) of the Intergovernmental Panel on Climate Change (IPCC) continues a long history of alarmist predictions with the deeply dubious statement that human-caused climate change has now become “irreversible.” President Biden and many others have called climate change an “existential threat” to humanity; and Biden claimed in his inaugural address to have heard from the Earth itself “a cry for survival.”

Hurricane Ida also has brought new claims about the dangers of climate change, but those assertions are inconsistent with the satellite record on tropical cyclones, which shows no trend since the early 1970s.

Yet the headline on the front page of the New York Times of August 12, 2021 was: “Greek Island Burns in a Sign of Crises to Come.” The accompanying article, continuing the multi-year effort of that newspaper to spread fears about climate change unsupported by evidence, argued that this was “another inevitable episode of Europe’s extreme weather [caused] by the man-made climate change that scientists have now concluded is irreversible.”

Almost every word in that sentence is either false or seriously misleading, continuing a multi-decade campaign of apocalyptic warnings about the effects of greenhouse gas emissions. Data on centuries and millennia of climate phenomena, constructed by scientists over many years around the world, show that the severe weather that the Times attributes to “man-made climate change” is consistent with the normal weather patterns and variability displayed in both the formal records and such proxy data as ice cores. In fact, there is little evidence that “extreme weather” events have become more frequent since 1850, the approximate end of the little ice age.

Increasing atmospheric concentrations of greenhouse gases have yielded detectable effects, but “scientists” in general have not, as the Times falsely stated, concluded that “extreme weather” is now “irreversible.” The statement itself comes from the “Summary for Policymakers” published as part of the most recent IPCC study of climate change; it is deeply problematic given the analyses and data provided in the scientific chapter (“The Physical Science Basis”) of the report to which the Times referred. Scientists disagree sharply about the significance of climate change and the analytic tools used to evaluate it, let alone whether it is “irreversible.”

There has been no upward trend in the number of “hot” days between 1895 and 2017; 11 of the 12 years with the highest number of such days occurred before 1960. Since 2005, NOAA has maintained the U.S. Climate Reference Network, comprising 114 meticulously maintained temperature stations spaced more or less uniformly across the lower 48 states, along with 21 stations in Alaska and two stations in Hawaii. They are placed to avoid heat-island effects and other such distortions as much as possible. The reported data show no increase in average temperatures over the available 2005-2020 period. In addition, a recent reconstruction of global temperatures over the past 1 million years—created using data from ice-sheet formations—shows that there is nothing unusual about the current warm period.

These alarmist predictions almost always are based upon climate models that have proven poor at reconstructing the past and ongoing temperature record. For example, the Times article implies that wildfires will increase in the future as the earth grows hotter. But there has been no trend in the number of U.S. wildfires in the 35 years since 1985, and global acreage burned has declined over past decades.

Unable to demonstrate that observed climate trends are due to human-caused (anthropogenic) climate change—or even that these events are particularly unusual or concerning—climate catastrophists will often turn to dire predictions about prospective climate phenomena. The problem with such predictions is that they are almost always generated by climate models driven by highly complex sets of assumptions about which there is significant dispute. It goes without saying that the predictions of models that cannot reconstruct what has happened in the past should not be given heavy weight in terms of predictions about the future, but that is exactly what many analysts are doing.

Extreme weather occurrences are likewise used as evidence of an ongoing climate crisis, but again, a study of the available data undercuts that assessment. U.S. tornado activity shows either no increase or a downward trend since 1954. Data on tropical storms, hurricanes, and accumulated cyclone energy (a wind-speed index measuring the overall strength of a given hurricane season) reveal little change since satellite measurements of the phenomena began in the early 1970s. The Palmer Drought Severity Index shows no trend since 1895.

Rising sea levels are another frequently cited example of the impending climate crisis. And yet sea levels have been rising since at least the mid-19th century, a phenomenon unlikely to have been caused only by human activity. The earth has been warming due to both natural and anthropogenic causes, resulting in some melting of sea ice, and a thermal expansion of sea water; the degree to which rising sea level has been caused by man is unknown. And the current rate of sea-level rise as measured by the satellites is 3.3 millimeters per year, or about 13 inches over the course of a century. Will that yield a crisis?

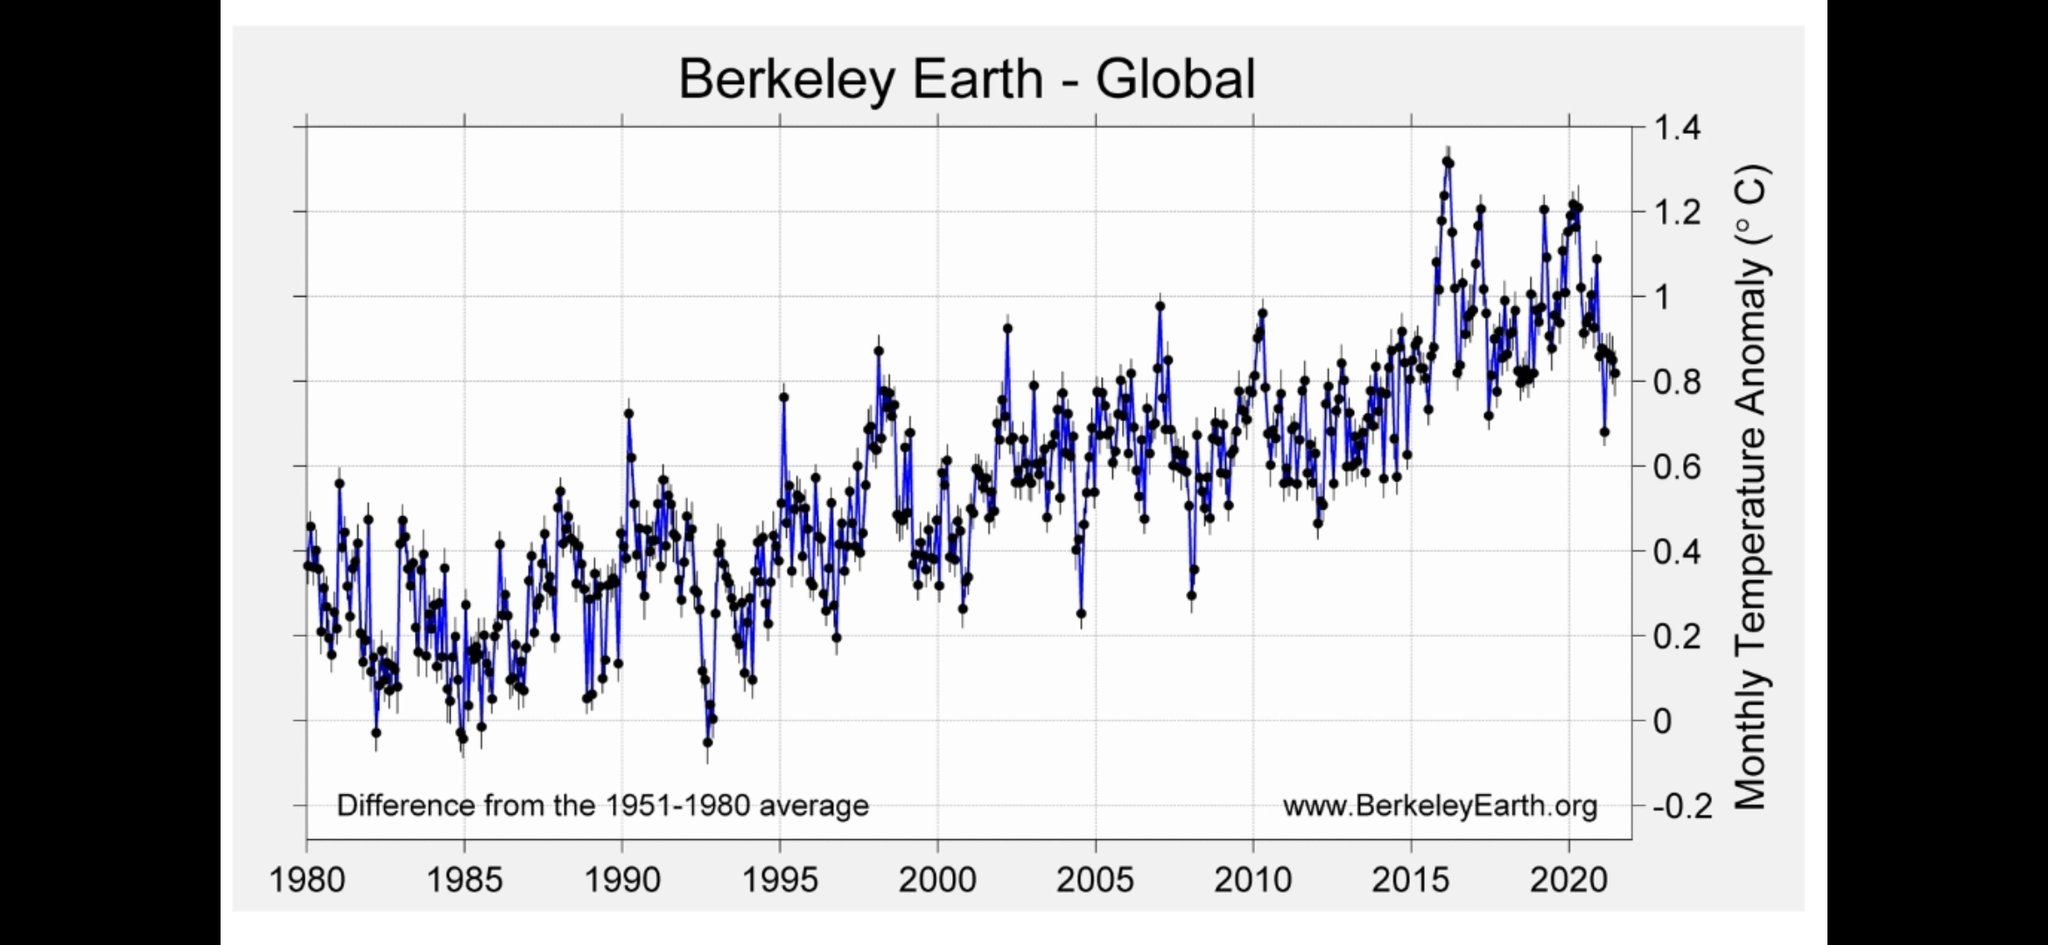
The data reported by the National Oceanic and Atmospheric Administration show that temperatures have risen and fallen since 1850, with an overall upward movement of about 1 degree C for 1850 through 2020. The 1910-1945 warming—which was very roughly the same magnitude as that observed from the mid-1970s through about 2000—is of particular interest in that it cannot be explained by higher greenhouse-gas concentrations, which increased from 300 parts per million to 310 parts per million over that period. This reinforces the commonsense observation that temperatures result from some combination of natural and anthropogenic influences, but alarmist reports seldom if ever suggest that there is any cause of warming other than the latter.

Changes in the extents of Arctic and Antarctic sea ice also raise questions about the importance of moderate warming. Since 1979, Arctic sea ice has declined relative to the 30-year average (again, the degree to which this is the result of anthropogenic factors is not known). Meanwhile, Antarctic sea ice has been growing relative to the 30-year average, and the global sea-ice total has remained roughly constant since 1979.

It is important to recognize that the assumption of many politicians, environmental groups, media sources like the New York Times, and no small number of scientist-activists—that humans are the single most significant cause of climate change—is unsupported by the available science. Such an absence of evidence should produce humility among this group, but it seems to foster more alarmism. At the very least, it should make Americans think twice before embracing radical solutions to a supposed problem that may not be important.

Spatial pattern of trends in Gross Primary Production (1982- 2015). Source: Sun et al. 2018.

Much of the mainstream press has touted, loudly, the alarmist conclusions of the latest IPCC report—amusingly, the IPCC AR6 provides a “Headlines Statements” link to assist alarmist politicians and media—but that reporting has obscured its problems, very real and very large. The report concedes that the mainstream climate models on the whole overstate warming for any given set of parameters and assumptions, but it then relies on those models for predictions about the future.

Figure 8: Warming in the tropical troposphere according to the CMIP6 models. Trends 1979–2014 (except the rightmost model, which is to 2007), for 20°N–20°S, 300–200 hPa. John Christy (2019)

The report concedes as well that the most extreme among its alternative scenarios— “RCP8.5”—has a likelihood that “is considered low,” but then uses RCP8.5 more than any other scenario. The report pretends to measure separately the magnitudes of natural and anthropogenic warming, but in reality does not do so (see Figure SPM.2); instead, it assumes away natural influences, which are asserted to have an average effect of zero. The IPCC models in summary have only two important variables: greenhouse gases, which have a warming effect, and sulfate aerosols, which have a cooling effect. That is why the IPCC models cannot explain the warming observed from 1910-1945. IPCC assumes, but does not attempt to model, a zero effect of sunlight variation, volcanic eruptions, and other such natural phenomena.

The fact is that we don’t understand all the elements in the complex climate system—the effects of clouds alone are understood poorly—and it is beyond irresponsible to adopt policies on the basis of flawed model projections that would slow economic growth in the US and elsewhere. That is a senseless and dangerous policy, which will only hurt people around the world who are striving to create better lives for themselves and their families.


Italian Climate Conference Cancelled Lest Skeptics be Heard

As reported by Robert Wade at Climate Etc.. Cancel culture in climate change a major scientific conference was cancelled because one of 14 papers to be presented was critical of global warming theory.  As Wade stated:

A microcosm on the ‘morality’ of cancel culture: the aborted conference on ‘Global Warming: Mitigation Strategies’, hosted by the Italian scientific academy the Lincei.

Naturally it seems the skeptical paper is nowhere to be found, but the same authors wrote in 2019 to the political leaders of Italy with their concerns, likely a synopsis of their findings.  The text in English comes from an article Top Italian Scientists Debunk “Man-made Global Warming” at Friends of Science.  Here is what alarmists found so offensive. Excerpts in italics with my bolds.

PETITION ON ‘MAN-MADE GLOBAL WARMING’
To Your Excellences:

President of the Republic

President of the Senate

President of the Chamber of Deputies

President of the Council

PETITION ON ‘MAN-MADE GLOBAL WARMING’

We the undersigned, citizens and scientists, warmly invite our political leaders to adopt environmental protection policies consistent with scientific knowledge. It is particularly urgent to combat pollution where it occurs as indicated by the best available science. In this regard, it is deplorable to see delay in reducing anthropogenic pollutant emissions in both land and sea using the rich knowledge made available by the world of research.

However, we must become aware that carbon dioxide itself is not a pollutant. On the contrary, it is indispensable for life on our planet.

In recent decades, the thesis has spread that the heating of the Earth’s surface of around 0.9° C observed from 1850 onwards would be anomalous and caused exclusively by human activities, particularly by CO2 emissions from the use of fossil fuels in the atmosphere. This is the anthropic global warming thesis promoted by the United Nation’s Intergovernmental Panel on Climate Change (IPCC). They claim it will produce environmental changes so serious as to cause enormous damages in an imminent future unless drastic and expensive mitigation measures are not immediately adopted. In this regard, many nations around the world have joined programs to reduce carbon dioxide emissions and are also pressed by a relentless propaganda to adopt increasingly demanding programs whose implementation place heavy burdens on the economies of individual member states.

They claim that climate control, and therefore the “salvation” of the planet,
would depend on it

However, the anthropic origin of global warming is an unproven hypothesis deduced only from some climate models, that is, from complex computer programs called General Circulation Models.

On the contrary, the scientific literature has increasingly highlighted the existence of a natural climatic variability that such models are unable to reproduce. This natural variability explains a substantial part of the global warming observed since 1850. Therefore, the anthropic responsibility for climate change observed in the last century is unjustifiably exaggerated and the corresponding catastrophic predictions are unrealistic.

The climate is the most complex system on our planet and so needs to be addressed with methods that are adequate and consistent with its level of complexity. Climate simulation models do not reproduce the observed natural variability of the climate, and in particular, do not reconstruct the warm periods of the last 10,000 years. These periods were repeated about every thousand years and include the well-known Medieval Warm Period, the Roman Hot Period, and generally warm periods during the Holocene Optimal. These past periods were also warmer than the present period despite their CO2 concentration being lower than the current one while related to the millennial cycles of solar activity. The models do not reproduce these effects.

It should be remembered that the heating observed since 1900 actually started in the 1700s, i.e., at the minimum of the Little Ice Age, the coldest period of the last 10,000 years (corresponding to the millennial minimum of solar activity, which astrophysicists call Maunder Minimal Solar). Since then, solar activity, following its millennial cycle has increased by heating the earth’s surface. Furthermore, the models fail to reproduce the known climatic oscillations of about 60 years. These were responsible, for example, for a warming period (1850-1880) followed by a cooling period (1880-1910), a heating (1910-40), a cooling (1940-70) and a new warming period (1970-2000) similar to that observed 60 years earlier. The following years (2000-2019) did not see the increase, predicted by the models, of about 0.2° C per decade, but a substantial climatic stability sporadically interrupted by the rapid natural oscillations of the equatorial Pacific Ocean, known as the El Nino Southern Oscillations, like the one that led to temporary warming between 2015 and 2016.

The media also claim that extreme events such as hurricanes and cyclones have increased at an alarming rate. Instead, like many climate systems, these events have been modulated since the aforementioned 60-year cycle. For example, if we consider the official data from 1880 on tropical Atlantic cyclones that hit North America, they appear to have a strong 60-year oscillation correlated with the Atlantic Ocean’s thermal oscillation called Atlantic Multidecadal Oscillation. The peaks observed per decade are compatible with each other in the years 1880-90, 1940-50 and 1995-2005. From 2005 to 2015, the number of cyclones decreased precisely following the aforementioned cycle. Thus, in the period 1880-2015, there is no correlation between the number of cyclones (which oscillates) and CO2 (which increases monotonically).

The climate system is not yet sufficiently understood. Although it is true that CO2 is a greenhouse gas, according to the same IPCC, the climate’s sensitivity to a CO2 increase in the atmosphere is still extremely uncertain. It is estimated that a doubling of the concentration of atmospheric CO2 from the roughly pre-industrial 300 ppm to 600 ppm can raise the average temperature of the planet from a minimum of 1° C to a maximum of 5° C. This uncertainty is enormous. In any case, many recent studies based on experimental data estimate that climate sensitivity to CO2 is considerably lower than estimated by IPCC models.

Now then, it is scientifically unrealistic to attribute to humans the responsibility for the warming observed from the past century to today. Therefore, the alarmist forecasts are not credible because they are based on models whose results contradict the experimental data. All the evidence suggests that these models overestimate the anthropic contribution and underestimate the natural climatic variability, especially the one induced by the sun, moon, and ocean oscillations.

Finally, the media spread the message that there would be an almost unanimous agreement among scientists with regard to the anthropic cause of the current climate change, and that therefore the scientific debate on this point is closed. However, first of all, we must understand that the scientific method dictates that it is facts, rather than the number of adherents, that turn a conjecture into a consolidated scientific theory.

At any rate, the alleged consensus does not exist. In fact, there is a remarkable variability of opinions among specialists – climatologists, meteorologists, geologists, geophysicists, astrophysicists – many of whom recognize that an important natural contribution to global warming was observed from the pre-industrial period and even from the post-war period to this day. There have also been petitions signed by thousands of scientists who have expressed dissent with the conjecture on anthropic global warming. These include the one promoted in 2007 by the physicist F. Seitz, former president of the American National Academy of Sciences, and the one promoted by the Non-governmental International Panel on Climate Change (NIPCC) whose 2009 report concludes that, “Nature, not human activity, rules the climate.”

In conclusion, given the crucial importance of fossil fuels for the energy supply of humanity, we suggest that we do not adhere to policies of uncritical reduction of carbon dioxide emissions into the atmosphere on the illusory pretense of governing the climate.

Rome, June 17, 2019

PROMOTING COMMITTEE

1. Uberto Crescenti, Professor Emeritus of Applied Geology, University G. D’Annunzio, Chieti-Pescara, former Dean and President of the Italian Geological Society.

2. Giuliano Panza, Professor of Seismology, University di Trieste, Accademia dei Lincei and Accademia dei XL (Italy’s National Academy of Sciences), 2018 International Award from the American Geophysical Union.

3. Alberto Prestininzi, Professor of Applied Geology, University La Sapienza, Roma, former Scientific Editor in Chiefof IJEGE international journal and Director of the Italy’s Research Center for Prediction and Control of Geological Risks.

4. Franco Prodi, Professor of Atmospheric Physics, University of Ferrara.

5. Franco Battaglia, Professor of Physical Chemistry, University of Modena; Galileo Movement 2001.

6. Mario Giaccio, Professor of Technology and Economy of Energy Sources, University G. D’Annunzio, Chieti-Pescara, former President of the Department of Economics.

7. Enrico Miccadei, Professor of Physical Geography and Geomorphology, University G. D’Annunzio, Chieti-Pescara

8. Nicola Scafetta, Professor of Atmospheric Physics and Oceanography, University Federico II, Napoli.

[The eight scientists above were joined by an additional 84 signatories to the petition.Their names are included in the linked friends of science article.]


Reality Check on Extreme Weather Claims

heat-dome-graphic

CBS News headline was:  ‘Pacific Northwest heat wave would have been “virtually impossible” without climate change, experts say.’

Eric Felton provides a useful reprise of the campaign to exploit a recent Washington State heat wave for climate hysteria mongering.  His article at Real Clear Investigations is Does Climate Change Cause Extreme Weather Now? Here’s a Scorcher of a Reality Check.  This discussion is timely since you can soon expect an inundation of hype saying our SUVs caused whatever damage is done by Hurricane (or Tropical Storm) Henri, shown below approaching Long Island and New England. Excerpts from Felton’s article are below in italics with my bolds.

Henri 20210822

The Pacific Northwest was hit with a record-shattering heat wave in June, with temperatures over 35 degrees higher than normal in some places. On June 28, Portland, Ore., reached 116 degrees. Late last week the region suffered another blast of hot weather, with a high in Portland of 103 degrees. The New York Times didn’t hesitate to pronounce the region’s bouts of extreme weather proof that the climate wasn’t just changing, but catastrophically so.

To make that claim, the Times relied on a “consortium of climate experts” that calls itself World Weather Attribution, a group organized not just to attribute extreme weather events to climate change, but to do so quickly. Within days of the June heat wave, the researchers released an analysis, declaring that the torrid spell “was virtually impossible without human-caused climate change.”

World Weather Attribution and its alarming report were trumpeted by Time magazine, touted by the NOAA website Climate.gov , and featured by CBS News, CNBC, Scientific American, CNN, the Washington Post, USAToday, and the New York Times, among others.

The group’s claim that global warming was to blame was perhaps less significant than the speed with which that conclusion was provided to the media. Previous efforts to tie extreme weather events to climate change hadn’t had the impact scientists had hoped for, according to Time, because it “wasn’t producing results fast enough to get attention from people outside the climate science world.”

“Being able to confidently say that a given weather disaster was caused by climate change while said event still has the world’s attention,” Time explained, approvingly, “can be an enormously useful tool to convince leaders, lawmakers and others that climate change is a threat that must be addressed.” In other words, the value of rapid attribution is primarily political, not scientific.

550856_5_

World Weather Attribution was organized to quickly attribute extreme weather events to climate change.  World Weather Attribution

Inconveniently for World Weather Attribution, an atmospheric scientist with extensive knowledge of the Pacific Northwest climate was actively running weather models that accurately predicted the heatwave. Cliff Mass rejected the notion that global warming was to blame for the scorching temperatures. He calculated that global warming might have been responsible for two degrees of the near 40-degree anomaly. With or without climate change, Mass wrote, the region “still would have experienced the most severe heat wave of the past century.”

Mass has no shortage of credentials relevant to the issue: A professor of atmospheric sciences at the University of Washington, he is author of the book “The Weather of the Pacific Northwest.”

Mass took on the World Weather Attribution group directly: “Unfortunately, there are serious flaws in their approach.” According to Mass, the heatwave was the result of “natural variability.” The models being used by the international group lacked the “resolution to correctly simulate critical intense, local precipitation features,” and “they generally use unrealistic greenhouse gas emissions.”

WWA issued a “rebuttal” calling Mass’ criticisms “misleading and incorrect.” But the gauntlet thrown down by Mass did seem to affect WWA’s confidence in its claims. The group, which had originally declared the heatwave would have been “virtually impossible without human-caused climate change,” altered its tone. In subsequent public statements, it emphasized that it had merely been making “best estimates” and had presented them “with the appropriate caveats and uncertainties.” Scientists with the attribution group did not respond to questions about Mass’s criticisms posed by RealClearInvestigations.

But what of the group’s basic mission, the attribution of individual weather events to climate change? Hasn’t it been a fundamental rule of discussing extreme temperatures in a given place not to conflate weather with climate? Weather, it is regularly pointed out, refers to conditions during a short time in a limited area; climate is said to describe longer-term atmospheric patterns over large areas.

Until recently, at least, climate scientists long warned against using individual weather events to ponder the existence or otherwise of global warming. Typically, that argument is used to respond to those who might argue a spate of extreme cold is reason to doubt the planet is warming. Using individual weather events to say anything about the climate is “dangerous nonsense,” the New Scientist warned a decade ago.

noaa-us-temp-2019-2021

Perhaps, but it happens all the time now that climate advocates have found it to be an effective tool. In 2019, The Associated Press-NORC Center for Public Affairs Research and the Energy Policy Institute at the University of Chicago found that three-fourths of those polled said their views about climate change had been shaped by extreme weather events. Leah Sprain, in the book “Ethics and Practice in Science Communication,” says that even though it may be legitimate to make the broad claim that climate change “may result in future extreme weather,” when one tries “arguing weather patterns were caused by climate change, things get dicey.” Which creates a tension: “For some communicators, the ultimate goal – mobilizing political action – warrants rhetorical use of extreme weather events.” But that makes scientists nervous, Sprain writes, because “misrepresenting science will undermine the credibility of arguments for climate change.”

Which is exactly what happened with the World Weather Attribution group, according to Mass: “Many of the climate attribution studies are resulting in headlines that are deceptive and result in people coming to incorrect conclusions about the relative roles of global warming and natural variability in current extreme weather,” he wrote at his blog. “Scary headlines and apocalyptic attribution studies needlessly provoke fear.”

The blogging professor laments that atmospheric sciences have been “poisoned” by politics. “It’s damaged climate science,” he told RCI.

payn_c18450120210819120100

And not just politics – Mass also says that the accepted tenets of global warming have become a sort of religion. Consider the language used, he says, such as the question of whether one “believes” in anthropogenic climate change. “You don’t believe in gravity,” he says. The religious metaphor also explains why colleagues get so bent out of shape with him, Mass says: “There’s nothing worse than an apostate priest.”

That goes even for those who are merely mild apostates. Mass doesn’t dispute warming, he merely questions how big a problem it is. “We need to worry about climate change,” he has said. “But hype and exaggeration of its impacts only undermine the potential for effective action.”

mle190506c20190506011552

What If It’s Global Cooling, Not Warming?

IOGP oil and gas plumbing

Chris MacIntosh has an article at zerohedge Global warming or cooling? Excerpts in italics with my bolds.

Wouldn’t it be ironic that instead of the planet-warming over the next 30 years, it actually went into a cooling phase?

When we first heard of sunspot activity and forecasting climate based on the level of solar spot activity we thought this was pixyland stuff.

However, when we “opened our minds” and started to dig deeper we realized there was something going on here. Make your own minds up. We aren’t trying to change anyone’s view but rather encourage you to open your perspectives.

You might like to read this:
“THE NEXT 30 YEARS WILL BE COLD,” SAYS CLIMATE SCIENTIST DR. WILLIE SOON

And this:
NEW PAPER USES AI TO PREDICT THE SUNSPOT CYCLES: LOW SOLAR ACTIVITY UNTIL 2050

Frankly, I’m no scientist but I ran a VC firm for some years, and I’ll tell you what. You are presented with such a ton of “opportunities” that it will make your head spin.

Sorting the wheat from the chaff is quite literally a full time role, and one thing that gets honed like a sword on an anvil is the skeptical critical thinking part of our brain.

Trust but verify is so very important. And what I do know is that the entire global warming narrative, together with “the science is settled,” is complete utter nonsense. It has been extraordinarily successful, too.

Kids these days are being taught it. Mind you, my daughter, who had to present a project on it at school, provided a shocking red pill (Dad helped her on her project) to the class and her teacher.   We literally have a class of people in the world today who are successful as professional hysterics.

However, what we do know is that global energy markets (and a whole host of other second order consequences) are not priced for a cooling of the planet over the next 30 years.

That is why we can get a payback of our investment in coal assets after about 5 years but it will take 100 years to get a payback from investing in Tesla.

What would happen to energy prices (natgas, coal, oil) if the world did in fact get colder over the next 30 years?

Well, the world would start using more fossil fuels and ditch the renewable thing faster than that crazy ex girlfriend/boyfriend that stalks you.

But after years of under investment in fossil fuels (particularly outside of shale), the supply would not be able to be increased meaningfully (i.e. prices would rocket higher and stay there for as long as it takes to bring on more supply), and given the underinvestment and treatment of anyone who would suggest doing so as if they’ve committed mortal sin… well, it’s not coming back in a hurry.

Now, think of every good and service that is tied to the price of fossil fuels. This picture should illustrate the point — life as we know it.

IOGP oil and gas plumbingHmmm… isn’t the rising price of all the “stuff” mentioned above a good definition of inflation? But isn’t the world perfectly positioned for deflation?

Global cooling and inflation… what a toxic cocktail. But we are perfectly positioned for both. Ah, such poetry. Bring it on!

See also Worst Threat: Greenhouse Gas or Quiet Sun?

Elite Consensus Opinion Minority Contrary Opinion
Expect +1C Warmer from now to 2050 Expect -1C Colder from now to 2050
Mitigate Warming by Stopping Fossil Fuels Adapt to Cooling from Quiet Sun
Goal is Net Zero CO2 Emissions by 2050 Goal Robust Energy supply and Infrastructure Now

Climate Kool-Aid

Climate Kool-Aid

Johnathan DuHamel has another fine article at his blog Wry Heat  The Biden Administration Has Swallowed the Climate Kool-Aid.  Excerpts in italics with my bolds and some images.

The Biden administration thinks they can stop global warming (aka climate change) by eliminating carbon dioxide emissions from burning fossil fuels and switching electrical generation to wind and solar installations. Biden says “follow the science.” If he did follow the science he would realize that there is no physical evidence that carbon dioxide plays a significant role in controlling global temperature (see posts at the end of this article).

Biden wants 80% hydrocarbon-free electricity generation by 2030, 100% by 2035 and elimination of fossil fuels from all sectors of the U.S. economy by 2050.

According to Paul Driessen (senior policy analyst for the Committee For A Constructive Tomorrow), “ this would send the nation’s annual electricity requirement soaring from about 2.7 billion megawatt-hours (the fossil fuel portion of total U.S. electricity) to almost 7.5 billion MWh per year by 2050. Substantial additional generation would be required to constantly recharge backup batteries for windless, sunless days, to safeguard society against blackouts, cyberattacks and wholesale collapse. Generating all that electricity without new nuclear and hydroelectric plants would require tens of thousands of 850-foot-tall offshore wind turbines, hundreds of thousands (perhaps millions) of somewhat smaller onshore turbines, and billions of photovoltaic solar panels. All these turbines, panels, batteries and power lines would require tens of billions of tons of non-renewable iron, copper, aluminum, cobalt, lithium, rare earth elements, plastics, limestone and other materials. That would necessitate mining, crushing, processing, refining and transporting tens of billions of tons of ores – from thousands of mines and quarries, using gigantic gasoline and diesel equipment – followed by smelting and manufacturing, all with fossil fuels.

None of this is clean, green or sustainable.”

So, how is “global warming” doing. We can consult with Dr. Roy Spencer who manages the Advanced Microwave Scanning Radiometer flying on NASA’s Aqua satellite. This satellite system measures global atmospheric temperature daily. The latest results are seen here:

uah_lt_1979_thru_june_2021_v6


You should notice that global atmospheric temperatures in April, May, and June, 2021, were below the 1991-2020 average and similar to temperatures in 1983. According to the Global Monitoring Laboratory of NOAA at Mauna Loa, Hawaii, atmospheric carbon dioxide was about 340ppm in 1983 versus about 418ppm now. Although there has been deviation from the average due to things like the El Nino-La Nina cycles, there has not been any overall warming in spite of the increase in carbon dioxide.

uah-global-1995to202104-w-co2-overlay

Biden and other climate alarmists have swallowed the climate “Kool-Aid” and claim that reducing just one, small, insignificant factor will be the panacea in controlling global temperature, but it’s not that simple:

“The forcings that drive long-term climate change are not known with an accuracy sufficient to define future climate change.” — James Hansen, “Climate forcings in the Industrial era”, PNAS, Vol. 95, Issue 22, 12753-12758, October 27, 1998.

“In climate research and modeling, we should recognize that we are dealing with a coupled non-linear chaotic system, and therefore that the prediction of a specific future climate state is not possible.” — Final chapter,Third Assessment Report, IPCC 2000.

While controlling CO2 emissions from burning fossil fuels may have some beneficial effects on air quality, it will have no measurable effect on climate, but great detrimental effects on the economy and our standard of living. The greatest danger of climate change is that politicians think they can stop it. But the climate has always been in a state of flux. In my opinion, the debate over global warming is truly a scam designed to control (and tax) production and use of energy from fossil fuels.

The alleged “climate crisis” is just a scam perpetrated for political gain.
“The whole aim of practical politics is to keep the populace alarmed (and hence clamorous to be led to safety) by menacing it with an endless series of hobgoblins, all of them imaginary.” —H. L. Mencken (1880-1956)

(Note to younger readers: The term “Kool-Aid” used in this context refers to cult leader Jim Jones who, on November 18, 1978, instructed all members living in the Jonestown, Guyana compound to commit an act of “revolutionary suicide,” by drinking poisoned punch. Link )

For the real science, see these articles from my blog

See also Biden Climate Agenda Heads into Perfect Storm

gang-green

Climate Change Elevator Speech

On a recent post Judith Curry challenged commenters with this question: 

How would you explain the complexity and uncertainty surrounding climate change plus how we should respond (particularly with regards to CO2 emissions) in five minutes?

 The video was an impressive offering from John Shewchuk, and I thought it worth sharing here.

2021 Update: Fossil Fuels ≠ Global Warming

gas in hands

Previous posts addressed the claim that fossil fuels are driving global warming. This post updates that analysis with the latest (2020) numbers from BP Statistics and compares World Fossil Fuel Consumption (WFFC) with three estimates of Global Mean Temperature (GMT). More on both these variables below.

WFFC

2020 statistics are now available from BP for international consumption of Primary Energy sources. 2021 Statistical Review of World Energy. 

The reporting categories are:
Oil
Natural Gas
Coal
Nuclear
Hydro
Renewables (other than hydro)

Note:  British Petroleum (BP) now uses Exajoules to replace MToe (Million Tonnes of oil equivalents.) It is logical to use an energy metric which is independent of the fuel source. OTOH renewable advocates have no doubt pressured BP to stop using oil as the baseline since their dream is a world without fossil fuel energy.

From BP conversion table 1 exajoule (EJ) = 1 quintillion joules (1 x 10^18). Oil products vary from 41.6 to 49.4 tonnes per gigajoule (10^9 joules).  Comparing this annual report with previous years shows that global Primary Energy (PE) in MToe is roughly 24 times the same amount in Exajoules.  The conversion factor at the macro level varies from year to year depending on the fuel mix. The graphs below use the new metric.

This analysis combines the first three, Oil, Gas, and Coal for total fossil fuel consumption world wide (WFFC).  The chart below shows the patterns for WFFC compared to world consumption of Primary Energy from 1965 through 2020.

WFFC 2020

The graph shows that global Primary Energy (PE) consumption from all sources has grown continuously over 5 decades. Since 1965  oil, gas and coal (FF, sometimes termed “Thermal”) averaged 89% of PE consumed, ranging from 94% in 1965 to 84% in 2019.  Note that last year, 2020, PE dropped 25 EJ (4%) slightly below 2017 consumption.  WFFC for 2020 dropped 27 EJ (6%), 83% of PE and matching 2013 WFFC consumption. For the 55 year period, the net changes were:

Oil 168%
Gas 506%
Coal 161%
WFFC 218%
PE 259%
Global Mean Temperatures

Everyone acknowledges that GMT is a fiction since temperature is an intrinsic property of objects, and varies dramatically over time and over the surface of the earth. No place on earth determines “average” temperature for the globe. Yet for the purpose of detecting change in temperature, major climate data sets estimate GMT and report anomalies from it.

UAH record consists of satellite era global temperature estimates for the lower troposphere, a layer of air from 0 to 4km above the surface. HadSST estimates sea surface temperatures from oceans covering 71% of the planet. HADCRUT combines HadSST estimates with records from land stations whose elevations range up to 6km above sea level.

Both GISS LOTI (land and ocean) and HADCRUT4 (land and ocean) use 14.0 Celsius as the climate normal, so I will add that number back into the anomalies. This is done not claiming any validity other than to achieve a reasonable measure of magnitude regarding the observed fluctuations.

No doubt global sea surface temperatures are typically higher than 14C, more like 17 or 18C, and of course warmer in the tropics and colder at higher latitudes. Likewise, the lapse rate in the atmosphere means that air temperatures both from satellites and elevated land stations will range colder than 14C. Still, that climate normal is a generally accepted indicator of GMT.

Correlations of GMT and WFFC

The next graph compares WFFC to GMT estimates over the five decades from 1965 to 2020 from HADCRUT4, which includes HadSST3.

WFFC and Hadcrut 2020

Since 1965 the increase in fossil fuel consumption is dramatic and monotonic, steadily increasing by 218% from 146 to 463 exajoules.  Meanwhile the GMT record from Hadcrut shows multiple ups and downs with an accumulated rise of 0.9C over 55 years, 7% of the starting value.

The graph below compares WFFC to GMT estimates from UAH6, and HadSST3 for the satellite era from 1980 to 2020, a period of 40 years.

WFFC and UAH HadSST 2020

In the satellite era WFFC has increased at a compounded rate of nearly 2% per year, for a total increase of 82% since 1979. At the same time, SST warming amounted to 0.52C, or 3.7% of the starting value.  UAH warming was 0.7C, or 5% up from 1979.  The temperature compounded rate of change is 0.1% per year, an order of magnitude less than WFFC.  Even more obvious is the 1998 El Nino peak and flat GMT since.

Summary

The climate alarmist/activist claim is straight forward: Burning fossil fuels makes measured temperatures warmer. The Paris Accord further asserts that by reducing human use of fossil fuels, further warming can be prevented.  Those claims do not bear up under scrutiny.

It is enough for simple minds to see that two time series are both rising and to think that one must be causing the other. But both scientific and legal methods assert causation only when the two variables are both strongly and consistently aligned. The above shows a weak and inconsistent linkage between WFFC and GMT.

Going further back in history shows even weaker correlation between fossil fuels consumption and global temperature estimates:

wfc-vs-sat

Figure 5.1. Comparative dynamics of the World Fuel Consumption (WFC) and Global Surface Air Temperature Anomaly (ΔT), 1861-2000. The thin dashed line represents annual ΔT, the bold line—its 13-year smoothing, and the line constructed from rectangles—WFC (in millions of tons of nominal fuel) (Klyashtorin and Lyubushin, 2003). Source: Frolov et al. 2009

In legal terms, as long as there is another equally or more likely explanation for the set of facts, the claimed causation is unproven. The more likely explanation is that global temperatures vary due to oceanic and solar cycles. The proof is clearly and thoroughly set forward in the post Quantifying Natural Climate Change.

Background context for today’s post is at Claim: Fossil Fuels Cause Global Warming.

Lord Monckton Fires Back at Climatist Hit Job

Monckton emblem

The Viscount Monckton of Brenchley

H/T to Climate Depot for reporting that Lord Monckton has issued an extensive rebuttal as well as threatening legal action against a libelous article calling him a “liar” multiple times. The entire document is enjoyable to read, given his English fluency and writing style. In this post I will focus on several substantial points regarding climate science, whereby consensus suppositions are falsified in the response.
The rebuttal is Letter before claim in libel

Overview

From Monckton to the defendants’ editor: (in italics with my bolds)

Sir, – I have received two offensive emails – dated 3 April and 27 May 2021 – from one S. Bishop, who says he is writing an article, inferentially about global warming and my research interest therein. Bishop appears intent on seeking to maintain that I have changed my position from skepticism of global warming to acceptance of it, even though I have expressly told that it is the other way about.

The tactic of falsely alleging that those who had disagreed with the orthodoxy have come to agree with it after all (when in my case precisely the reverse is true) is one that I have seen before. The last time this happened, a silly article was published in a national newspaper. I complained. The “journalist” in question – actually a far-Left activist – was deservedly dismissed.

Therefore, I thought it fair to alert you at once to Bishop’s dishonest attempt to deploy the same technique of artful but wilful misrepresentation, inferentially as part of a doomed attempt to convey the false impression that there is no legitimate scientific debate about the extent of the anthropogenic contribution to global warming, or about the expected impacts of warmer weather worldwide.

Discussion

There follows description of instances where S. Bishop made statements that misrepresent what he himself knew contrary to what he wrote. Then Monckton copies his response to S. Bishop’s memo:

One of the nasty tactics used by climate Communists is the attempt to suggest that skeptics have changed their stance from skepticism to acceptance of the Party Line. I once had to have a journalist fired from a national newspaper for writing a silly piece suggesting what you are now unpleasantly and inaccurately suggesting.

In my case, it is precisely the other way about. At first I went along with the Party Line: but then, in 2006, the CEO of a boutique hedge-fund in London asked me to investigate the global warming question. When I did so, I found that the world had been misled. I reported accordingly, and a summary of my 80-page report eventually appeared in a national newspaper, drawing hundreds of thousands of hits in just two hours (after which the newspaper’s website crashed). That report, and all subsequent articles, papers and speeches by me, acknowledged what is self-evident – namely, that returning to the atmosphere some of the CO2 that was formerly present there (7000 ppmv in the Neoproterozoic, 420 ppmv today) might be expected to cause some warming, if one waited long enough. The question is not whether or not there has been or will be warming: there has been, and there will be. The question is how much – or, rather, how little.

Monckton then dismisses item by item the assertions of lies. Many of them are rhetorical tricks, such as taking statements out of the historical context, or hiding remarks made to audiences; some so-called “lies” involve changing the wording of what Monckton wrote or said.

The Essential Dichotomies: Facts on the Ground which Climatists Deny

Polar Bears Are Thriving

In 2016 Monckton had told a Montana audience: ‘So you don’t have to worry about the cuddly polar bears. They are going to be just fine.”

Monckton2

Monckton2aI had made my remarks in the context of Al Gore’s movie, in which he had said polar bears were drowning due to loss of ice in the Beaufort Sea. However, in the period immediately before he began making his movie – the period during which he said polar bears had died – sea-ice concentration in the Beaufort Sea had increased (above).

Greenland Ice Sheet is Not Melting

In New Zealand, Monckton claimed: “In Greenland, the ice did not melt 8000 years ago and it isn’t melting today.”

Monckton3a

From 1991-2003, above 1500 the ice in Greenland had thickened by 2 feet. There had been little change below 1500 m (above).

Monckton3b

Over the past 8000 years, temperature at the summit of the Greenland ice sheet has fallen by 1.5 degrees, notwithstanding CO2 concentration increasing from 260 ppmv to 420 ppmv today. Once again the defendants have sought to use evidence, from one side of the debate only, some of it unavailable at the time when I spoke.

Temperature Trends Have Been Inflated by Adjustments to the Terrestrial Temperature Dataset

Monckton4

The above graph shows how many times the GISS global mean surface temperature anomaly for January 1910 and January 2000 were altered between May 2008 and May 2021, with the overall effect of making it appear that the warming between the two dates was close to 50% greater than the original measurements had suggested.

Great Barrier Reef Not Threatened by Global Warming

Monckton7

The graph above shows the sea surface temperatures in the Great Barrier Reef. It shows no trend for almost 30 years – the period before I made the speech in question. I cannot fairly be accused of lying about trends that may have occurred after I spoke.

Extreme Heat Was a Problem Back in the 1920s and 30s

Monckton8

Hansen Wildly Exaggerated Future Warming in His 1988 US Senate Testimony

Monckton5

Hansen’s graph was indeed exaggerated (see above). In 1988, in now-notorious testimony before the U.S. Senate, he predicted global warming at a rate equivalent to 3.2 C° per century (broadly equivalent to equilibrium sensitivity to doubled CO2) on a business-as-usual emissions scenario (and it is the business-as-usual emissions scenario that has happened since). However, anthropogenic warming has proven to be little more than a third of his predicted business-as-usual rate (red curve and trend above). Indeed, it is below even the unrealized scenario (green) in which the world was supposed to cease all emissions of CO2 from 2000 onwards (it did no such thing). The trend in observed warming is overlaid on Hansen’s red, yellow and green scenarios in blue. The anthropogenic 70% fraction (Wu et al., 2019) of the observed warming is shown in purple.

Today is Not Warmer than Medieval Times

Monckton6

Temperatures in the mediaeval climate optimum were at least as warm as, and usually warmer than, the present. The fact that grapes now grow in very small quantities in lowland Scotland and in the Hebrides, influenced by the Gulf Stream, merely emphasize that temperatures are beginning to recover towards those attained in the mediaeval climate optimum, when grapes were even grown in the Great Glen, a part of the Highlands where it would be very difficult to grow grapes in today’s colder conditions.

Globe No Longer Warming

There has now been no global warming for about six years. The short bursts of warming that occur every five and a half years or so are associated with the naturally-occurring positive cycles of the el Nino Southern Oscillation, which appears to be driven chiefly by crustal deformation in the tropical Eastern Pacific, where the tectonic subduction rate is noticeably greater than anywhere else. The deformation is caused by local solar-system celestial mechanics, and the resultant warming comes from below, through subocean volcanism along the subduction line. It is then distributed worldwide via the thermohaline circulation, which, contrary to some silly reports, cannot cease to operate while the wind blows and the Earth rotates.

My image and comment:

gmt-warming-events

The animation is an update of a previous analysis from Dr. Murry Salby. These graphs use Hadcrut4 and include the 2016 El Nino warming event. The exhibit shows since 1947 GMT warmed by 0.8 C, from 13.9 to 14.7, as estimated by Hadcrut4. This resulted from three natural warming events involving ocean cycles. The most recent rise 2013-16 lifted temperatures by 0.2C. Previously the 1997-98 El Nino produced a plateau increase of 0.4C. Before that, a rise from 1977-81 added 0.2C to start the warming since 1947.

Importantly, the theory of human-caused global warming asserts that increasing CO2 in the atmosphere changes the baseline and causes systemic warming in our climate. On the contrary, all of the warming since 1947 was episodic, coming from three brief events associated with oceanic cycles.


Why Climate Models Fail to Replicate the North Atlantic

screenshot-2021-06-07-at-12.17.38-1024x539-1

A recent paper employed expert statistical analysis to prove that currently climate models fail to reproduce fluctuations of sea surface temperatures in the North Atlantic, a key region affecting global weather and climate.  H/T to David Whitehouse at GWPF for posting a revew of the paper.  I agree with him that the analysis looks solid and the findings robust.  However, as I will show below, neither Whitehouse nor the paper explicitly drew the most important implication.

At GWPF, Whitehouse writes Climate models fail in key test region (in italics with my bolds):

A new paper by Timothy DelSole of George Mason University and Michael Tippett of Columbia University looks into this by attempting to quantify the consistency between climate models and observations using a novel statistical approach. It involves using a multivariate statistical framework whose usefulness has been demonstrated in other fields such as economics and statistics. Technically, they are asking if two time series such as observations and climate model output come from the same statistical source.

To do this they looked at the surface temperature of the North Atlantic which is variable over decadal timescales. The reason for this variability is disputed, it could be related to human-induced climate change or natural variability. If it is internal variability but falsely accredited to human influences then it could lead over estimates of climate sensitivity. There is also the view that the variability is due to anthropogenic aerosols with internal variability playing a weak role but it has been found that models that use external forcing produce inconsistencies in such things as the pattern of temperature and ocean salinity. These things considered it’s important to investigate if climate models are doing well in accounting for variability in the region as the North Atlantic is often used as a test of a climate model’s capability.

The researchers found that when compared to observations, almost every CMIP5 model fails, no matter whether the multidecadal variability is assumed to be forced or internal. They also found institutional bias in that output from the same model, or from models from the same institution, tended to be clustered together, and in many cases differ significantly from other clusters produced by other institutions. Overall only a few climate models out of three dozen considered were found to be consistent with the observations.

The paper is Comparing Climate Time Series. Part II: A Multivariate Test by DelSole and Tippett.  Excerpts in italics with my bolds.

We now apply our test to compare North Atlantic sea surface temperature (NASST) variability between models and observations. In particular, we focus on comparing multi-year internal variability. The question arises as to how to extract internal variability from observations. There is considerable debate about the magnitude of forced variability in this region, particularly the contribution due to anthropogenic aerosols (Booth et al., 2012; Zhang et al., 2013). Accordingly, we consider two possibilities: that the forced response is well represented by (1) a second-order polynomial or (2) a ninth-order polynomial over 1854-2018. These two assumptions will be justified shortly.

If NASST were represented on a typical 1◦ × 1◦ grid, then the number of grid cells would far exceed the available sample size. Accordingly, some form of dimension reduction is necessary. Given our focus on multi-year predictability, we consider only large-scale patterns. Accordingly, we project annual-mean NASST onto the leading eigenvectors of the Laplacian over the Atlantic between 0 0 60◦N. These eigenvectors form an orthogonal set of patterns that can be ordered by a measure of length  scale from largest to smallest.

DelSole Tippett fig1

Figure 1. Laplacian eigenvectors 1,2,3,4,5,6 over the North Atlantic between the equator and 60◦N,  where dark red and dark blue indicate extreme positive and negative values, respectively

The first six Laplacian eigenvectors are shown in fig. 1 (these were computed by the method of DelSole and Tippett, 2015). The first eigenvector is spatially uniform. Projecting data onto the first Laplacian eigenvector is equivalent to taking the area-weighted average in the basin. In the case of SST, the time series for the first Laplacian eigenvector is merely an AMV index (AMV stands for “Atlantic Multidecadal Variability”). The second and third eigenvectors are dipoles that measure the large-scale gradient across the basin. Subsequent eigenvectors capture smaller scale patterns.  For model data, we use pre-industrial control simulations of SST from phase 5 of the Coupled Model Intercomparison Project (CMIP5 Taylor et al., 2012). Control simulations use forcings that repeat year after year. As a result, interannual variability in control simulations come from internal dynamical mechanisms, not from external forcing.

DelSole Tippett fig2Figure 2. AMV index from ERSSTv5 (thin grey), and polynomial fits to a second-order (thick black) and ninth-order (red) polynomial.

For observational data, we use version 5 of the Extended Reconstructed SST dataset (ERSSTv5 Huang et al., 2017). We consider only the 165-year period 1854-2018. We first focus on time series for the first Laplacian eigenvector, which we call the AMV index. The corresponding least squares fit to second- and ninth-order polynomials in time are shown in fig. 2. The second-order polynomial captures the secular trend toward warmer temperatures but otherwise has weak multidecadal variability. In contrast, the ninth-order polynomial captures both the secular trend and multidecadal variability. There is no consensus as to whether this multidecadal variability is internal or forced. 

DelSole Tippett fig4

Figure 4. Deviance between ERSSTv5 1854-1935 and 82-year segments from 36 CMIP5 pre-industrial control simulations. Also shown is the deviance between ERSSTv5 1854-1935 and ERSSTv5 1937-2018 (first item on x-axis). The black and red curves show, respectively, results after removing a second- and ninth-order polynomial in time over 1854-2018 before evaluating the deviance. The models have been ordered on the x-axis from smallest to largest deviance after removing a second-order polynomial in time.

Conclusion:

The test was illustrated by using it to compare annual mean North Atlantic SST variability in models and observations. When compared to observations, almost every CMIP5 model differs significantly from ERSST. This conclusion holds regardless of whether a second- or ninth-order polynomial in time is regressed out. Thus, our conclusion does not depend on whether multidecadal NASST variability is assumed to be forced or internal. By applying a hierarchical clustering technique, we showed that time series from the same model, or from models from the same institution, tend to be clustered together, and in many cases differ significantly from other clusters. Our results are consistent with previous claims (Pennell and Reichler, 2011; Knutti et al., 2013) that the effective number of independent models is smaller than the actual number of models in a multi-model ensemble.

The Elephant in the Room

Now let’s consider the interpretation reached by model builders after failing to match observations of Atlantic Multidecadal Variability.  As an example consider INMCM4, whose results deviated greatly from the ERSST5 dataset.  In 2018, Evgeny Volodin and Andrey Gritsun published Simulation of observed climate changes in 1850–2014 with climate model INM-CM5.   Included in those simulations is a report of their attempts to replicate North Atlantic SSTs.  Excerpts in italics with my bolds.

esd-9-1235-2018-f04

Figure 4 The 5-year mean AMO index (K) for ERSSTv4 data (thick solid black); model mean (thick solid red). Dashed thin lines represent data from individual model runs. Colors correspond to individual runs as in Fig. 1.

Keeping in mind the argument that the GMST slowdown in the beginning of the 21st century could be due to the internal variability of the climate system, let us look at the behavior of the AMO and PDO climate indices. Here we calculated the AMO index in the usual way, as the SST anomaly in the Atlantic at latitudinal band 0–60∘ N minus the anomaly of the GMST. The model and observed 5-year mean AMO index time series are presented in Fig. 4. The well-known oscillation with a period of 60–70 years can be clearly seen in the observations. Among the model runs, only one (dashed purple line) shows oscillation with a period of about 70 years, but without significant maximum near year 2000. In other model runs there is no distinct oscillation with a period of 60–70 years but a period of 20–40 years prevails. As a result none of the seven model trajectories reproduces the behavior of the observed AMO index after year 1950 (including its warm phase at the turn of the 20th and 21st centuries).

One can conclude that anthropogenic forcing is unable to produce any significant impact on the AMO dynamics as its index averaged over seven realization stays around zero within one sigma interval (0.08). Consequently, the AMO dynamics are controlled by the internal variability of the climate system and cannot be predicted in historic experiments. On the other hand, the model can correctly predict GMST changes in 1980–2014 having the wrong phase of the AMO (blue, yellow, orange lines in Figs. 1 and 4).

esd-9-1235-2018-f01

Figure 1 The 5-year mean GMST (K) anomaly with respect to 1850–1899 for HadCRUTv4 (thick solid black); model mean (thick solid red). Dashed thin lines represent data from individual model runs: 1 – purple, 2 – dark blue, 3 – blue, 4 – green, 5 – yellow, 6 – orange, 7 – magenta. In this and the next figures numbers on the time axis indicate the first year of the 5-year mean.

The Bottom Line

Since the models incorporate AGW in the form of CO2 sensitivity, they are unable to replicate Atlantic Multidecadal Variability.  Thus, the logical conclusion is that variability of North Atlantic SSTs is an internal, natural climate factor.

The-Elephant-in-the-RoomOMC