Arctic Ice Frees Captive Ships

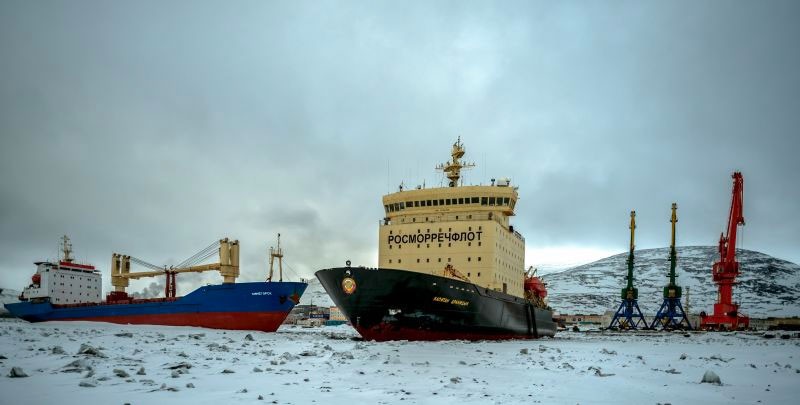
Icebreaker “Kapitan Dranitsyn” has been trapped in Pevek along with two cargo vessels since early January. Photo: Rosmorport May30, 2017

In July, the Northern Sea Route (NSR) starts to open for commercial shipping. As previously reported here Arctic Ice Takes Revenge, a convoy of Russian cargo ships including icebreakers were trapped by January ice and were stranded in Pevek. May 30 they were able to leave port, but making it home to Arkhangelsk is still uncertain since plenty of ice remains in Eastern Siberian and Laptev seas.

More about the NSR shipping situation at the end of this post.

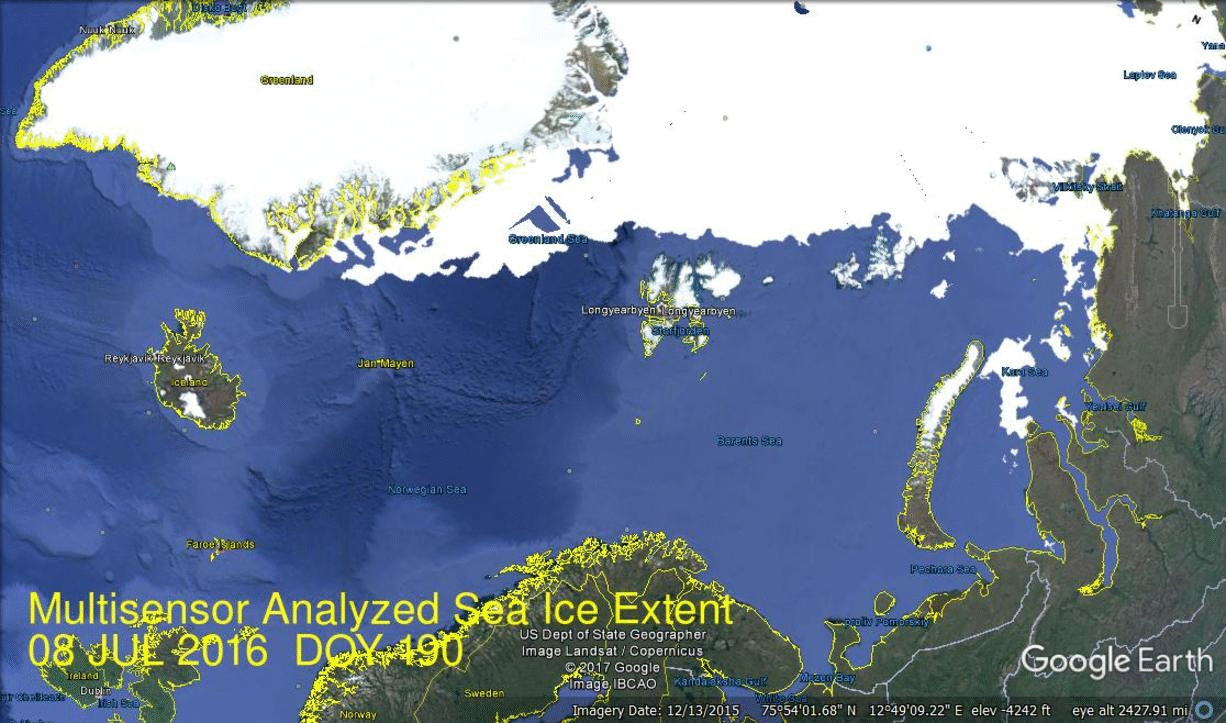
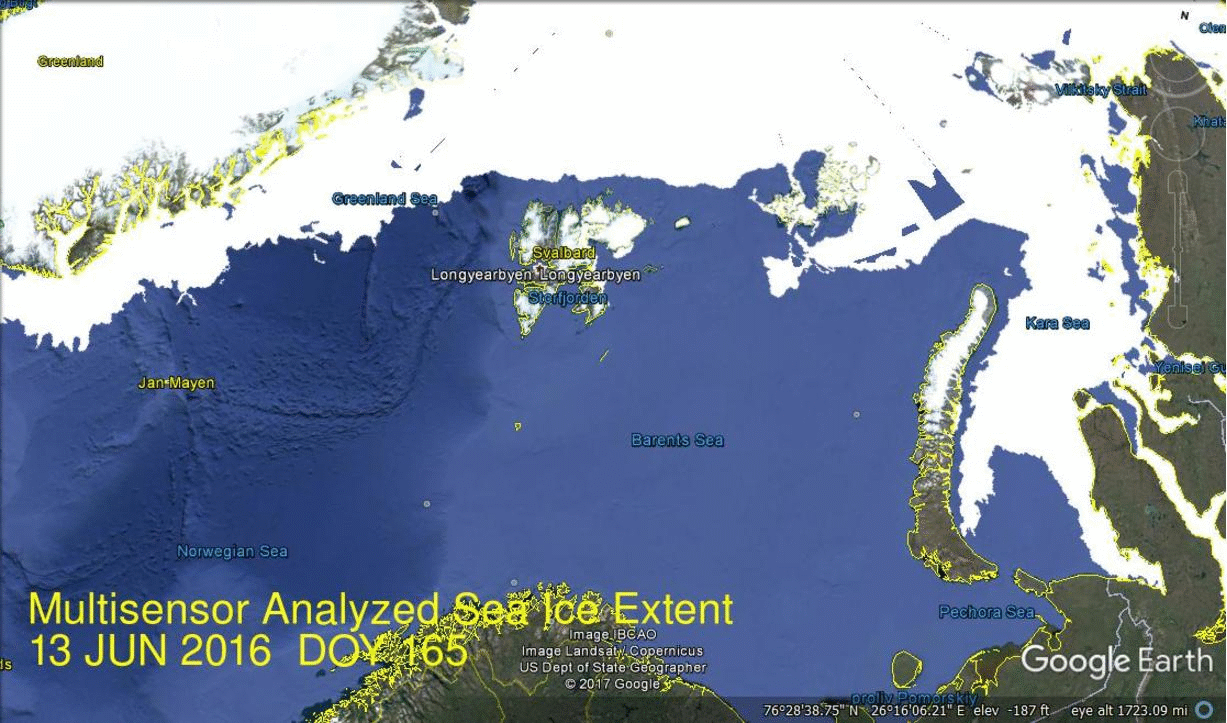
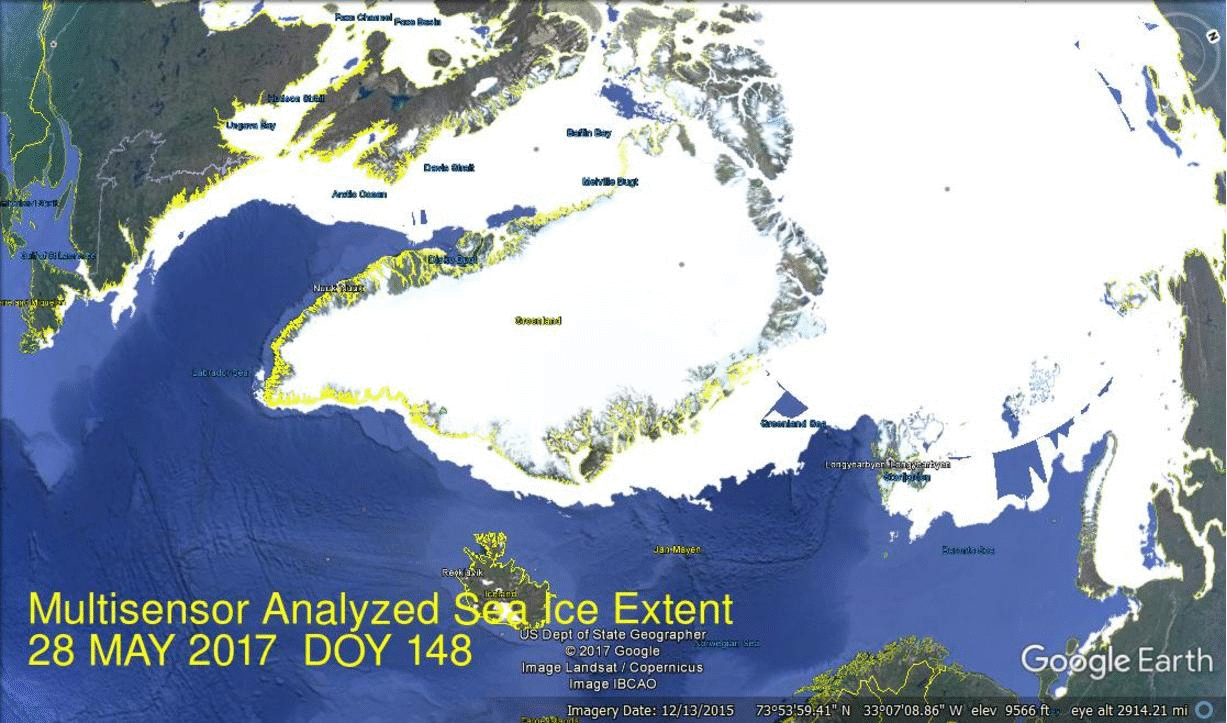
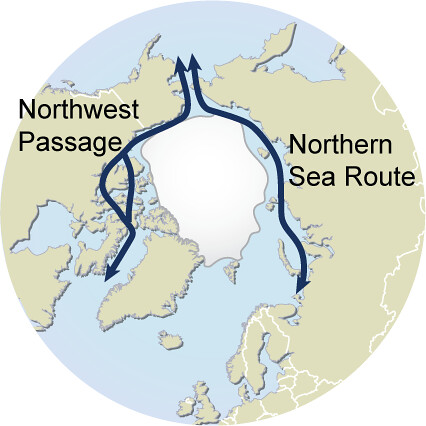
The image below shows the evolution of ice extents since 2007 along the Northern Sea Route.  The principal challenge for shipping is Laptev sea, and secondarily East Siberian and Kara seas.

Click on image to enlarge.

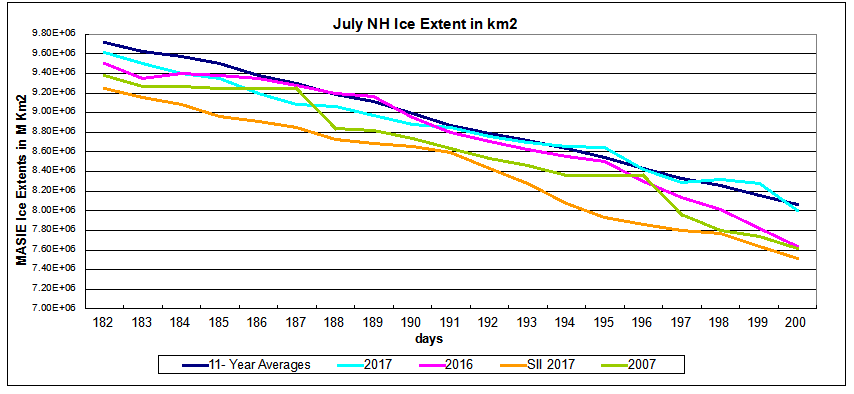
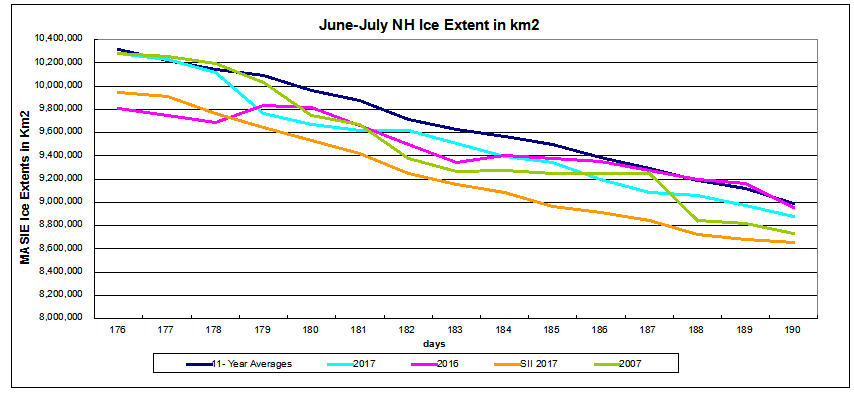
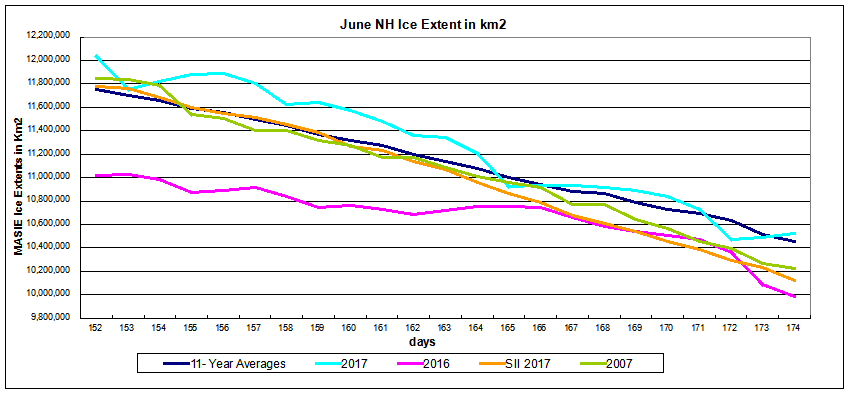
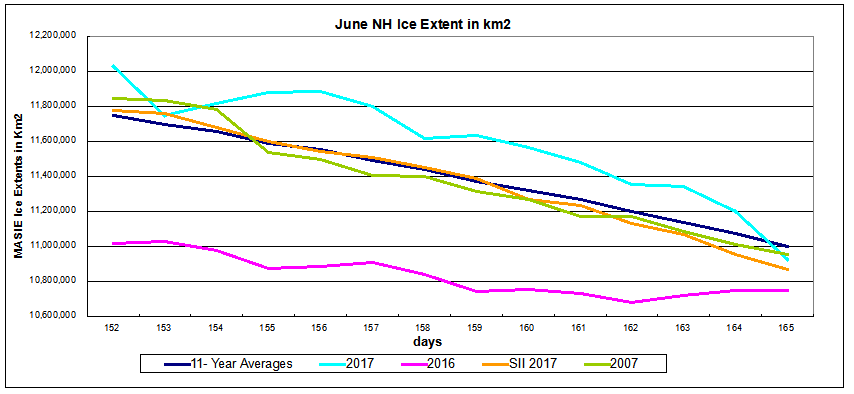
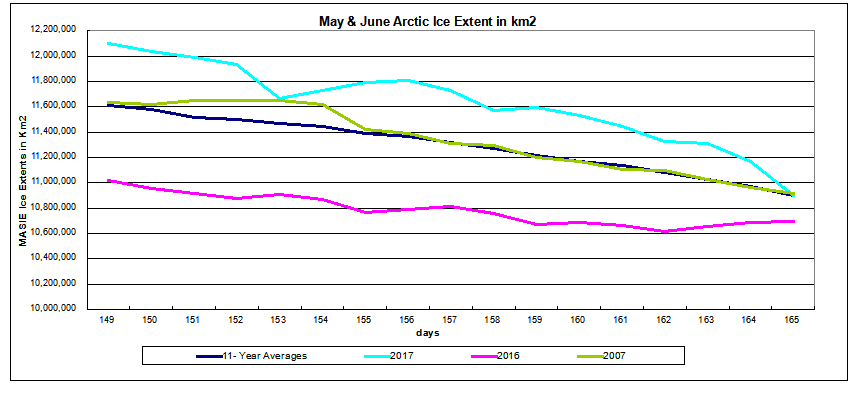
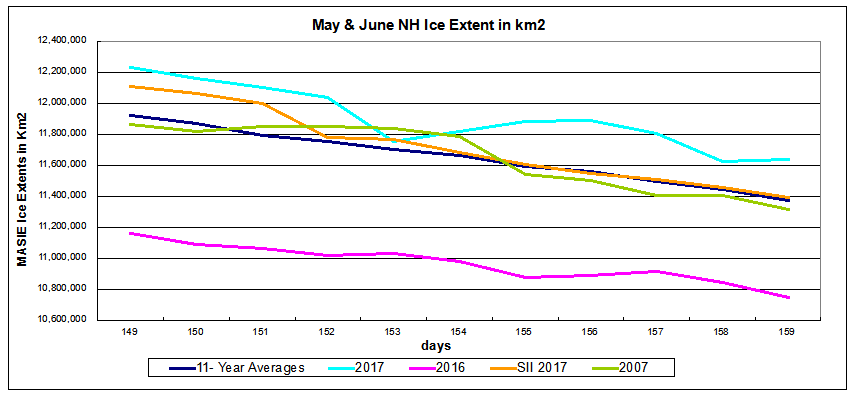
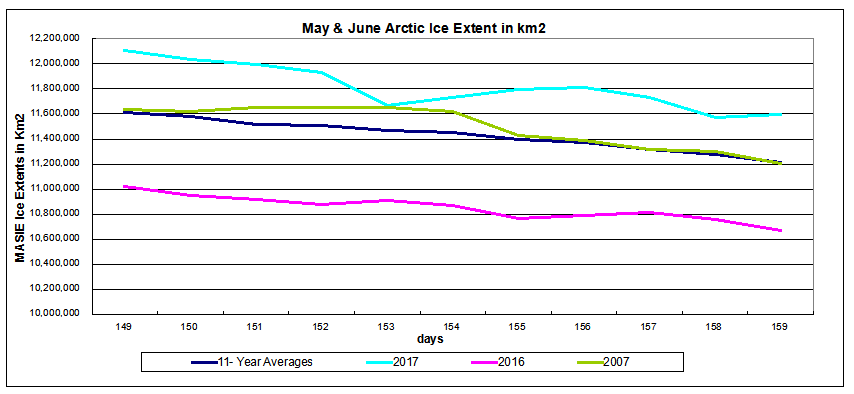
The graph below shows Arctic ice extents comparing 2017 to the eleven-year average, to 2016 and 2007, as well as SII estimates.

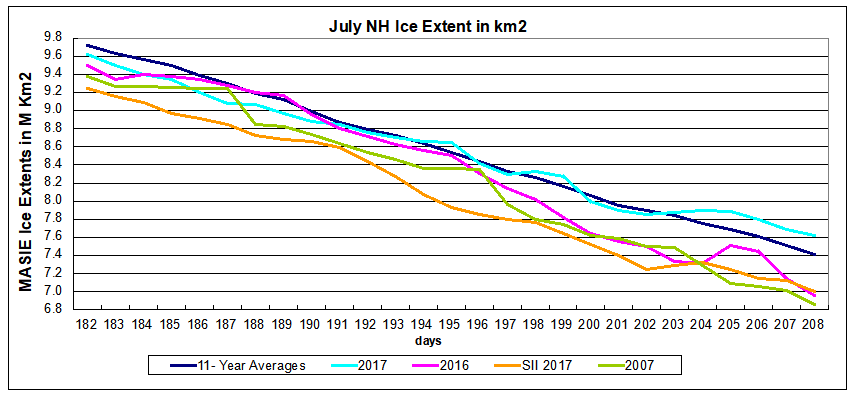
This year ice extents are ~200k km2 higher than average at day 208, 660k km2 greater than 2016, and 760k km2 surplus above 2007.  MASIE, with its higher resolution mapping shows 600k km2 more ice than Sea Ice Index (SII).

The table below presents the ice extents in various regions of the Arctic Ocean.

Region 2017208 Day 208
Average
2017-Ave. 2007208 2017-2007
 (0) Northern_Hemisphere 7616280 7412179 204101 6854322 761958
 (1) Beaufort_Sea 817086 800703 16383 731315 85771
 (2) Chukchi_Sea 501448 576407 -74959 410291 91157
 (3) East_Siberian_Sea 655273 859194 -203922 611838 43435
 (4) Laptev_Sea 595803 493098 102705 346484 249320
 (5) Kara_Sea 234885 216677 18208 263819 -28935
 (6) Barents_Sea 74162 33989 40173 38450 35713
 (7) Greenland_Sea 429112 337523 91590 350141 78971
 (8) Baffin_Bay_Gulf_of_St._Lawrence 351594 169554 182040 226232 125362
 (9) Canadian_Archipelago 584766 603827 -19062 585307 -542
 (10) Hudson_Bay 153623 172129 -18506 114225 39398
 (11) Central_Arctic 3217386 3146830 70556 3174877 42508

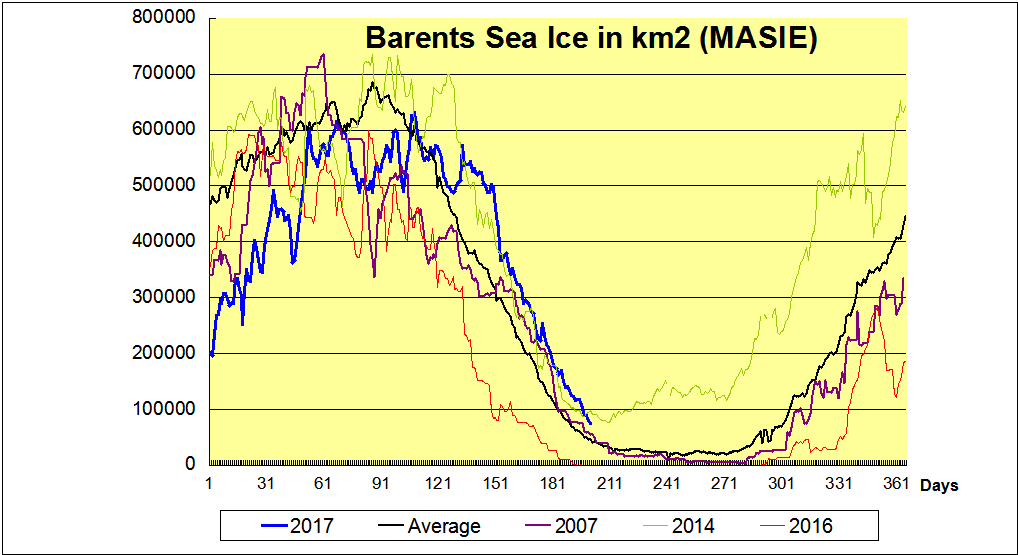
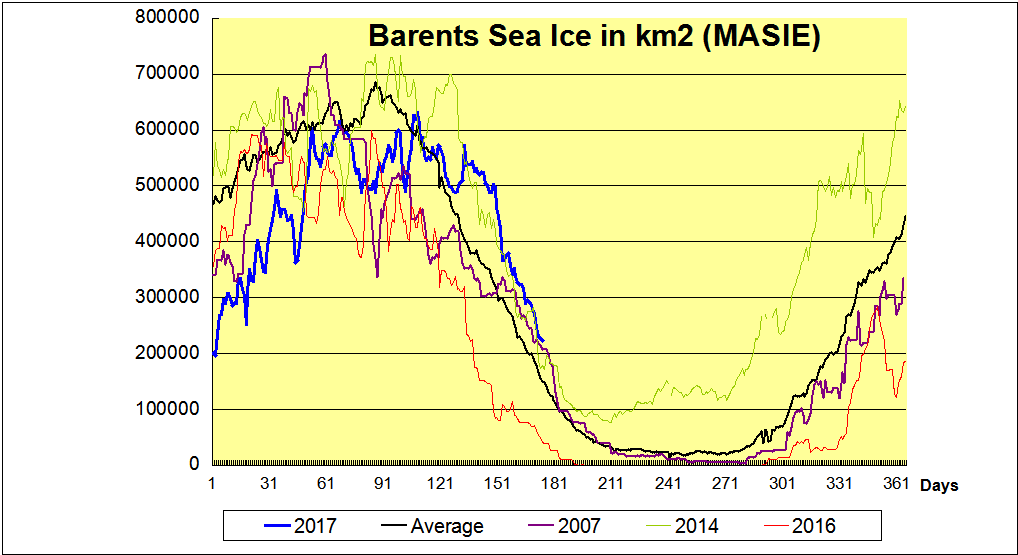
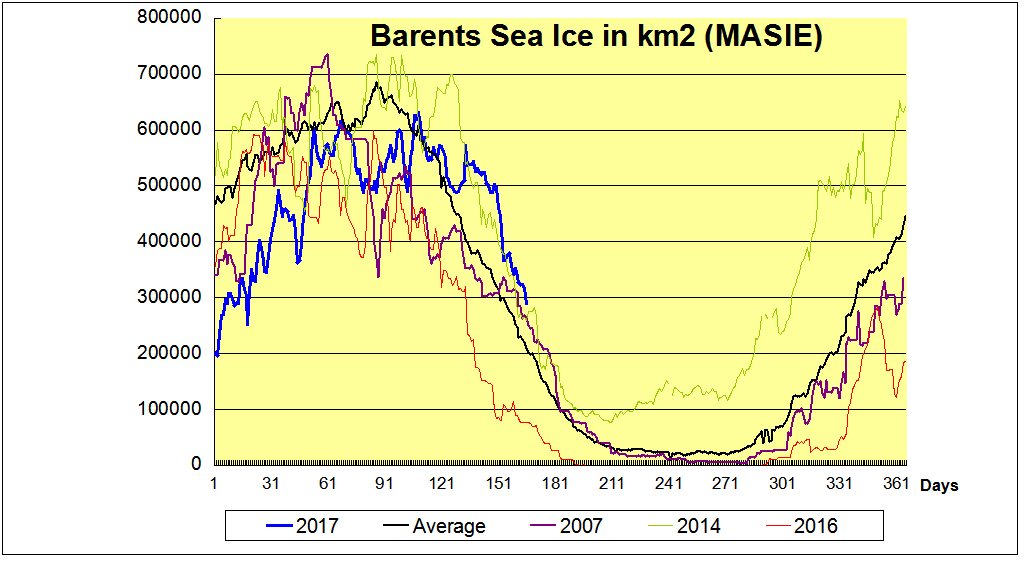
The only sizeable 2017 deficits to decadal average are in Chukchi and East Siberian seas.  Ice surpluses this year offset the losses, especially in Laptev, Greenland Sea, Baffin Bay and the Central Arctic.  Barents has been holding steady at the highest minimum of the decade, set by 2014.  2007 is eclipsed by 2017 in almost every region.

Varying Views of the Northern Sea Route

Text in image refers to events in 2013

Northern Sea Route Information Office

According to the data provided by the Northern Sea Route Information Office, traffic volume in 2016 has increased by 35% in comparison with 2015. However the traffic remained low with only 19 vessels using the route, far from the record set in 2013 with 71 vessels. Steep downturn started in 2014, the amount of cargo transported in transit dropping 77 per cent compared to the previous year.

The navigation season for transit passages on NSR starts approximately at the beginning of July and lasts through to the second half of November. There are no specific dates for commencement and completion of navigation; it all depends on particular ice conditions. In 2011 the navigation season on the NSR seaways for large vessels constituted 141 days in total, i.e. more than 4.5 months. In recent years quite easy ice conditions have been observed and that offers more considerable opportunities for operation at the NSR seaways. All NSR seaways are currently located in the area of one-year ice. In the arctic conditions one-year ice grows approximately up to 1.6 metres. Arktika-type icebreaker can open passages through up to 2.3m thick ice. In early July, at the beginning of navigation ice is not pressurized. The ice is broken and easily moved through. . . Therefore, in the current ice conditions vessels can navigate from July until December.

Malte Humpert, the strategic director and founder of the Arctic Institute

The NSR will not become a major shipping route. Not today and not in 2030 – or even 2050. As long as there is winter ice, which makes the Arctic Ocean unnavigable for part of the year, it will not be suitable for regular transit traffic.

There may be occasional voyages, as we have seen over the past few years, delivering timber from Finland to Canada, or Norwegian fish and LNG to Japan or iron ore to China. But the NSR will not see containerized cargo on which global trade operates. There are a host of reasons for that, the biggest ones being lack of schedule reliability and seasonability of the route, lack of ports of call and increased insurance premiums on the NSR over Suez.

As a comparison: the Suez Canal sees around 18,000 transits per year, the Panama Canal around 15,000, the Straits of Malacca around 65,000.

In the past five years taken together, the NSR saw around 200 transits, with most vessels being tiny compared to the giant container ships and bulk carriers passing through the world’s shipping hubs.

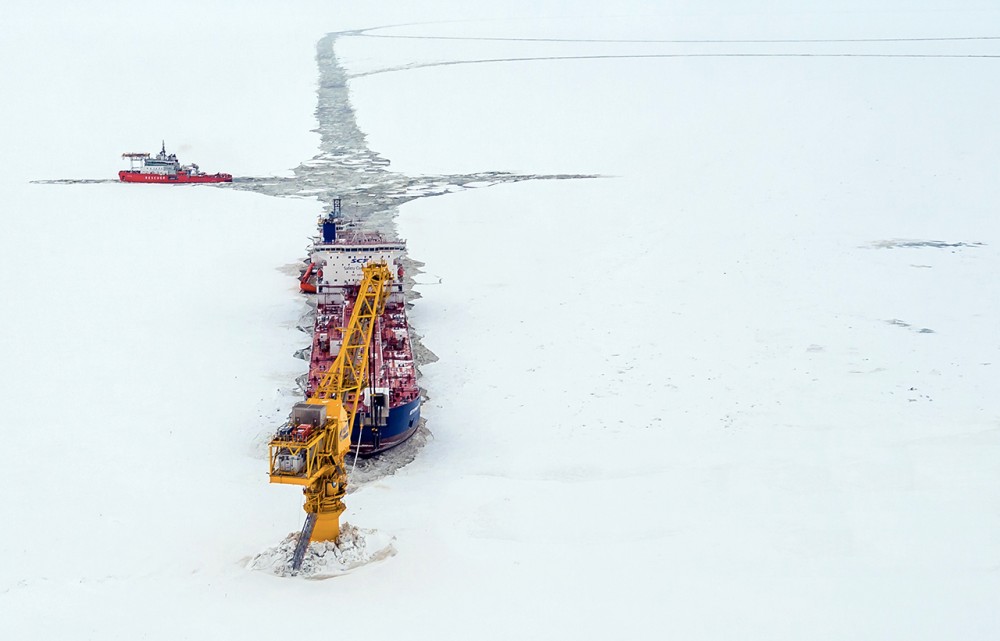
The 259 meters long, 34 meter wide «Shturman Albanov» in early May arrived in Murmansk with another load of oil from Novy Port, the new oil field in the Yamal Peninsula. It marked the 5th million ton of oil delivered from the field, operator Gazprom Neft informs.

In the course of the last 12 months, a total of 196 shiploads of oil have made from Yamal to Murmansk. Shipping company Sovcomflot now has three brand new Arc7 ice class tankers dedicated to shipments from the new Arctic field.

Resilient Arctic Ice


Source: NASA Worldview July 18, 2017. Click on image to enlarge.

July is showing again the resilience of Arctic ice this year. The graph below shows 2017 extents for the first 19 days of July compared to the average for the previous 11 years, to 2016, to 2007 and the SII (Sea Ice Index) estimates for 2017.

The graph shows 2017 holding to the decadal average and just yesterday dropping below 8M km2, one day ahead of average.  Meanwhile the other extents are much lower than 2017: 2016 is down 357k km2, 2007 is 379k km2 down, and SII shows 2017 480k km2 less than MASIE day 200.

As we shall see, this year’s extents are in surplus on the Atlantic side, offset by deficits on the Pacific side and in Hudson Bay.  The image shows the evolution of Arctic ice from 2007 to this year for day 200.

Click on image to enlarge.

The Table compares 2017 day 200 ice extents with the decadal average and 2007

Region 2017200 Day 200
Average
2017-Ave. 2007200 2017-2007
 (0) Northern_Hemisphere 7997823 8064957 -67133 7618029 379795
 (1) Beaufort_Sea 806596 819503 -12906 797272 9324
 (2) Chukchi_Sea 514591 619294 -104704 488952 25638
 (3) East_Siberian_Sea 744800 937942 -193142 707353 37447
 (4) Laptev_Sea 666317 584009 82308 455463 210854
 (5) Kara_Sea 321934 310630 11304 377648 -55714
 (6) Barents_Sea 74053 45893 28160 55933 18120
 (7) Greenland_Sea 478308 388587 89721 375816 102492
 (8) Baffin_Bay_Gulf_of_St._Lawrence 371429 238537 132893 278443 92986
 (9) Canadian_Archipelago 624373 685089 -60717 686749 -62376
 (10) Hudson_Bay 172045 258697 -86652 170690 1355
 (11) Central_Arctic 3222235 3173093 49143 3221912 323

2007 overall ice extent on day 200 was lower by 380k km2, 2017 showing surpluses everywhere except Kara and CAA (Canadian Arctic Archipelago).  Compared to the decadal average, the 2017 larger deficits are in the Pacific ( Chukchi and East Siberian) and in Canada (Hudson Bay and CAA).  These are offset by above average extents elsewhere, especially in Laptev, Greenland, Baffin and Central Arctic. Barents is still surplus to average, but has now fallen behind 2014 as the highest in the last decade.

The black line is average for the last 11 years.  2007 in purple appears close to an average year.  2014 had the highest annual extent in Barents Sea, due to higher and later maximums, holding onto ice during the summer, and recovering quickly.  In contrast, 2016 was the lowest annual extent, melting out early and recovering later.  2017 in blue started out way behind, but grew rapidly to reach average, and then persisted longer to exceed even 2014 before falling behind just recently.

For more on why Barents Sea matters see Barents Icicles


July 10 Arctic Ice Report

The extent of Arctic ice fell to a new wintertime low in March 2017. But springtime ice persisted and June and July are hanging around the decadal average.

The graph shows the last two weeks ending day 190, July 9, 2017.  2016 and 2017 are nearly average and lower than 9M km2, while 2007 is about 150k km2 down, and SII 2017 even lower. The recent drop was largely due to Hudson Bay going to open water in just ten days (images at Ten Days in Hudson Bay).

As we shall see, this year’s extents are in surplus on the Atlantic side, offset by deficits on the Pacific side and in Hudson Bay.  The image compares day 190 with one year ago.

The Table compares 2017 day 190 ice extents with the decadal average and 2007

Region 2017190 Day 190
Average
2017-Ave. 2007190 2017-2007
 (0) Northern_Hemisphere 8877716 8991896 -114181 8732146 145570
 (1) Beaufort_Sea 825960 866156 -40196 860404 -34443
 (2) Chukchi_Sea 563718 683345 -119626 609005 -45287
 (3) East_Siberian_Sea 868691 1000309 -131618 871751 -3060
 (4) Laptev_Sea 719324 674515 44809 647038 72285
 (5) Kara_Sea 538340 437243 101097 499369 38971
 (6) Barents_Sea 125872 69548 56324 77180 48692
 (7) Greenland_Sea 563021 450768 112253 475611 87410
 (8) Baffin_Bay_Gulf_of_St._Lawrence 419134 364194 54941 379529 39606
 (9) Canadian_Archipelago 702592 750592 -48000 743621 -41030
 (10) Hudson_Bay 306542 499414 -192873 360041 -53499
 (11) Central_Arctic 3243319 3183825 59494 3205488 37831

The deficits in BCE (Beaufort, Chukchi, East Siberian) are offset by surpluses elsewhere.  2017 would be above average were it not for the 193k km2 deficit in Hudson Bay.

The graph below shows Barents this year continues to be above average matching the record year of 2014.  It will be interesting to see if 2017 hits its minimum around day 210 like 2014 did.


The black line is average for the last 11 years.  2007 in purple appears close to an average year.  2014 had the highest annual extent in Barents Sea, due to higher and later maximums, holding onto ice during the summer, and recovering quickly.  In contrast, 2016 was the lowest annual extent, melting out early and recovering later.  2017 in blue started out way behind, but grew rapidly to reach average, and then persisted longer to exceed even 2014.  It may yet beat out 2014 as the highest in the last 11 years.

For more on why Barents Sea matters see Barents Icicles


Climate Compilation II Arctic Sea Ice

The background for the compilation series is provided in the first post along with my starting point analyzing temperature records. See Climate Compilation Part I Temperatures

Compilation II Arctic Sea Ice (link to category) 

Another preoccupation has been the fluctuating Arctic Sea Ice extents. I noticed that warmists were quite focused on this issue, especially the annual minimums in September. And despite the long record of ice charts prepared by naval authorities, all the ice watchers referred almost exclusively to the satellite estimates, especially the NASA team results published as the Sea Ice Index (SII) on NSIDC.

In the past some researchers had preferred the ice charts from the NIC (US Naval Ice Center, now National Ice Center) and noted differences between operational observations from NIC and the satellite estimates that rely on passive microwave sensors. The NIC index is called MASIE (Multisensor Analyzed Sea Ice Extent), has a higher resolution, higher threshold for declaring a grid cell ice-filled, and generally shows more ice extent than SII.

MASIE: “high-resolution, accurate charts of ice conditions”
Walt Meier, NSIDC, October 2015 article in Annals of Glaciology.

My concern is to raise awareness of a high quality sea ice record that has been largely ignored by a myopic focus on satellite estimates. Periodic ice reports can be found on this blog on a bi-monthly basis.

Sometimes there are storms or other surprising events to report, such as the late additional freezing in January that trapped Russian ships shown in the image above and posted as Arctic Ice Takes Revenge.

Last year it was also interesting to follow the progress of the Polar Challenge sailing ship Northabout as well as the cruise ship Serenity passing through the Arctic seas and the Canadian Arctic Archipelago. For example see Arctic Ships Past Halfway from Aug. 29, 2016.

This category also includes several discussions of research into the Arctic climate system from lesser-known but highly regarded sources like the prestigious AARI: Arctic and Antarctic Research Institute St. Petersburg, Russia. See Arctic Sea Ice: Self-Oscillating System and The Great Arctic Ice Exchange

Over time I have learned how to use the visual files MASIE provides in Google Earth formats. For example, these images of sea ice waxing and waning in Hudson Bay.

Hudson Bay is providing a great example how ice extents can change dramatically in such a relatively shallow basin near the Arctic circle. Last December 2016 some concerns were expressed about the lack of ice in Hudson Bay, which were suddenly overcome in ten days starting December 9. Watch:

Now fast-forward to this spring 2017 when ice was persisting strongly in both Baffin and Hudson Bays. Starting ten days ago on June 18 Summer is showing us how quickly goes the opposite effect, including a major meltdown the last two days. On the right side you can see Newfoundlanders are finally rid of their ice.

For an overview of Arctic Ice Watching along with some amusement, see Ice House of Mirrors.

For a comparison of SII and MASIE see A Tale of Two Indices

June Arctic Ice Report

The extent of Arctic ice fell to a new wintertime low in March 2017. But springtime ice persisted and in June is hanging around the decadal average.

The first half of June this year’s extent was above the decadal average despite early melting in Bering and Okhotsk Seas,  Those two Pacific basins are now ice-free, typical for end of June.  Presently 2017 is tied with 2016 and 2007 about 200k km2 below average.  The recent drop was largely due to Hudson Bay going to open water in just ten days (images at Ten Days in Hudson Bay).

For the month, average extent in 2017 was 11M km2 compared to the the decadal average of 10.9M km2, ranking this year fifth since 2006.  SII 2017 average for June was 10.7M km2 and is presently showing 200k km2 less ice than MASIE does with its higher resolution.  During June more than 2M km2 ice extent was lost and presently stands at 65% of the March maximum.

The Table compares 2017 day 181 ice extents with the decadal average and 2007.

Region 2017181 Day 181
Average
2017-Ave. 2007181 2017-2007
 (0) Northern_Hemisphere 9620537 9846173 -225636 9672969 -52433
 (1) Beaufort_Sea 855383 920779 -65397 939209 -83826
 (2) Chukchi_Sea 614011 743161 -129151 670088 -56077
 (3) East_Siberian_Sea 926510 1029639 -103129 901963 24547
 (4) Laptev_Sea 788796 734392 54403 658742 130053
 (5) Kara_Sea 585573 563477 22096 657478 -71904
 (6) Barents_Sea 177110 112663 64447 130101 47010
 (7) Greenland_Sea 575056 518393 56663 548399 26657
 (8) Baffin_Bay_Gulf_of_St._Lawrence 489797 497536 -7739 450461 39336
 (9) Canadian_Archipelago 775934 777916 -1982 773611 2323
 (10) Hudson_Bay 585228 705394 -120166 718441 -133212
 (11) Central_Arctic 3245272 3210630 34642 3218999 26273
 (12) Bering_Sea 0 11808 -11808 981 -981
 (13) Baltic_Sea 0 6 -6 0 0
 (14) Sea_of_Okhotsk 695 18917 -18222 2983 -2288

The pattern continues with seas on the Pacific side showing deficits to average, while Atlantic Arctic seas show surpluses.  Bering and Okhotsk averages are still 30k km2 higher but will soon disappear.  The noticeable deficits are in BCE (Beaufort, Chukchi and East Siberian) and in Hudson Bay.

Barents Sea demonstrates the surplus of 2017 sea ice extents inside the Arctic Circle.  The graph below shows Barents this year continues to be above average matching the record year of 2014.

The black line is average for the last 11 years.  2007 in purple appears close to an average year.  2014 had the highest annual extent in Barents Sea, due to higher and later maximums, holding onto ice during the summer, and recovering quickly.  In contrast, 2016 was the lowest annual extent, melting out early and recovering later.  2017 in blue started out way behind, but grew rapidly to reach average, and then persisted longer to exceed even 2014.  It may yet beat out 2014 as the highest in the last 11 years.

For more on why Barents Sea matters see Barents Icicles


Ten Days in Hudson Bay

Hudson Bay is providing a great example how ice extents can change dramatically in such a relatively shallow basin near the Arctic circle.  Last December 2016 some concerns were expressed about the lack of ice in Hudson Bay, which were suddenly overcome in ten days starting December 9.  Watch:

Polar bears of course were delighted to have a white Christmas.

Now fast-forward to this spring 2017 when ice was persisting strongly in both Baffin and Hudson Bays. Starting ten days ago on June 18 Summer is showing us how quickly goes the opposite effect, including  a major meltdown the last two days.  On the right side you can see Newfoundlanders are finally rid of their ice.

For the record, Hudson Bay grew 663k km2 of ice in ten December days, and it lost 474k km2 of ice in these last ten days of June.

Don’t worry about the polar bears, they also love to swim.

There is no predicting the Arctic ice situation week in and out, though many are trying.  The polar bears adapt and so shall we.  Meanwhile, it is a joy watching to see what happens.

Ice Ice Everywhere, Not a Drop to Drink

The Rime of the Ancient Mariner

Three weeks into June, Arctic ice is still plentiful  The graph below show ice extents up to yesterday, June 23, 2017, day 174.

After a dip, 2017 is again above the decadal average, 300k km2 greater than 2007, and 500k km2 larger than 2016.  SII 2017 is presently showing 400k km2 less ice than MASIE does with its higher resolution.  2016 went below 10M km2 for the first time on its way to an annual minimum of 4.2M in September.

Barents Sea shows a surplus of 2017 sea ice extents inside the Arctic Circle.  The graph below shows Barents this year compared to average and other years.

The black line is average for the last 11 years.  2007 in purple appears close to an average year.  2014 had the highest annual extent in Barents Sea, due to higher and later maximums, holding onto ice during the summer, and recovering quickly.  In contrast, 2016 was the lowest annual extent, melting out early and recovering later.  2017 in blue started out way behind, but grew rapidly to reach average, and then persisted longer to exceed even 2014.  It may yet beat out 2014 as the highest in the last 11 years.

What a difference a year makes.

The table below shows day 174 ice extents in total and by regions for 2017 compared to the decadal average and 2007.

Region 2017174 Day 174
Average
2017-Ave. 2007174 2017-2007
 (0) Northern_Hemisphere 10526281 10452265 74016 10222886 303395
 (1) Beaufort_Sea 879223 950985 -71762 937004 -57781
 (2) Chukchi_Sea 654738 779757 -125019 702860 -48122
 (3) East_Siberian_Sea 995761 1050504 -54742 991145 4616
 (4) Laptev_Sea 802192 761406 40785 698410 103781
 (5) Kara_Sea 684120 650542 33578 687443 -3323
 (6) Barents_Sea 223133 150741 72392 206816 16317
 (7) Greenland_Sea 558685 549299 9386 549654 9031
 (8) Baffin_Bay_Gulf_of_St._Lawrence 713168 627004 86164 624502 88666
 (9) Canadian_Archipelago 788679 790846 -2167 780041 8637
 (10) Hudson_Bay 961113 880059 81054 810482 150632
 (11) Central_Arctic 3245726 3213273 32452 3219126 26599
 (12) Bering_Sea 3489 21931 -18442 5743 -2254
 (13) Baltic_Sea 0 9 -9 0 0
 (14) Sea_of_Okhotsk 15063 24399 -9335 7983 7080

You can see that Pacific melting is producing deficits to average that are more than offset by surpluses elsewhere.  Bering and Okhotsk started first, but are now inconsequential.  BCE ( Beaufort, Chukchi and East Siberian) combined are about 250k km2  below average.  On the Atlantic side, the largest surpluses appear in Barents, Baffin and Hudson Bay, while the Central Arctic is still at its annual maximum.

For more on why Barents Sea matters see Barents Icicles

Meanwhile, some Newfoundland harbours are still full of ice.

Ice in the harbour – Raleigh, Great Northern Peninsula. Still blocked by ice a week ago. h/t Newfoundsander


Mid-June Arctic Ice Persisting

Environment Canada photo shows ice on the water near Newfoundland.

Icebreaker CCGS Amundsen diverted from science mission, continues search and rescue work

CBC June 12, 2017
Environment and Climate Change Canada said ice conditions improved slightly on Monday in the Strait of Belle Isle but continue to be troubling off the northeast coast of Newfoundland, which is seeing a higher than normal concentration of ice.

“Typically there would be very little or no ice left in either of these areas at this time of year, let alone the thick ice pack we are currently seeing off the northeast coast of Newfoundland,” a spokesperson for the federal department said in an email.

PolarBearScience described how the ice situation was not a matter of climate change but developed this spring caused by winds, cold temperatures and icebergs.

The tour (record of reports) is illuminating because it shows the development of the thick ice over time and shows how strong winds from a May storm combined with an extensive iceberg field contributed to the current situation. . .By 11 June the ice charts show little ice off southern Labrador but thick first year ice but lots of “old ice” in many places around northern Newfoundland. These must be crushed or compressed icebergs incorporated into the thick first year pack ice.

The image above shows the icing pattern on the European side. beyond Canada.  Compared to 2016, Svalbard  and Franz Joseph Land coastlines are much more enclosed.  Along the Russian coast of Kara, the water is opening up sooner. The graph below shows the first 14 days of June.  2017 was holding a lead of  200k km2 above average and 2007, and much greater than 2016.  Yesterday 2017 extent dropped 270k km2 to erase the lead at this time.

The graph below excludes the Pacific seas of Okhotsk and Barents, which are melting early (~70k km2 below average as of yesterday) somewhat obscuring what is happening in central and Atlantic Arctic seas.

On this basis, 2017 is matching both average and 2007, and about 200k km2 more than 2016.

Barents Sea shows how unusual are 2017 sea ice extents inside the Arctic Circle.  The graph below shows Barents this year compared to average and other years.

The black line is average for the last 11 years.  2007 in purple appears as an average year.  2014 had the highest annual extent in Barents Sea, due to higher and later maximums, holding onto ice during the summer, and recovering quickly.  In contrast, 2016 was the lowest annual extent, melting out early and recovering later.  2017 in blue started out way behind, but grew rapidly to reach average, and is still persisting to exceed even 2014.

The table below shows extents on day 165 in the various Northern seas where ice is found.

Region 2017165 Day 165
Average
2017-Ave. 2007165 2017-2007
 (0) Northern_Hemisphere 10928458 11000746 -72289 10959202 -30745
 (1) Beaufort_Sea 935191 975491 -40301 952869 -17678
 (2) Chukchi_Sea 682164 821629 -139465 770182 -88018
 (3) East_Siberian_Sea 999972 1058898 -58926 1040890 -40918
 (4) Laptev_Sea 823309 788892 34417 755629 67680
 (5) Kara_Sea 656401 731264 -74864 770755 -114355
 (6) Barents_Sea 289358 208784 80574 264253 25105
 (7) Greenland_Sea 586915 577208 9707 574726 12189
 (8) Baffin_Bay_Gulf_of_St._Lawrence 826222 728139 98083 778469 47753
 (9) Canadian_Archipelago 810834 796994 13841 781578 29256
 (10) Hudson_Bay 1053785 995845 57940 997061 56724
 (11) Central_Arctic 3232751 3219736 13015 3224700 8051
 (12) Bering_Sea 13160 51203 -38043 15285 -2126
 (13) Baltic_Sea 0 9 -9 0 0
 (14) Sea_of_Okhotsk 17207 45161 -27955 31131 -13924

The difference between 2017 and average is matched by the early losses in Bering and Okhotsk.  Otherwise, there are some early meltings in BCE (Beaufort, Chukchi, East Siberian) and Kara, offset by surpluses everywhere else.

For more on why Barents Sea matters see Barents Icicles


June Arctic Ice Still Strong

June 8, 2017. Boats are shown trapped in heavy ice off La Scie, Newfoundland in a handout photo from the Department of Fisheries and Ocean. Thick Arctic pack ice has trapped multiple vessels and triggered a high-stakes rescue operation from a sinking ship off Newfoundland. (THE CANADIAN PRESS/HO-Department of Fisheires and Oceans)

Thick Arctic ice pack traps boats, triggers rescue operation off Newfoundland

Unusually heavy Arctic pack ice has trapped multiple vessels, stymied the fishing season and triggered a high-stakes rescue operation from a sinking ship off Newfoundland.

Trevor Hodgson, the Canadian Coast Guard’s superintendent of ice operations for the Atlantic region, said the heavy ice is more than two metres thick in some areas off the province’s northeast coast.

What’s unusual this year, Hodgson said, is the way the winds have pushed the thick pack ice towards land rather than out to sea.

He said ice conditions are so bad the Coast Guard has been unable to free trapped vessels with its icebreaker Amundsen. Three fishing vessels remain trapped in ice off northeastern Newfoundland.

The image above shows Arctic Atlantic sea ice continues to hold most of the coastline in its grip.  Svalbard is still mostly enclosed and Newfoundland upper left with packed ice as in the photo. The graph below shows the last 10 days with 2017 holding a lead of  260k km2 above average, 320k km2 more than 2007 and 900k km2 greater than 2016.

The graph below excludes the Pacific seas of Okhotsk and Barents, which are melting early (~100k km2 below average as of yesterday) obscuring what is happening in central and Atlantic Arctic seas.

On this basis, 2017 is running 400k km2 higher than both average and 2007, and the same 900k km2 more than 2016.

Barents Sea shows how unusual are 2017 sea ice extents inside the Arctic Circle.  The graph below shows Barents this year compared to average and other years.

The black line is average for the last 11 years.  2007 in purple appears as an average year.  2014 had the highest annual extent in Barents Sea, due to higher and later maximums, holding onto ice during the summer, and recovering quickly.  In contrast, 2016 was the lowest annual extent, melting out early and recovering later.  2017 in blue started out way behind, but grew rapidly to reach average, and then persisted longer to exceed even 2014.

For more on why Barents Sea matters see Barents Icicles

The Iceberg Festival wraps up this weekend.

Arctic Ice Song: Hey June, Don’t Let Me Down

The Iceberg Festival takes place every June on the Great Northern Peninsula, Newfoundland, now underway.

Weather Canada Iceberg Bulletin
Issued 11:00 AM EDT 2 June 2017

Special ice warning in effect.
Bergy water except 7 tenths of first-year ice including a trace of
old ice in the northern section. Unusual presence of sea ice.

Iceberg Count
More than 100 icebergs

East Coast Newfoundland Sea Ice 2016 and 2017.

Arctic ice had a remarkable May. The April NH ice extent in April was a 343k km2 deficit below the decadal average, and May ended with a monthly average surplus of 131k km2. The graph below shows in recent weeks how 2017 took a lead of ~300k km2 above average and is holding it entering June.

On June 1, this year’s ice extent is running 280k km2 above average, and a full 1M higher than 2016. Out of the last twelve years, only 2013 and 2014 had more ice on this day than 2017.

The graph below excludes the Pacific seas of Okhotsk and Barents, which are melting early (~150k km2 below average) and distort what is happening in central and Atlantic Arctic seas.

On this basis, 2017 is running 280k km2 higher than 2007, 430k km2 above average, and 910k km2 more than 2016.

Good news for the Iceberg Festival, for the Fishermen not so much.

Twillingate fishery stuck in ice, shrimp plant future uncertain
CBC June 1, 2017:  No boats coming and going through ice-filled harbour

Ice has started to break up near the wharf in Twillingate, but it could take another couple of weeks before boats could come and go freely. (Garrett Barry/CBC)

The town hasn’t seen ice last this long for decades, according to Gord Noseworthy, mayor and harbour master. It means many boats can’t get out of Twillingate, and those that do aren’t coming back to the wharf.