Mid-June Arctic Ice Persisting

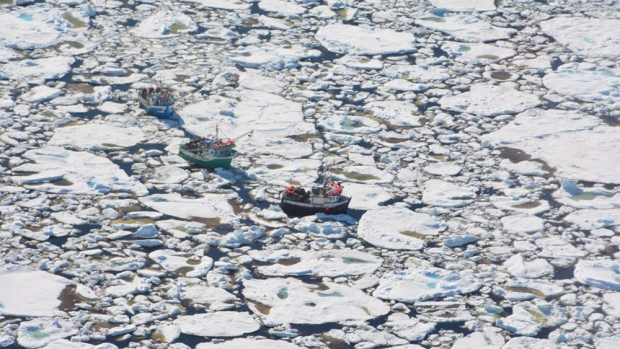
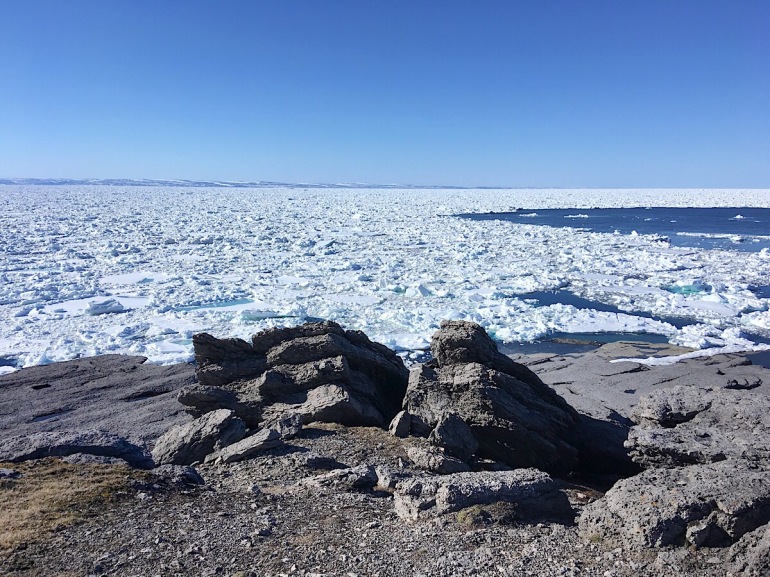
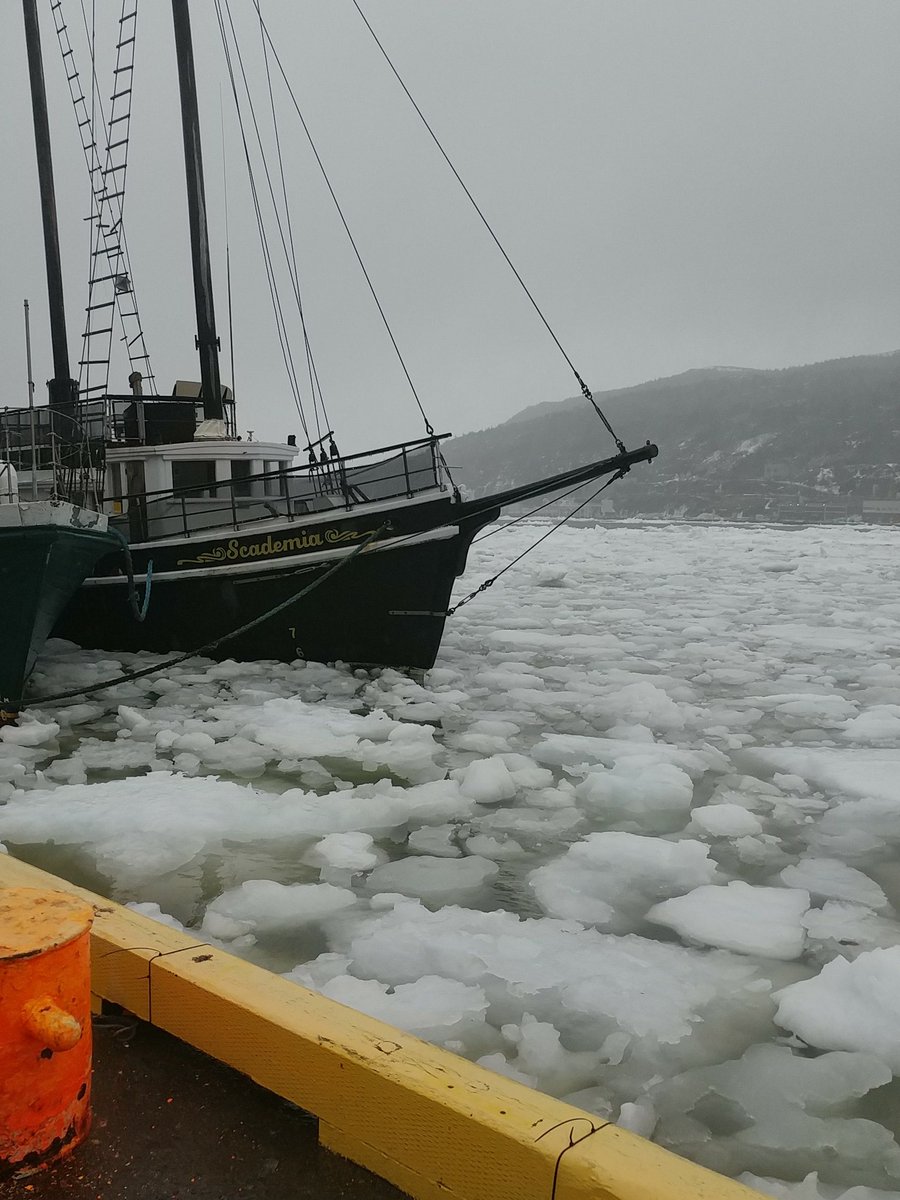
Environment Canada photo shows ice on the water near Newfoundland.
Icebreaker CCGS Amundsen diverted from science mission, continues search and rescue work
CBC June 12, 2017
Environment and Climate Change Canada said ice conditions improved slightly on Monday in the Strait of Belle Isle but continue to be troubling off the northeast coast of Newfoundland, which is seeing a higher than normal concentration of ice.
“Typically there would be very little or no ice left in either of these areas at this time of year, let alone the thick ice pack we are currently seeing off the northeast coast of Newfoundland,” a spokesperson for the federal department said in an email.
PolarBearScience described how the ice situation was not a matter of climate change but developed this spring caused by winds, cold temperatures and icebergs.
The tour (record of reports) is illuminating because it shows the development of the thick ice over time and shows how strong winds from a May storm combined with an extensive iceberg field contributed to the current situation. . .By 11 June the ice charts show little ice off southern Labrador but thick first year ice but lots of “old ice” in many places around northern Newfoundland. These must be crushed or compressed icebergs incorporated into the thick first year pack ice.
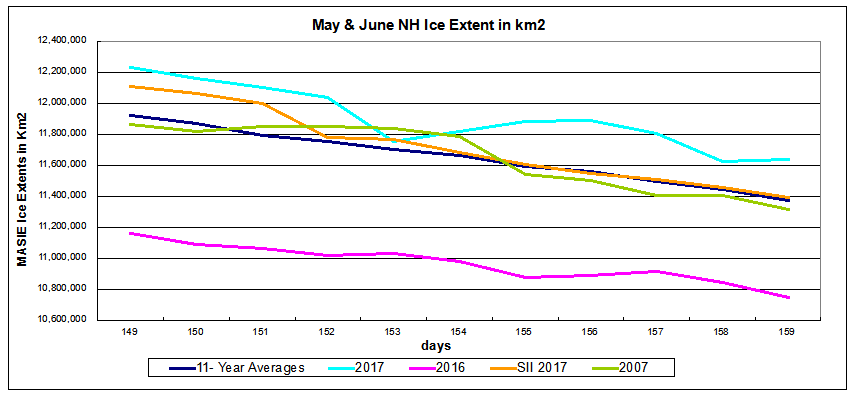
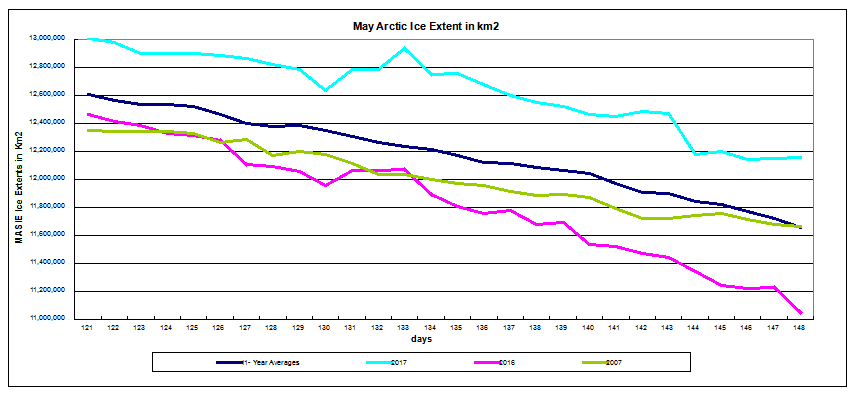
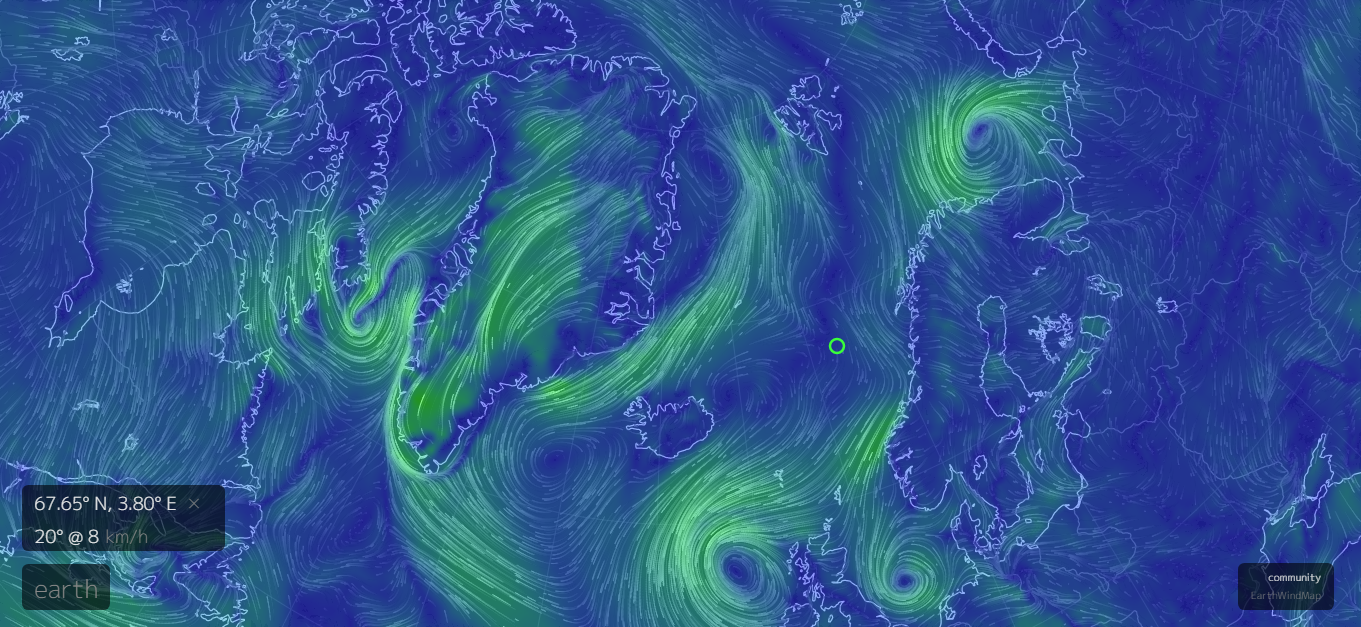
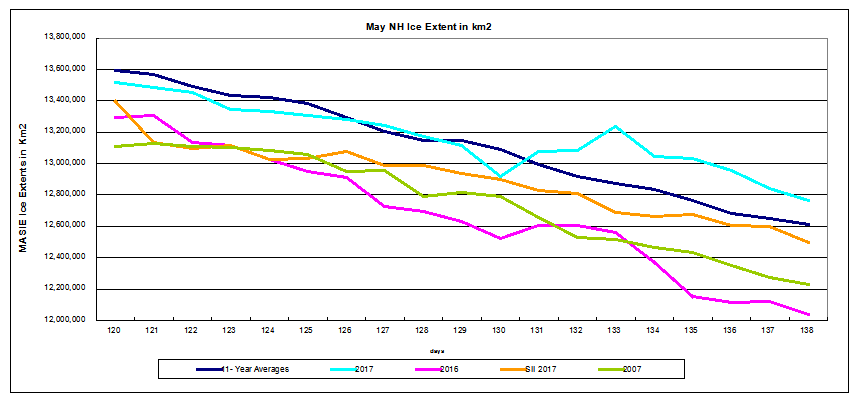
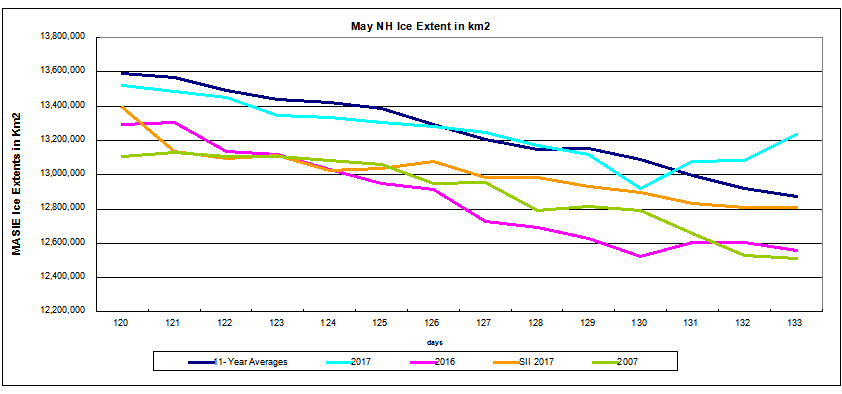
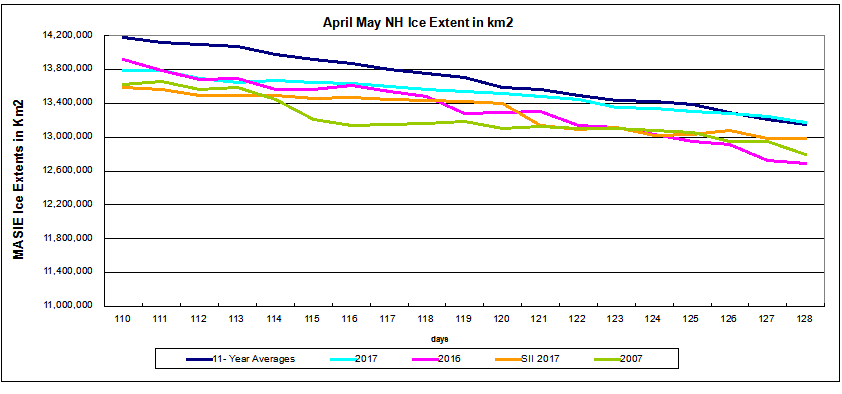
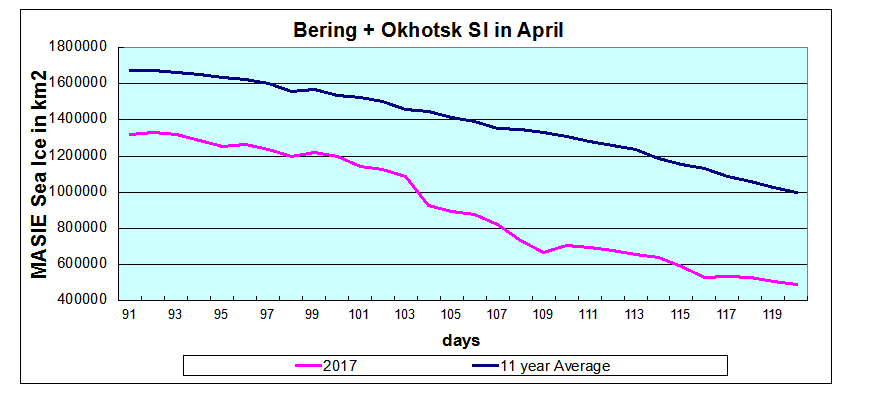
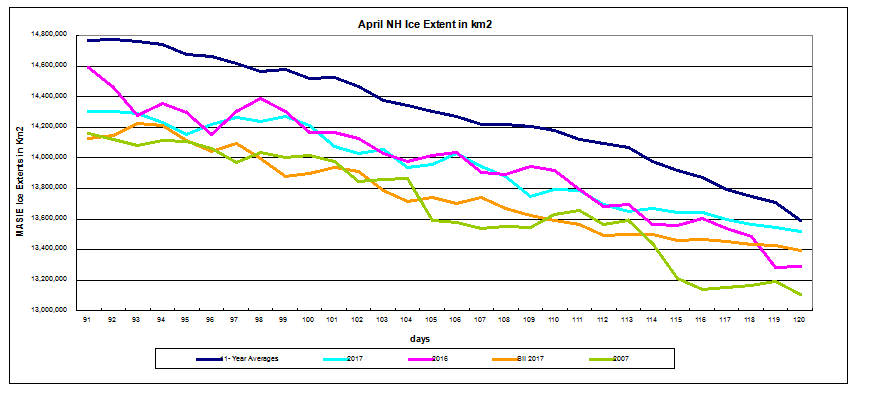
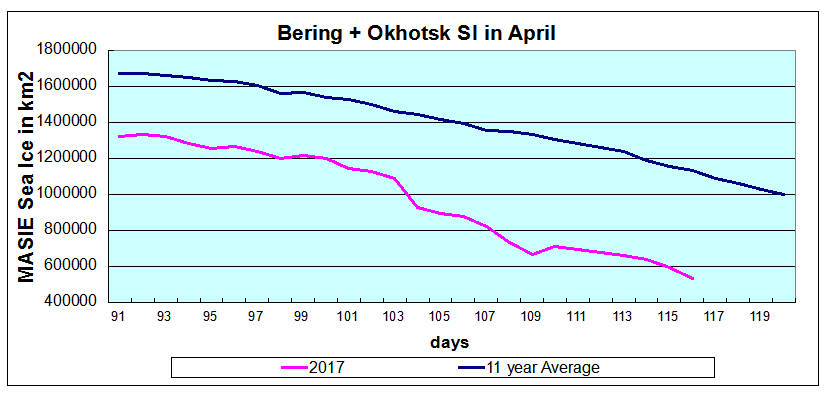
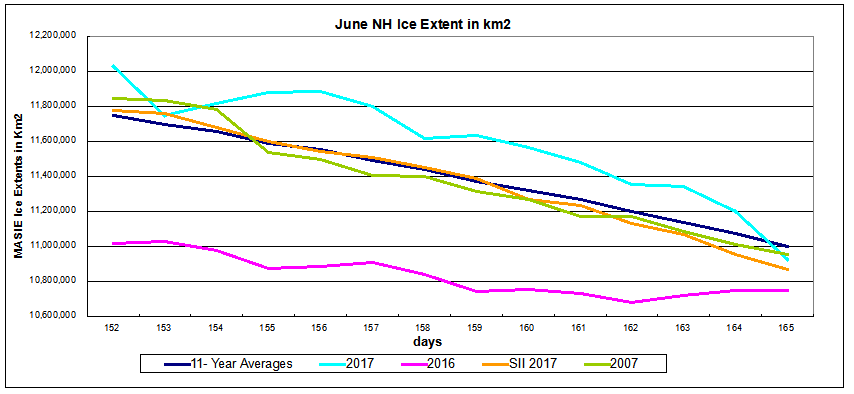
The image above shows the icing pattern on the European side. beyond Canada. Compared to 2016, Svalbard and Franz Joseph Land coastlines are much more enclosed. Along the Russian coast of Kara, the water is opening up sooner. The graph below shows the first 14 days of June. 2017 was holding a lead of 200k km2 above average and 2007, and much greater than 2016. Yesterday 2017 extent dropped 270k km2 to erase the lead at this time.
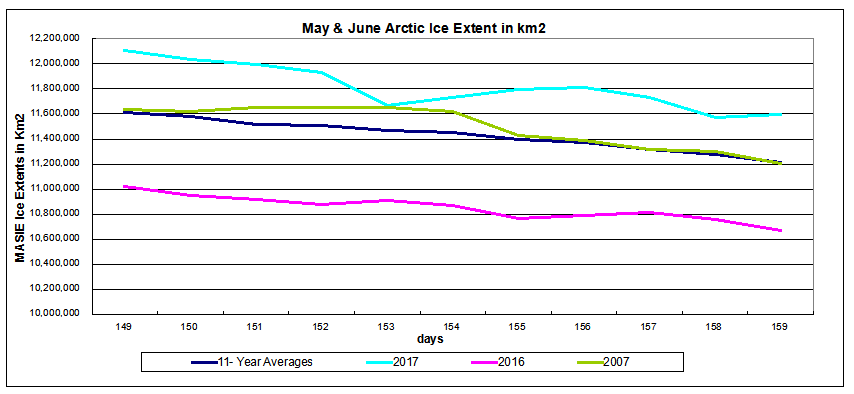
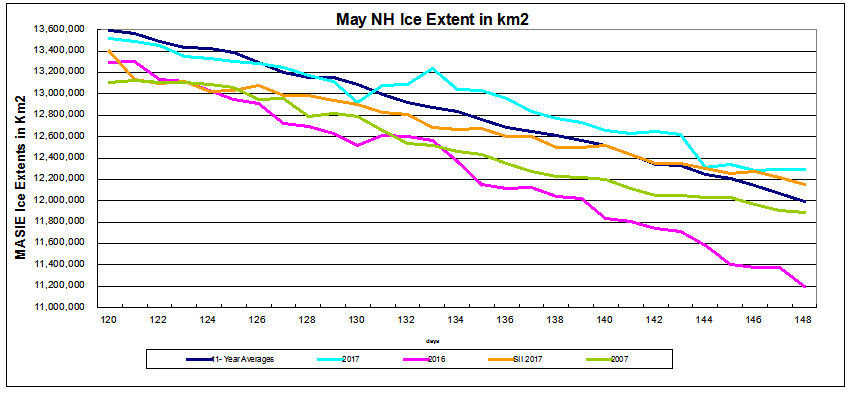
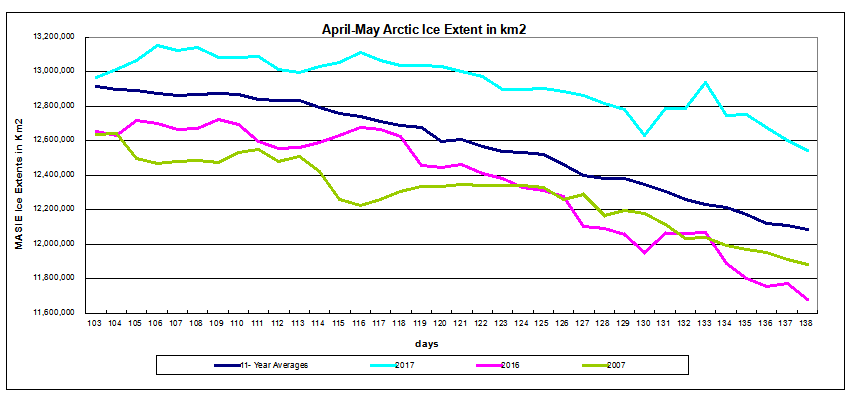
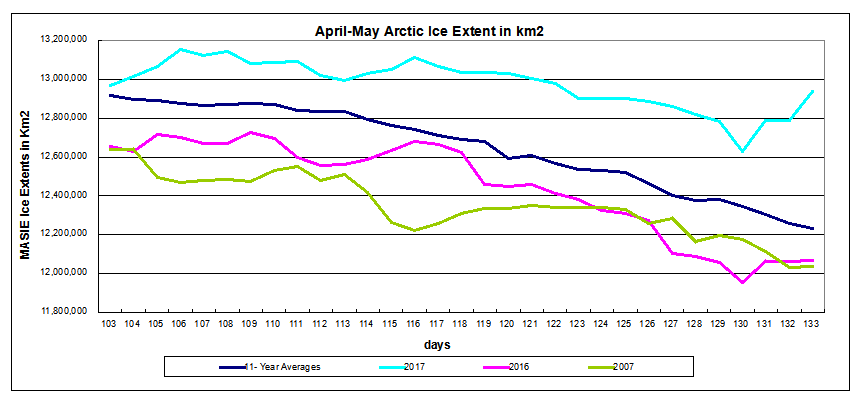
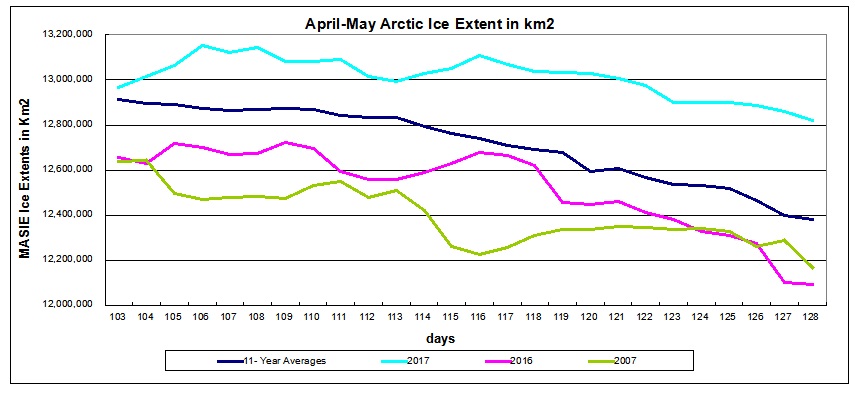
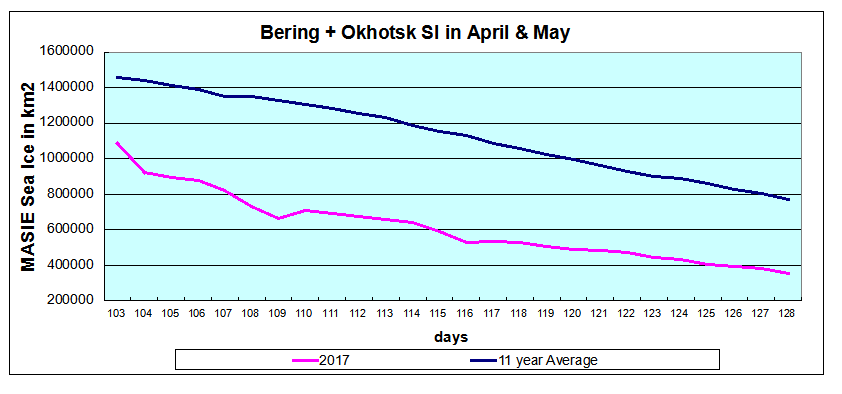
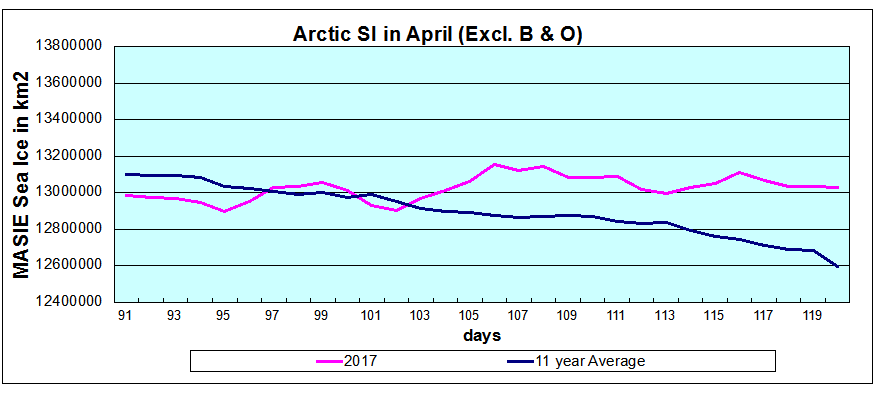
The graph below excludes the Pacific seas of Okhotsk and Barents, which are melting early (~70k km2 below average as of yesterday) somewhat obscuring what is happening in central and Atlantic Arctic seas.
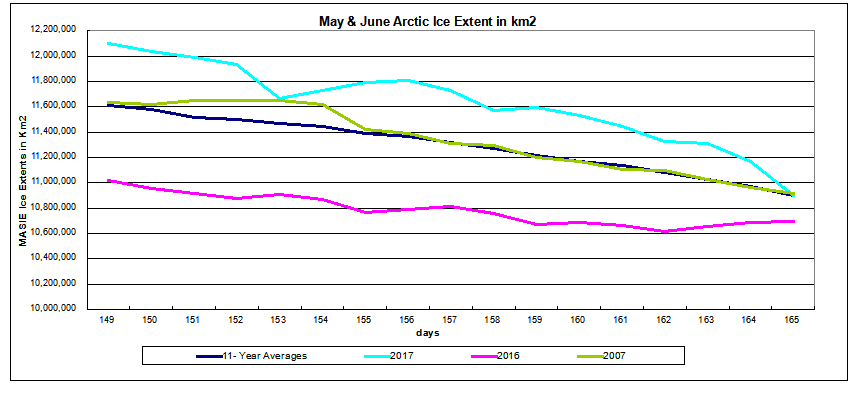
On this basis, 2017 is matching both average and 2007, and about 200k km2 more than 2016.
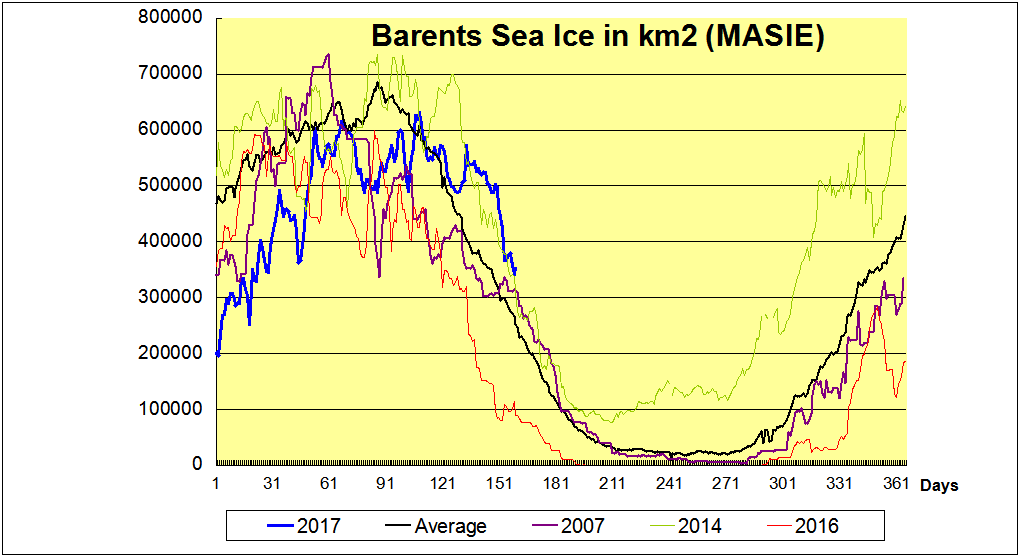
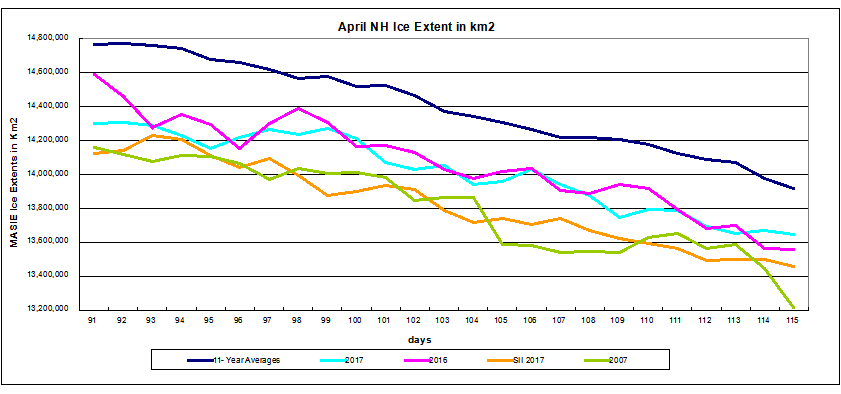
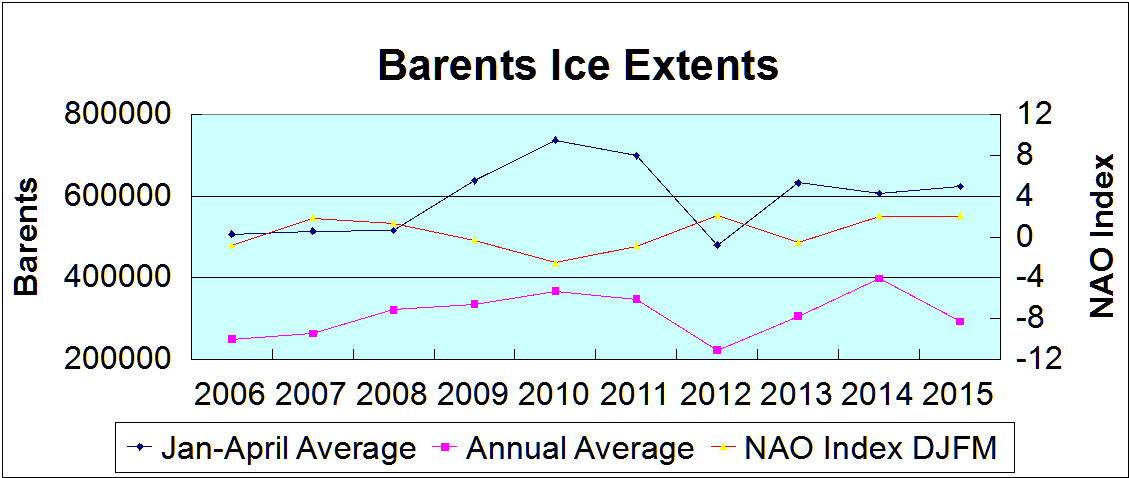
Barents Sea shows how unusual are 2017 sea ice extents inside the Arctic Circle. The graph below shows Barents this year compared to average and other years.
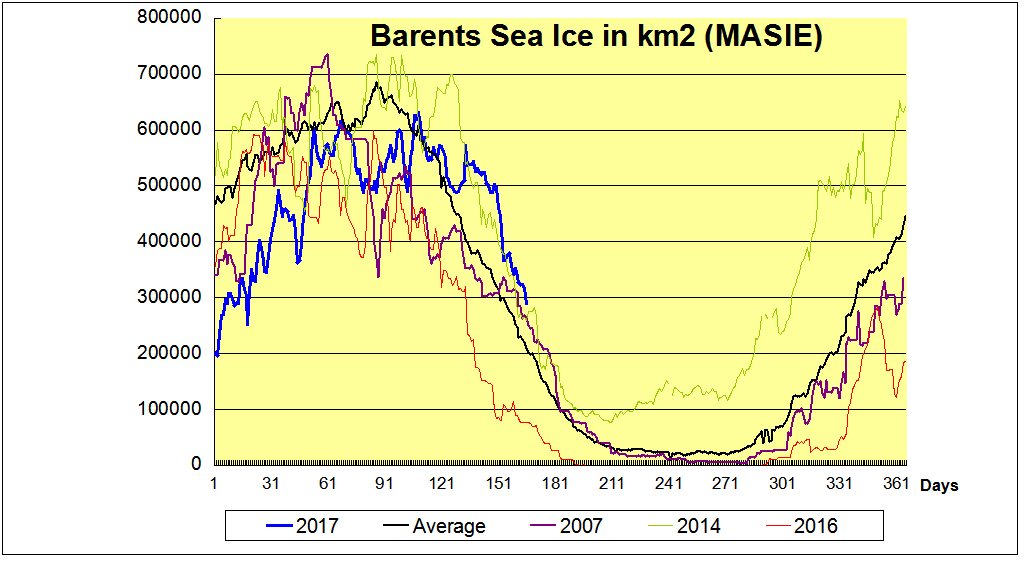
The black line is average for the last 11 years. 2007 in purple appears as an average year. 2014 had the highest annual extent in Barents Sea, due to higher and later maximums, holding onto ice during the summer, and recovering quickly. In contrast, 2016 was the lowest annual extent, melting out early and recovering later. 2017 in blue started out way behind, but grew rapidly to reach average, and is still persisting to exceed even 2014.
The table below shows extents on day 165 in the various Northern seas where ice is found.
| Region | 2017165 | Day 165 Average |
2017-Ave. | 2007165 | 2017-2007 |
| (0) Northern_Hemisphere | 10928458 | 11000746 | -72289 | 10959202 | -30745 |
| (1) Beaufort_Sea | 935191 | 975491 | -40301 | 952869 | -17678 |
| (2) Chukchi_Sea | 682164 | 821629 | -139465 | 770182 | -88018 |
| (3) East_Siberian_Sea | 999972 | 1058898 | -58926 | 1040890 | -40918 |
| (4) Laptev_Sea | 823309 | 788892 | 34417 | 755629 | 67680 |
| (5) Kara_Sea | 656401 | 731264 | -74864 | 770755 | -114355 |
| (6) Barents_Sea | 289358 | 208784 | 80574 | 264253 | 25105 |
| (7) Greenland_Sea | 586915 | 577208 | 9707 | 574726 | 12189 |
| (8) Baffin_Bay_Gulf_of_St._Lawrence | 826222 | 728139 | 98083 | 778469 | 47753 |
| (9) Canadian_Archipelago | 810834 | 796994 | 13841 | 781578 | 29256 |
| (10) Hudson_Bay | 1053785 | 995845 | 57940 | 997061 | 56724 |
| (11) Central_Arctic | 3232751 | 3219736 | 13015 | 3224700 | 8051 |
| (12) Bering_Sea | 13160 | 51203 | -38043 | 15285 | -2126 |
| (13) Baltic_Sea | 0 | 9 | -9 | 0 | 0 |
| (14) Sea_of_Okhotsk | 17207 | 45161 | -27955 | 31131 | -13924 |
The difference between 2017 and average is matched by the early losses in Bering and Okhotsk. Otherwise, there are some early meltings in BCE (Beaufort, Chukchi, East Siberian) and Kara, offset by surpluses everywhere else.
For more on why Barents Sea matters see Barents Icicles