Arctic Ice Song: Hey June, Don’t Let Me Down

The Iceberg Festival takes place every June on the Great Northern Peninsula, Newfoundland, now underway.

Weather Canada Iceberg Bulletin
Issued 11:00 AM EDT 2 June 2017

Special ice warning in effect.
Bergy water except 7 tenths of first-year ice including a trace of
old ice in the northern section. Unusual presence of sea ice.

Iceberg Count
More than 100 icebergs

East Coast Newfoundland Sea Ice 2016 and 2017.

Arctic ice had a remarkable May. The April NH ice extent in April was a 343k km2 deficit below the decadal average, and May ended with a monthly average surplus of 131k km2. The graph below shows in recent weeks how 2017 took a lead of ~300k km2 above average and is holding it entering June.

On June 1, this year’s ice extent is running 280k km2 above average, and a full 1M higher than 2016. Out of the last twelve years, only 2013 and 2014 had more ice on this day than 2017.

The graph below excludes the Pacific seas of Okhotsk and Barents, which are melting early (~150k km2 below average) and distort what is happening in central and Atlantic Arctic seas.

On this basis, 2017 is running 280k km2 higher than 2007, 430k km2 above average, and 910k km2 more than 2016.

Good news for the Iceberg Festival, for the Fishermen not so much.

Twillingate fishery stuck in ice, shrimp plant future uncertain
CBC June 1, 2017:  No boats coming and going through ice-filled harbour

Ice has started to break up near the wharf in Twillingate, but it could take another couple of weeks before boats could come and go freely. (Garrett Barry/CBC)

The town hasn’t seen ice last this long for decades, according to Gord Noseworthy, mayor and harbour master. It means many boats can’t get out of Twillingate, and those that do aren’t coming back to the wharf.


Arctic Springtime Postponed

May 27, 2017 Sea ice all the way to Labrador – Cape Norman Northern Peninsula Newfoundland h/t Newfoundsander

Too dangerous to go fishing due to ice, Coast Guard warns

Weather Canada Marine Forecast
East Coast – north of Cape St. Francis

Issued 10:00 AM EDT 28 May 2017
Today Tonight and Monday
Special ice warning in effect.
1 tenth of first-year ice including a trace of old ice except 9 tenths of first-year ice including a trace of old ice near parts of the mouth of Bonavista Bay and the mouth of Trinity Bay. Unusual presence of sea ice in the western section.
Iceberg Count
More than 100 icebergs.

The Atlantic ice extents show little retreat during May.  Newfoundland coast on the upper left is still locked in ice though less now than 10 days ago.  In Barents not much has changed.

The graph below shows May extent through yesterday, May 28.

For the first time the decadal average dropped below 12M km2.  2017 is 300k km2 above average, 400k km2 above 2007 and 1.1M km2 higher than 2016.  The graph below shows the Arctic ice extents, excluding the Pacific basins of Bering and Okhotsk.

Note how persistent is 2017 ice extent, currently 500k km2 above both 2007 and the decadal average, and 1M km2 above last year at this date.

The table below shows regional extents for 2017 compared to decadal average and to 2007 on day 148.

Region 2017148 Day 148
Average
2017-Ave. 2007148 2017-2007
 (0) Northern_Hemisphere 12294150 11990991 303159 11886249 407901
 (1) Beaufort_Sea 1009369 1008031 1338 1059461 -50092
 (2) Chukchi_Sea 818347 904706 -86359 905098 -86750
 (3) East_Siberian_Sea 1037744 1073527 -35783 1069198 -31454
 (4) Laptev_Sea 871872 847487 24384 774503 97369
 (5) Kara_Sea 901704 845784 55920 879973 21731
 (6) Barents_Sea 502369 328055 174314 307955 194414
 (7) Greenland_Sea 635773 574248 61526 559480 76293
 (8) Baffin_Bay_Gulf_of_St._Lawrence 1122564 928837 193727 960512 162052
 (9) Canadian_Archipelago 820170 818658 1511 819338 831
 (10) Hudson_Bay 1184050 1102567 81483 1093176 90874
 (11) Central_Arctic 3247685 3221113 26572 3228660 19025
 (12) Bering_Sea 34151 212595 -178444 137425 -103274
 (13) Baltic_Sea 4542 319 4223 0 4542
 (14) Sea_of_Okhotsk 101998 123254 -21255 89730 12269

Note the strong surpluses of ice in Kara, Barents, Greenland Sea and Baffin Bay.  Note also that Bering is nearly ice free, and is having some influence on nearby Chukchi.  The two Pacific basins of Bering and Okhotsk now have 136k km2 combined at day 148, which matches where the decadal average will be in 13 days on day 161.

Finally, the image below shows Svalbard comparing 2017 with last year on day 148.

AER provides some insight into these developments along with a forecast in the May 22 posting.

Dr. Judah Cohen:
As I discussed in my previous blog, one constant over the past decade has been the collapse of NH snow cover extent in spring, especially late spring. The rapid disappearance of snow cover across northern Eurasia and northern North America contributes to drying of the soil and warmer temperatures. The resultant warmer temperatures also likely contribute to Arctic sea ice loss.

Snow cover this spring has been more resilient to melt than in previous recent springs. More snow cover results in moister soils. Moister soils result in cooler temperatures. Snow cover and snow mass continue to be relatively high across the NH helped by in part by below normal temperatures in key regions. However the snow cover has been more resilient in Eurasia relative to North America and snow cover across North America experienced a rapid decline over the past week. And with more warm temperatures predicted across Northern Canada, the rapid decline in snow cover will likely continue.

The AO is currently neutral (Figure 1), reflective of mixed geopotential height anomalies across the Arctic and mixed geopotential height anomalies across the mid-latitudes of the NH (Figure 2). Geopotential height anomalies are positive near Greenland and Iceland (Figure 2), and therefore the NAO is negative.

The AO is predicted to remain neutral to positive next week as neutral to negative geopotential height anomalies dominate much of the Arctic (Figure 5a). And with neutral to negative geopotential height anomalies stretching from Greenland to Iceland, the NAO will likely trend positive back into positive territory as well.

Extra Icy Arctic in May

Image from earth:nullschool showing arctic wind patterns. This is the link to the animated display:
https://earth.nullschool.net/#current/wind/surface/level/orthographic=-17.87,70.69,1132/loc=3.799,67.645

In May Arctic ice continues to be more extensive than recently.  As previously reported, central and Atlantic sea ice is above decadal averages.  The image below shows surprising growth since day 120 (April 30), with a pause the last few days.

Things are different on the Pacific side where Bering in particular has melted ahead of schedule, and now extending in Chukchi sea, inside the actual Arctic basin.

The graph below shows how in recent days 2017 NH ice extents have grown above average, even including the exceptionally low amounts of ice in the Pacific, Bering in particular.

Note that as of day 138, yesterday, 2017 NH ice was 150k km2 above average, 300k above SII estimates, 550k above 2007 and nearly 800k km2 more than last year.

The graph below shows Arctic ice excluding the Pacific seas of Bering and Okhotsk.  This provides an even more dramatic view of this years ice extents.  Mid April Arctic ice was average, and look what has happened since May began on day 121.  There was a drop and a rise, with a current surplus of 450k km2.

The table for day 138 shows the regional extents for 2017 compared to averages and 2007.

Region 2017138 Day 138
Average
2017-Ave. 2007138 2017-2007
 (0) Northern_Hemisphere 12765934 12609649 156285 12228251 537683
 (1) Beaufort_Sea 1037364 1035052 2313 1063324 -25960
 (2) Chukchi_Sea 855121 935117 -79997 940430 -85309
 (3) East_Siberian_Sea 1068289 1082898 -14609 1069398 -1109
 (4) Laptev_Sea 897845 871037 26807 789644 108201
 (5) Kara_Sea 931636 883725 47911 892687 38949
 (6) Barents_Sea 526079 378812 147267 335179 190899
 (7) Greenland_Sea 629810 612779 17031 578928 50883
 (8) Baffin_Bay_Gulf_of_St._Lawrence 1286982 1059735 227247 1002295 284687
 (9) Canadian_Archipelago 851190 834484 16706 840548 10642
 (10) Hudson_Bay 1203259 1157573 45687 1132632 70627
 (11) Central_Arctic 3247685 3225767 21917 3231808 15877
 (12) Bering_Sea 86844 339072 -252228 227132 -140288
 (13) Baltic_Sea 7716 4442 3274 4398 3318
 (14) Sea_of_Okhotsk 134303 186523 -52219 117127 17177

The 300k km2 deficit in Bering and Okhotsk is evident.  Also Chukchi is starting to show the effects from early Bering melting.  Other seas are above average, with large surpluses in Baffin and Barents sea.

Some insight into the unusual Arctic ice growth comes from AER Arctic Report and Forecast May 8, 2017

Currently positive pressure/geopotential height anomalies are mostly focused on the North Atlantic side of the Arctic with mostly negative pressure/geopotential height anomalies across the mid-latitudes of the Northern Hemisphere (NH). This is resulting in a near record low Arctic Oscillation (AO) and North Atlantic Oscillation (NAO) for May.

It might be the second week of May but an unusually strong block/high pressure exists in the northern North Atlantic including Iceland and Greenland and is more commonly associated with winter. The unusually strong block is contributing to not only below normal temperatures to both sides of the North Atlantic, including Europe and the Eastern US but late season snowfall to Southeastern Canada, the Northeastern US and Russia. The negative geopotential height anomalies that have developed both downstream across western Eurasia including Europe and upstream across the Eastern US are predicted to persist for much of the month of May helping to ensure a relatively cool month of May for both Europe and the Eastern US.

Summary

Do not be mislead by reports of declining sea ice in the Arctic; it is a distraction based on early melting in the Pacific, especially Bering sea.

Meanwhile, on the Atlantic side of the Arctic, we have sightings and reports of ice surges along the coast of Newfoundland, such amounts not seen since the 1980s. Below is a NASA satellite photo of Newfoundland Sea Ice, May 5, 2017 Source: Newsfoundsander


Barents Sea Grows Ice in May


Something surprising is happening with Arctic ice.  It is May and ice should be melting, but instead it is growing and in the unlikely place of Barents Sea.  The images above show the ice positions since April, and you can see on the left how ice refused to leave Newfoundland, and on the right how Barents is not backing down but increasing.

The graph below shows how in recent days 2017 NH ice extents have grown way above average, even including the exceptionally low amounts of ice in the Pacific, Bering in particular.

Much of the growth is due to Barents adding 85k m2 in the last 5 days to reach 572k km2, an extent last seen two weeks ago.

The graph below shows Arctic ice excluding the Pacific seas of Bering and Okhotsk.  This provides an even more dramatic view of this years ice extents.  Mid April Arctic ice was average, and look what has happened since May began on day 121.


Some insight into the unusual Arctic ice growth comes from AER Arctic Report and Forecast May 8, 2017

Currently positive pressure/geopotential height anomalies are mostly focused on the North Atlantic side of the Arctic with mostly negative pressure/geopotential height anomalies across the mid-latitudes of the Northern Hemisphere (NH). This is resulting in a near record low Arctic Oscillation (AO) and North Atlantic Oscillation (NAO) for May.

It might be the second week of May but an unusually strong block/high pressure exists in the northern North Atlantic including Iceland and Greenland and is more commonly associated with winter. The unusually strong block is contributing to not only below normal temperatures to both sides of the North Atlantic, including Europe and the Eastern US but late season snowfall to Southeastern Canada, the Northeastern US and Russia. The negative geopotential height anomalies that have developed both downstream across western Eurasia including Europe and upstream across the Eastern US are predicted to persist for much of the month of May helping to ensure a relatively cool month of May for both Europe and the Eastern US.

Summary

Do not be mislead by reports of declining sea ice in the Arctic; it is a distraction based on early melting in the Pacific, especially Bering sea.

Meanwhile, on the Atlantic side of the Arctic, we have sightings and reports of ice surges along the coast of Newfoundland, such amounts not seen since the 1980s. Below is a NASA satellite photo of Newfoundland Sea Ice, May 5, 2017 Source: Newsfoundsander


Resilient Arctic Ice in May

The MASIE image shows Arctic Ocean ice is resilient and the numbers below will show how well 2017 compares to the decadal average. The only place where ice is below normal is outside the Arctic Ocean, namely Bering and Okhotsk Seas in the Pacific. Claims of disappearing ice pertain not to the Arctic itself, but to marginal Pacific seas that will melt out anyway by September.

I noticed the pattern this April when it became obvious that including Bering and Okhotsk in the Arctic totals gives a misleading picture. For sure they are part of Northern Hemisphere (NH) total sea ice, but currently the Pacific is going its own way, not indicative of the sea ice in the Central and Atlantic Arctic.

The graph below shows ice extents in the Arctic seas, excluding Bering and Okhotsk in the Pacific. Over the last 25 days 2017 Arctic ice has gone from average to a surplus of 400k km2 and is maintaining that advantage in May.  As of May 8, ice in 2007 was 600k km2 behind and 2016 was lower by 700k km2.

While the Arctic ocean ice is persisting, Bering and Okhotsk extents have retreated ahead of schedule, as the graph below shows.  The gap has persisted at 50% of decadal average over the last 3 weeks, going from 600k km2 on day 109 to 500k km2 on day 120, and presently Bering and Okhotsk combined are down by 400k km2.  Of course, eventually both seas will be ice free by September.

“Freedom’s just another word for nothing left to lose.”
Kris Kristofferson song (Me and Bobby McGee)

The distinctive Pacific pattern is evident in the images of changing ice extents.  First, see how ice in Bering and Okhotsk seas has retreated the last 3 weeks..

Meanwhile, on the Atlantic side ice has grown steadily.  Note Newfoundland on the upper left has been blocked by ice only now retreating, while Svalbard on the middle right.continues to be encased.

The Chart below shows the traditional view of NH ice extents, which includes the Pacific seas together with the Arctic seas.  2017 started this period 400k km2 below average, then caught up and is now tracking slightly above the decadal average.This is despite a deficit of 400k km2 in Bering and Okhotsk, which obscures the ice surpluses elsewhere.  By comparison 2007 and 2016 are lagging behind by 400k km2..

The table below provides a more detailed description of NH ice by showing extents measured in the various seas on May 8, day 128 of the year.

Region 2017128 Day 128
Average
2017-Ave. 2007128 2017-2007
 (0) Northern_Hemisphere 13171174 13149118 22056 12792742 378432
 (1) Beaufort_Sea 1061622 1056204 5418 1042771 18852
 (2) Chukchi_Sea 957567 957220 348 939928 17640
 (3) East_Siberian_Sea 1087137 1085117 2020 1081533 5605
 (4) Laptev_Sea 897845 890721 7124 874837 23008
 (5) Kara_Sea 920985 902466 18519 880185 40800
 (6) Barents_Sea 487526 449413 38113 418974 68552
 (7) Greenland_Sea 705745 613061 92684 605824 99921
 (8) Baffin_Bay_Gulf_of_St._Lawrence 1340708 1139240 201467 1035447 305260
 (9) Canadian_Archipelago 850635 842522 8113 834959 15676
 (10) Hudson_Bay 1248694 1205894 42800 1199786 48908
 (11) Central_Arctic 3247448 3220316 27132 3238105 9344
 (12) Bering_Sea 191284 484937 -293653 392119 -200836
 (13) Baltic_Sea 11485 13590 -2105 10416 1070
 (14) Sea_of_Okhotsk 160681 285356 -124675 233588 -72907

Clearly 2017 is above average everywhere, including Barents and Kara seas, with quite large surpluses in Greenland Sea and Baffin Bay.  The deficits in the Pacific are also obvious, with Bering sea down the most.

Summary

The details are important to form a proper perception of any natural process, including dynamics of sea ice waxing and waning. On closer inspection, the appearance of declining Arctic sea ice is actually another after effect of the recent El Nino and Blob phenomena, and quite restricted to the Pacific marginal seas.

Meanwhile, on the Atlantic side of the Arctic, we have sightings and reports of ice surges along the coast of Newfoundland, such amounts not seen since the 1980s. Below is a NASA satellite photo of Newfoundland Sea Ice, May 5, 2017 Source: Newsfoundsander


April Arctic Ice Beats Expectations

Residents view the first iceberg of the season as it passes the South Shore, also known as “Iceberg Alley,” near Ferryland, Newfoundland, Canada, April 16, 2017. REUTERS/Jody Martin

The title of this post sounds contradictory to most of what the media is saying about Arctic ice being in a tailspin, setting records for low extents, etc. And reports of ice blocking Newfoundland also fly in the face of media claims.

I will let you in on a secret: Arctic Ocean ice is doing fine and well above the decadal average. The only place where ice is below normal is outside the Arctic Ocean, namely Bering and Okhotsk Seas in the Pacific. Claims of disappearing ice pertain not to the Arctic itself, but to marginal Pacific seas that will melt out anyway by September.

I noticed the pattern this April when it became obvious that including Bering and Okhotsk in the Arctic totals gives a misleading picture. For sure they are part of Northern Hemisphere (NH) total sea ice, but currently the Pacific is going its own way, not indicative of the sea ice in the Central and Atlantic Arctic.

April 2017 is now complete. Focusing on the Arctic apart from Pacific marginal seas, remarkably the month ends with the same extent as it began at 13M km2. The graph below shows an early fluctuation down, followed by later gains and a gentle descent. May begins with the Arctic seas showing a surplus of ~400k km2 above average.

While the Arctic ocean ice is persisting, Bering and Okhotsk extents have retreated ahead of schedule, as the graph below shows.  Presently Bering and Okhotsk combined are 50% of decadal average, down by 500k km2.

The distinctive Pacific pattern is evident in the images of changing ice extents this April.  First, see how ice in Bering and Okhotsk seas has retreated steadily this month.


Meanwhile, on the Atlantic side ice has grown steadily.  Note the persistent ice blocking Newfoundland on the bottom right, and encasing Svalbard on the upper left.


The Chart below shows the traditional view of NH ice extents, which includes the Pacific seas together with the Arctic seas.  2017 is only slightly lower than average on this basis, despite a deficit of 500k km2 in Bering and Okhotsk, which obscures the ice surpluses elsewhere.  Comparisons with Sea Ice Index (SII) and 2007 are also shown.

Summary

The details are important to form a proper perception of any natural process, including dynamics of sea ice waxing and waning. On closer inspection, the appearance of declining Arctic sea ice is actually another after effect of the recent El Nino and Blob phenomena, and quite restricted to the Pacific marginal seas.

Meanwhile, on the Atlantic side of the Arctic, we have sightings and reports of ice surges along the coast of Newfoundland, such amounts not seen since the 1980s. Below an image of St. John’s harbour with tons of ice, provided by Ryan Simms.


And from Twillingate: “Basically it’s just an ocean of ice ahead of us.’ – Derrick Bath, Polar Venture

Derrick Bath’s Polar Venture has spent hours trying to make it through the ice near Twillingate. (Submitted by Danny Bath)

Arctic Ice Goes Above Average

Heavy ice is making it impossible for fishermen from the Twillingate area to get to their crab fishing grounds. It may not open up until mid-May. (Twitter/@jeddore1972) Source: CBC

The title of this post sounds contradictory to most of what the media is saying about Arctic ice being in a tailspin, setting records for low extents, etc. And reports of ice blocking Newfoundland also fly in the face of media claims.

I will let you in on a secret: Arctic Ocean ice is doing fine and well above the decadal average. The only place where ice is below normal is outside the Arctic Ocean, namely Bering and Okhotsk Seas in the Pacific. Claims of disappearing ice pertain not to the Arctic itself, but to marginal Pacific seas that will melt out anyway in September.

I noticed the pattern this April when it became obvious that including Bering and Okhotsk in the Arctic totals gives a misleading picture. For sure they are part of Northern Hemisphere (NH) total sea ice, but currently the Pacific is going its own way, not indicative of the sea ice in the Central and Atlantic Arctic.

Graphically, MASIE shows that, excluding Bering and Okhotsk, 2017 Arctic Ocean sea ice is well above the 11 year average. Note that 2017 Arctic ice started April 100k km2 below average, and has now opened up a lead of ~300k km2 above average.


The second graph shows clearly how this year Bering and Okhotsk are abnormally low, and diverging further from average. At this point, Bering and Okhotsk combined are down to half of the decadal average.


The distinctive Pacific pattern is evident in the images of changing ice extents this April.  First, see how ice in Bering and Okhotsk seas has retreated steadily this month.

Meanwhile, on the Atlantic side ice has grown steadily.

The Chart below shows the traditional view of NH ice extents, which includes the Pacific seas together with the Arctic seas.  2017 is lower than average on this basis, though the difference is entirely due to Bering and Okhotsk, and obscures the ice surpluses elsewhere.  Comparisons with Sea Ice Index (SII) and 2007 are also shown.


The table for April 25, day 115 compares 2017 with the average (2006 to 2016), and with 2007 as the lowest year of the decade.

Region 2017115 Day 115
Average
2017-Ave. 2007115 2017-2007
 (0) Northern_Hemisphere 13643262 13917128 -273866 13213059 430203
 (1) Beaufort_Sea 1070445 1066352 4093 1043881 26564
 (2) Chukchi_Sea 957018 965138 -8121 959562 -2544
 (3) East_Siberian_Sea 1087137 1086188 949 1081682 5456
 (4) Laptev_Sea 896694 893869 2825 881893 14801
 (5) Kara_Sea 931199 916361 14838 841716 89483
 (6) Barents_Sea 546729 560682 -13953 362007 184722
 (7) Greenland_Sea 692413 640185 52228 648670 43743
 (8) Baffin_Bay_Gulf_of_St._Lawrence 1481910 1274382 207528 1155621 326289
 (9) Canadian_Archipelago 853214 848182 5032 835797 17417
 (10) Hudson_Bay 1260903 1240376 20527 1192783 68120
 (11) Central_Arctic 3248013 3233561 14452 3232010 16003
 (12) Bering_Sea 305065 671415 -366349 539149 -234083
 (13) Baltic_Sea 23034 32044 -9010 18182 4852
 (14) Sea_of_Okhotsk 286734 484320 -197586 411649 -124915

Note that all the central arctic seas are solid.  Barents is nearly average and much higher than 2007.  Baffin Bay-St.Lawrence is much above average and 2007, as shown by the Newfoundland ice that is part of the region.  The Bering and Okhotsk deficits are also obvious.

Summary

The details are important to form a proper perception of any natural process, including dynamics of sea ice waxing and waning. On closer inspection, the appearance of declining Arctic sea ice is actually another after effect of the recent El Nino and Blob phenomena, and quite restricted to the Pacific marginal seas.

Meanwhile, on the Atlantic side of the Arctic, we have sightings and reports of ice surges along the coast of Newfoundland, such amounts not seen since the 1980s. Below an image of St. John’s harbour with tons of ice, provided by Ryan Simms.


And from Twillingate: “Basically it’s just an ocean of ice ahead of us.’ – Derrick Bath, Polar Venture

Derrick Bath’s Polar Venture has spent hours trying to make it through the ice near Twillingate. (Submitted by Danny Bath)

Barents Icicles 2017

A chart of Barents Ice Cycles looks a lot like the icicles above, except upside down since Barents Sea is usually all water by September. Notice the black lines in the graph below hitting bottom near zero.

Note also the anomalies in red are flat until 1998, then decline to 2007 and then flat again.

Why Barents Sea Ice Matters

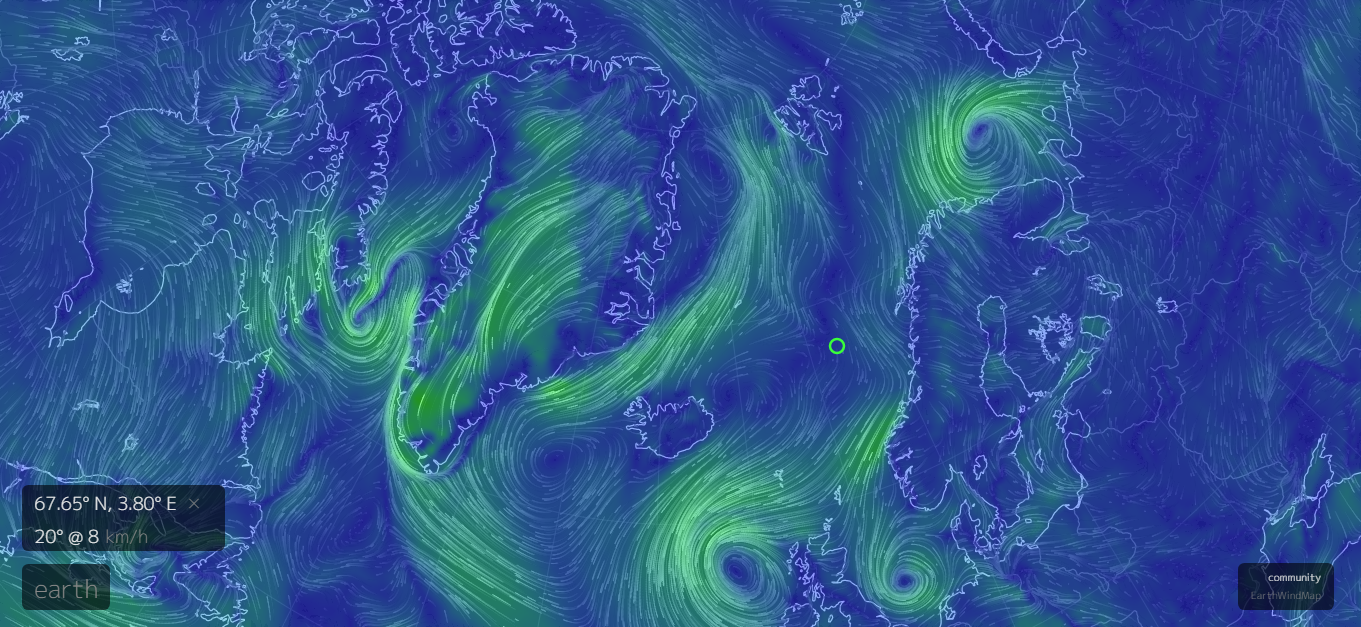
Barents Sea is located at the gateway between the Arctic and North Atlantic. Previous posts (here and here) have discussed research suggesting that changes in Barents Sea Ice may signal changes in Arctic Sea Ice a few years later. As well, the studies point to changes in heat transport from the North Atlantic driving the Barents Sea Ice, along with changes in salinity of the upper layer. And, as suggested by Zakharov (here), there are associated changes in atmospheric circulations, such as the NAO (North Atlantic Oscillation).

Here we look at MASIE over the last decade and other datasets over longer terms in search for such patterns.

Observed Barents Sea Ice

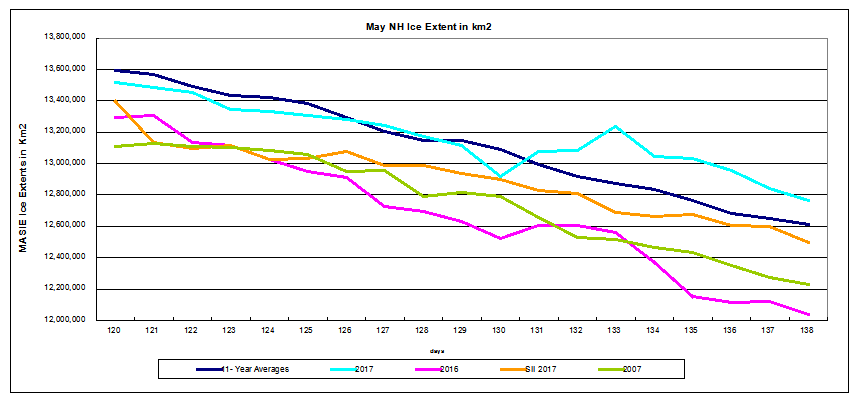
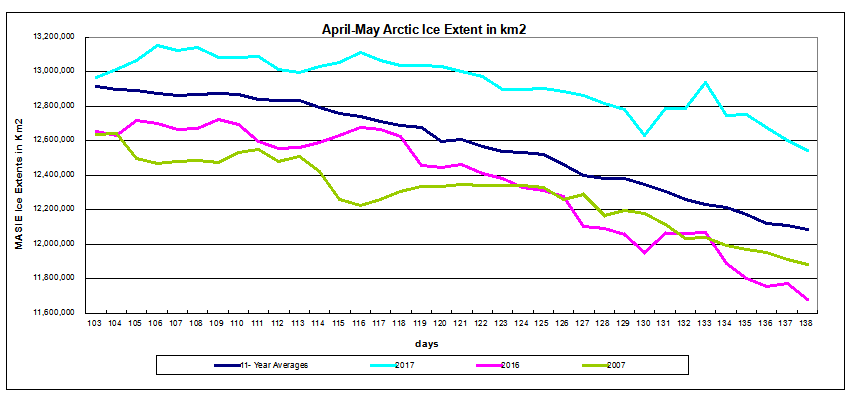
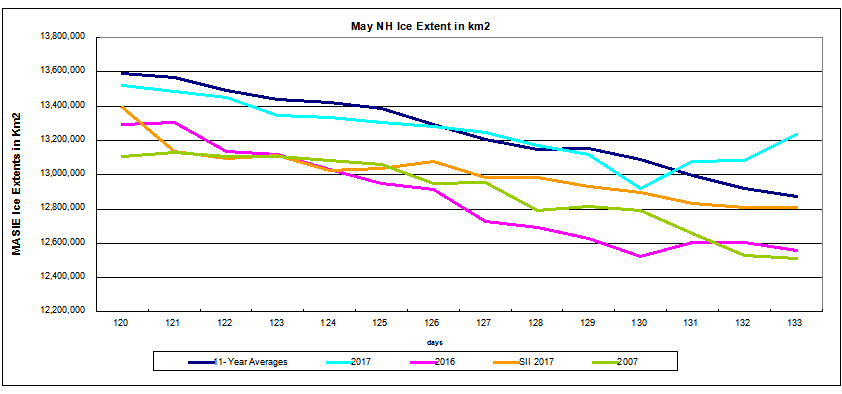
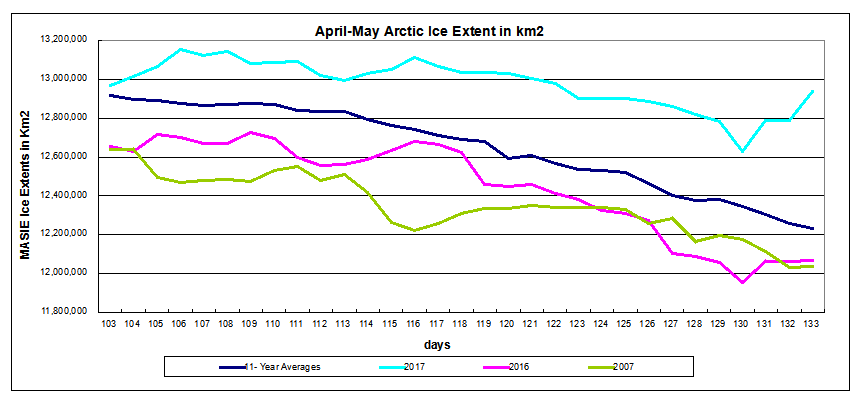
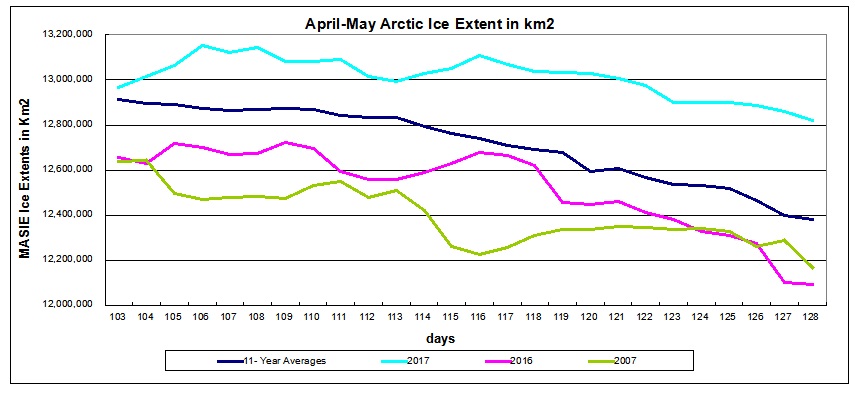
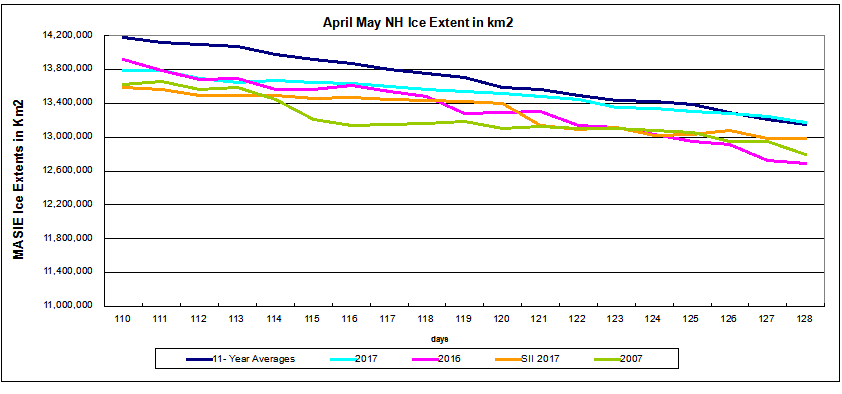
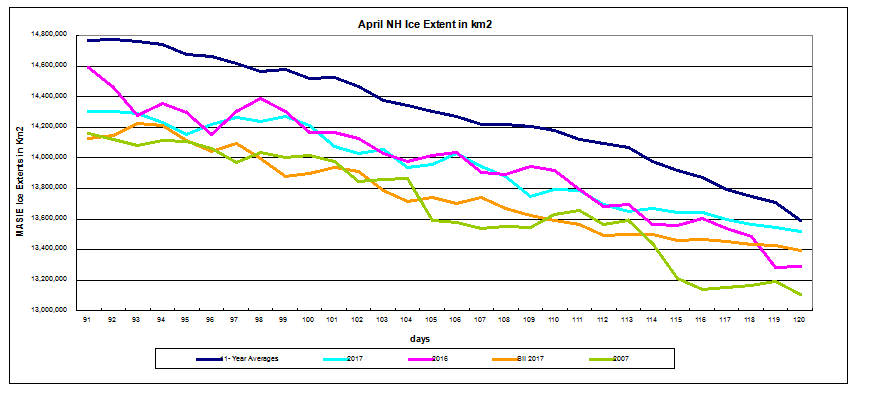
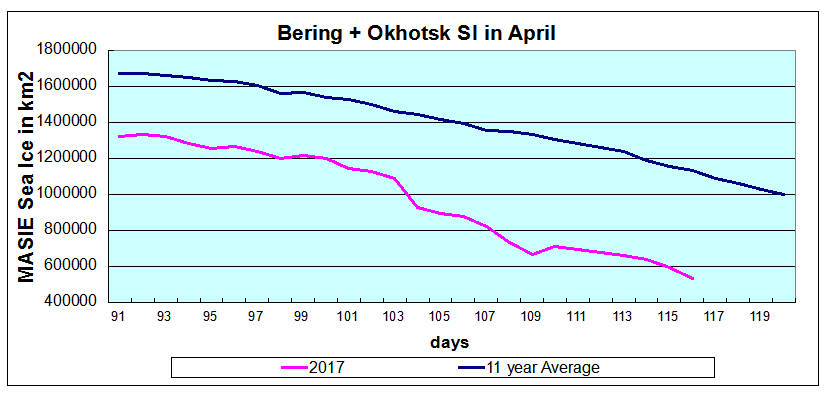
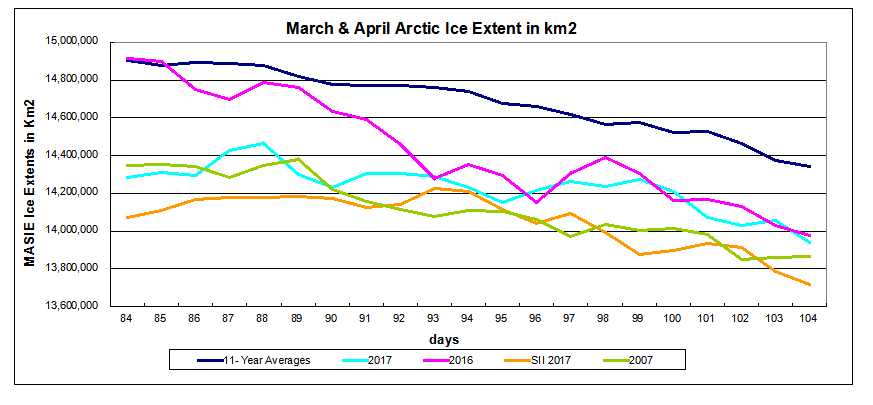
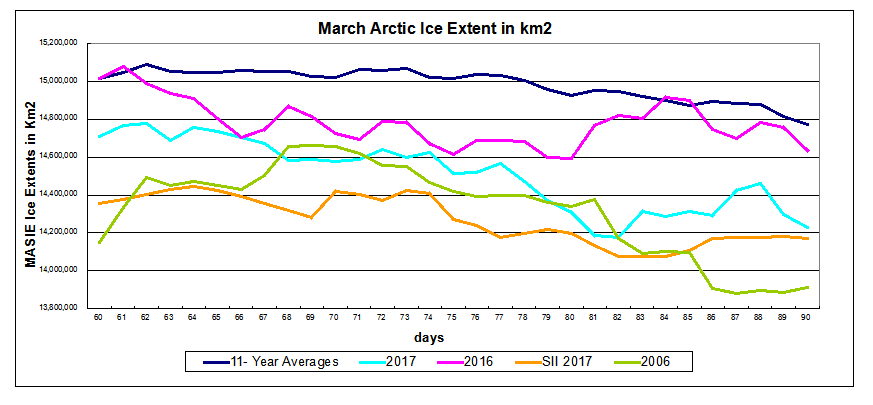
Below is a more detailed look at 2017 compared with recent years.

This graph shows over the last 11 years, on average Barents sea ice starts declining beginning with April and melts out almost completely in September before recovering.  Some years, like 2014, the decline started much later and stopped with 100k km2 of ice persisting, resulting in the highest annual extent in the last decade.   Last year, 2016, was the opposite anomaly with much less ice than average all year.  2007 had the least Arctic ice overall in the last decade and was close to average in Barents during the summer months.

Note how exceptional is 2017 Barents ice extent.  It began extremely low in January and grew sharply to reach average by February, then dipped in March before rising strongly again in April.  It remains to be seen how much ice will grow, how late and how much will melt this year.


North Atlantic Meteorology in 2017

From AER comes more evidence of cooling in the North Atlantic and favorable conditions for ice formation there.

Dr. Judah Cohen provides his latest Arctic Oscillation and Polar Vortex Analysis and Forecast
on April 21, 2017.

  • Currently pressure/geopotential height anomalies are mostly positive on the North Pacific side of the Arctic but mostly negative across the North Atlantic side of the Arctic with mostly negative pressure/geopotential height anomalies across the mid-latitude ocean basins. This is resulting in a negative Arctic Oscillation (AO) but a positive North Atlantic Oscillation (NAO).
  • Despite the positive NAO, temperatures are below normal across western Eurasia including much of Europe as a strong block/high pressure has developed in the eastern North Atlantic with a cold, northerly flow downstream of the block across Europe.
  • The blocking high in the eastern North Atlantic is predicted to drift northward contributing to a negative bias to the AO and eventually the NAO over the next two weeks. Therefore, the pattern of cool temperatures across western Eurasia including Europe looks to continue into the foreseeable future.

Background on Barents from the Previous Post

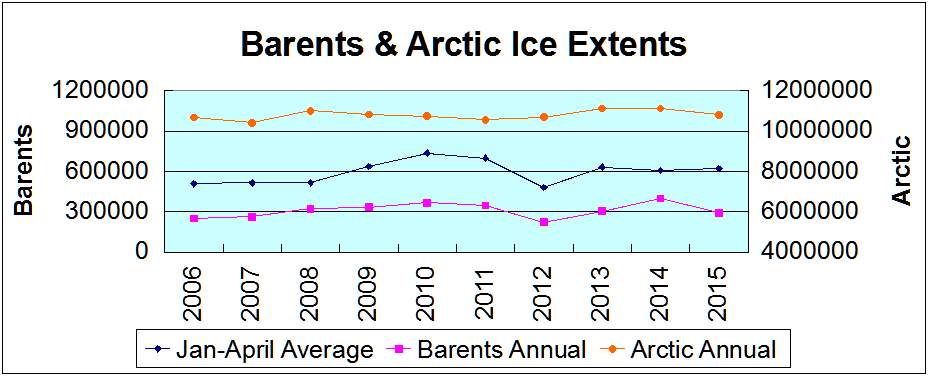
Annual average BSIE (Barents Sea Ice Extent) is 315k km2, varying between 250k and 400k over the last ten years. The volatility is impressive, considering the daily Maximums and Minimums in the record. Average Max is 781k, ranging from 608k to 936k. Max occurs on day 77 (average) with a range from day 36 to 103. Average Min is 11k on day 244, ranging from 0k to 77k, and from days 210 to 278.

In fact, over this decade, there are not many average years. Five times BSIE melted to zero, two were about average, and 3 years much higher: 2006-7 were 2 and 3 times average, and 2014 was 7 times higher at 77k.

As for Maxes, only 1 year matched the 781k average. Four low years peaked at about 740k (2006,07,08 and 14), and the lowest year at 608k (2012). The four higher years start with the highest one, 936k in 2010, and include 2011, 13, and 15.

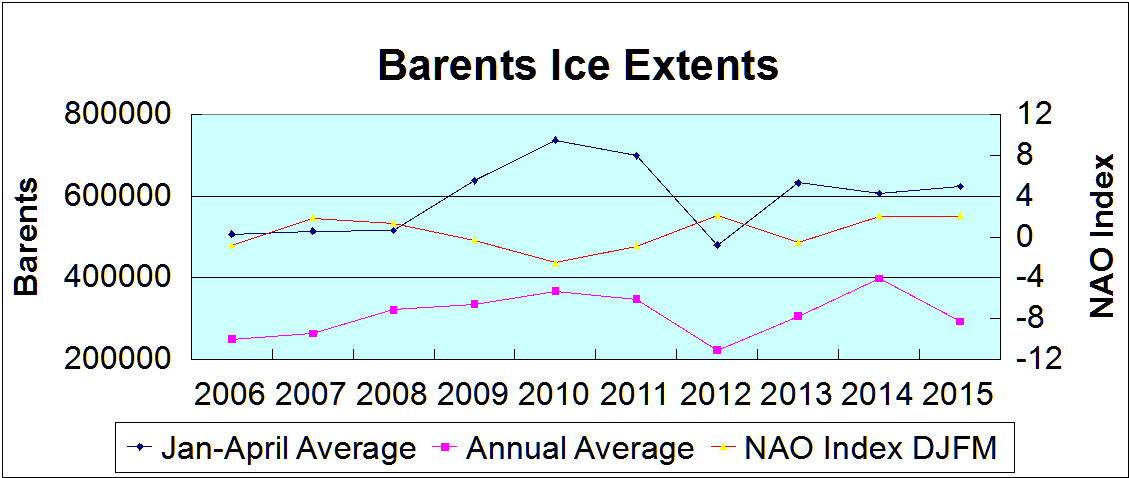
Comparing Barents Ice and NAO
Barents Masierev

This graph confirms that Barents winter extents (JFMA) correlate strongly (0.73) with annual Barents extents. And there is a slightly less strong inverse correlation with NAO index (-0.64). That means winter NAO in its negative phase is associated with larger ice extents, and vice-versa.

Comparing Barents Ice and Arctic Annual

Barents and Arctic

Arctic Annual extents correlate with Barents Annuals at a moderately strong 0.46, but have only weaker associations with winter NAO or Barents winter averages. It appears that 2012 and 2015 interrupted a pattern of slowly rising extents.

NAO and Arctic Ice Longer Term

Fortunately there are sources providing an history of Arctic ice longer term and overlapping with the satellite era. For example:

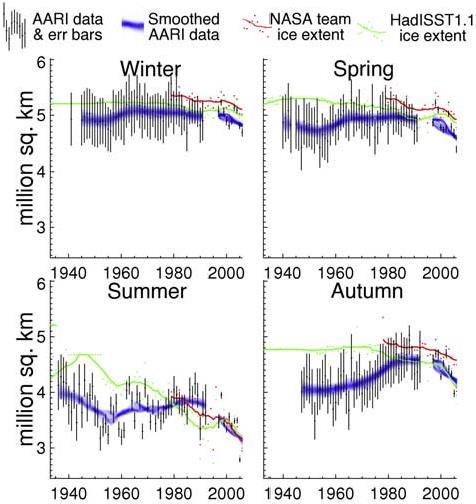
Observed sea ice extent in the Russian Arctic, 1933–2006 Andrew R. Mahoney et al (2008)
http://seaice.alaska.edu/gi/publications/mahoney/Mahoney_2008_JGR_20thC_RSI.pdf

Russian Arctic Sea Ice to 2006

Mahoney et al say this about Arctic Ice oscillations:

We can therefore broadly divide the ice chart record into three periods. Period A, extending from the beginning of the record until the mid-1950s, was a period of declining summer sea ice extent over the whole Russian Arctic, though not consistently in every individual sea. . . Period B extended from the mid-1950s to the mid- 1980s and was a period of generally increasing or stable summer sea ice extent. For the Russian Arctic as a whole, this constituted a partial recovery of the sea ice lost during period A, though this is not the case in all seas. . . Period C began in the mid-1980s and continued to the end of the record (2006). It is characterized by a decrease in total and MY sea ice extent in all seas and seasons.

Comparing Arctic Ice with winter NAO index

The standardized seasonal mean NAO index during cold season (blue line) is constructed by averaging the monthly NAO index for January, February and March for each year. The black line denotes the standardized five-year running mean of the index. Both curves are standardized using 1950-2000 base period statistics.

The graph shows roughly a 60 year cycle, with a negative phase 1950-1980 and positive 1980 to 2010. As described above, Arctic ice extent grew up to 1979, the year satellite ice sensing started, and declined until 2007. The surprising NAO uptick recently coincides with the anomalous 2012 and 2015 meltings.

As of January 2016 NAO went negative for the first time in months.  There appears to be some technical difficulties with more recent readings.

Summary

If the Barents ice cycle repeats itself over the next decades, we should expect Arctic ice extents to grow as part of a natural oscillation. The NAO atmospheric circulation pattern is part of an ocean-ice-atmosphere system which is driven primarily by winter changes in the North Atlantic upper water layer.

Self-Oscillating Sea Ice System

Self-Oscillating Sea Ice System  See here.


Easter Ice Hunt

As the photo shows, back in February 2017 you didn’t have to go looking for ice, it came after you. A convoy including icebreakers was trapped by ice in Chukchi, reported in Siberian Times and posted here as Arctic Ice Takes Revenge.

Now we are two weeks into April and about a month into the Arctic melt season. The hunt is on to see how ice extent reacts to the sun, warmer water and weather.

Firstly the graph shows that both this year and last have dipped below 14M km2, 400k km2 below average but still ahead of 2007. Day 104 refers to April 14.

As noted before, the heart of the Arctic is still frozen solid, with changes in extent occurring mainly in the marginal seas that usually melt out by September. Comparing the last two weeks in the Atlantic side, we can see almost no change overall, with an unexpected small increase in Barents Sea.

On the Pacific side is where the deficit to average appears in the melting of both Bering and Okhotsk Seas.

The table compares 2017 regional extents to average and to 2007.

Region 2017104 Day 104
Average
2017-Ave. 2007104 2017-2007
 (0) Northern_Hemisphere 13938957 14340901 -401944 13862996 75960
 (1) Beaufort_Sea 1068514 1068895 -382 1058157 10357
 (2) Chukchi_Sea 966006 964512 1494 960944 5062
 (3) East_Siberian_Sea 1085191 1085618 -427 1074001 11189
 (4) Laptev_Sea 892613 894687 -2073 866524 26090
 (5) Kara_Sea 928904 922891 6012 912398 16505
 (6) Barents_Sea 551153 603811 -52658 521344 29808
 (7) Greenland_Sea 698685 655565 43120 691751 6934
 (8) Baffin_Bay_Gulf_of_St._Lawrence 1436054 1316043 120010 1222152 213902
 (9) Canadian_Archipelago 853214 852229 985 846282 6933
 (10) Hudson_Bay 1257536 1243402 14135 1212987 44549
 (11) Central_Arctic 3246909 3232793 14116 3245148 1761
 (12) Bering_Sea 507510 794989 -287480 645687 -138177
 (13) Baltic_Sea 25977 50160 -24183 20075 5902
 (14) Sea_of_Okhotsk 417538 648579 -231042 576913 -159375

Clearly, Barents is down slightly to average but more than offset by surpluses in Baffin and Greenland. The 2017 differences from average and from 2007 arise from Bering and Okhotsk in the Pacific.

Summary

Despite what you may hear from alarmist sources, there is plenty of Arctic Ice if you know where to look for it.

Arctic Ice Marches On

MASIE ice extents reported March 8 through 31, 2017.

This time of year the heart of the Arctic is frozen solid, and the only changes occur in the marginal seas.  Above shows the Atlantic basins, especially Kara, Barents, Greenland Sea and Baffin Bay.  All of them seesawed during the month, with some fall off at the end, especially noticeable in Gulf of St. Lawrence (counted with Baffin Bay).

Meanwhile on the Pacific side, Bering fluctuated, while Okhotsk lost extent steadily toward month end.

Context

The monthly ice extent average for March provides indication of any year’s annual maximum, prior to melting down to the September annual minimum. Sometimes a lower March extent yields a lower September extent, but not always: 2012 had both the highest maximum and lowest minimum in the last 11 years. That was the year of the Great Arctic Cyclone, and an outlier in the record.

Looking at the 11-year averages in the MASIE data set, the pattern in round numbers is:
Maximum: 15.0 M km2
Minimum: 4.8 M km2
Loss: 10.2 M km2
Loss: 68.0 % of maximum

So about 2/3 of the maximum extent is lost, varying from 66 to 70%. Obviously, all the factors affecting ice extents are in play: (Water, Wind and Weather) with the September outcome uncertain, but likely to be in the range observed.

March 2017 in Comparison

As has been reported, ice formation this year has been sluggish compared to other years. The graph below shows March 2017 compared with the 11 year average, and with 2006 and 2016, as well as SII (Sea Ice Index).

This March started below average, lost sllghtly until the third week, then recovered some before dropping off at the end. 2006 dropped off more rapidly than 2017, while 2016 ended near average. SII showed lower extents all month but drew close at the end.

The Table below shows Day 90 extents across the Arctic Seas compared to averages and 2006, the lowest recent year.

Region 2017090 Day 090
Average
2017-Ave. 2006090 2017-2006
 (0) Northern_Hemisphere 14228992 14791162 -562170 13913402 315590
 (1) Beaufort_Sea 1070445 1070018 427 1068683 1762
 (2) Chukchi_Sea 966006 965297 709 959091 6915
 (3) East_Siberian_Sea 1086168 1085794 374 1084627 1541
 (4) Laptev_Sea 897845 896573 1272 897773 71
 (5) Kara_Sea 831189 924617 -93428 922164 -90974
 (6) Barents_Sea 525362 656247 -130885 623912 -98550
 (7) Greenland_Sea 705581 661500 44081 604935 100645
 (8) Baffin_Bay_Gulf_of_St._Lawrence 1467334 1426694 40641 1026934 440401
 (9) Canadian_Archipelago 853214 852652 562 851691 1523
 (10) Hudson_Bay 1260903 1251383 9521 1240389 20514
 (11) Central_Arctic 3247995 3235035 12960 3241074 6921
 (12) Bering_Sea 702504 847340 -144836 662863 39640
 (13) Baltic_Sea 29767 75051 -45284 129348 -99580
 (14) Sea_of_Okhotsk 575084 830273 -255189 588167 -13083
 (15) Yellow_Sea 0 99 -99 1067 -1067
 (16) Cook_Inlet 7318 5460 1858 5462 1856

The marginal seas in the Atlantic and Pacific make the 2017 deficits to average: especially Barents, Kara, Bering and Okhotsk. Those seas usually lose all their ice by September. 2017 Surpluses in Greenland Sea and Baffin Bay are smaller, but make most of the difference with 2006.

2017 Outlook

March this year averaged 14.509 M Km2 compared to the 11 year average of 14.986 M km2, a deficit of 478k km2 or 3.2% down. That suggests that a typical melt later this year would result in a minimum of about 4.5 or 4.6 M km2, slightly down from the 11 year average of 4.8M km2.

Sea Ice Index (SII) typically shows less ice than MASIE, and SII reports a 2017 March average ice extent of 14.273 M km2 compared to SII 11 year March average of 14.842, a drop of 569k km2 or 3.8%.  Folks relying on SII may be expecting a lower September minimum, perhaps even breaking the present plateau of ice extents since 2007.  That remains to be seen.