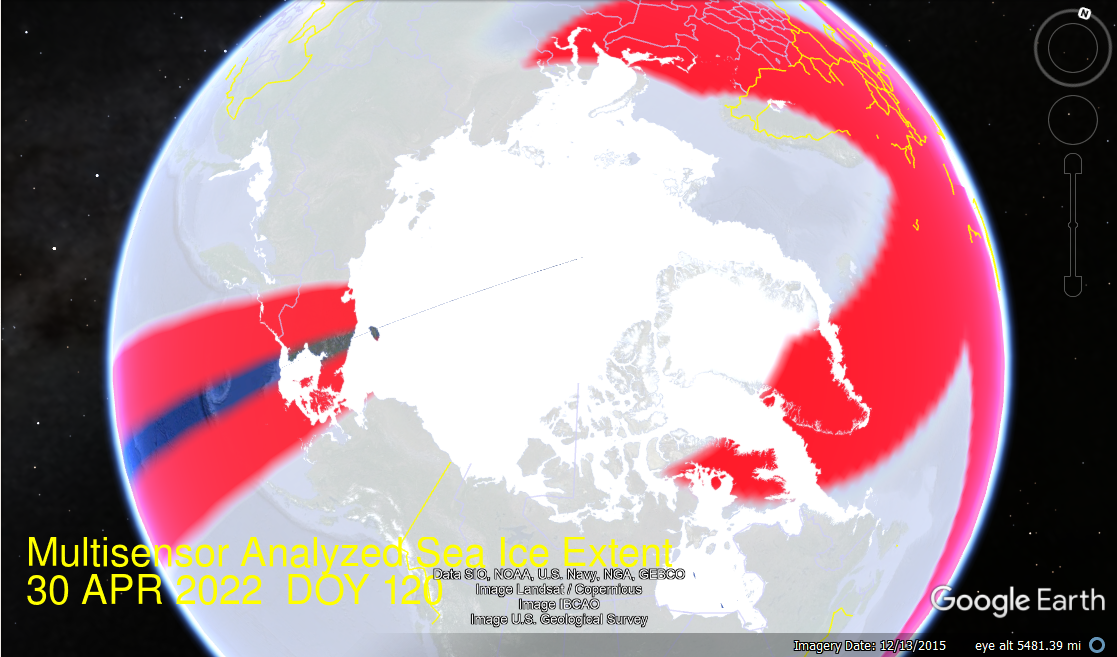
My previous Arctic ice report was limited by technical difficulties, now resolved as shown by the animation above. So this update comes a week into May, with the animation covering the last three weeks from mid April. The dramatic melting in the Pacific basins of Bering and Okhotsk (left) sets them apart from the rest of Arctic sea ice. As noted before, those two basins are outside the Arctic circle, have no polar bears and are the first places to become open water in the Spring. Elsewhere sea ice persisted, actually growing in Barents and Greenland seas.
[The staff at National Ice Center were extremely helpful, as usual. Their work is distinctive, valuable and deserving of your appreciation. See Support MASIE Arctic Ice Dataset]
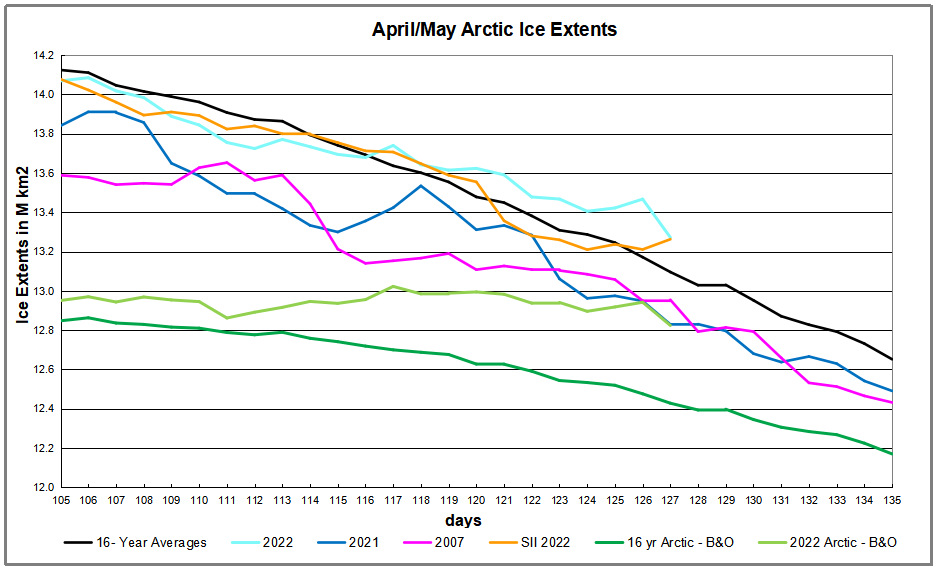
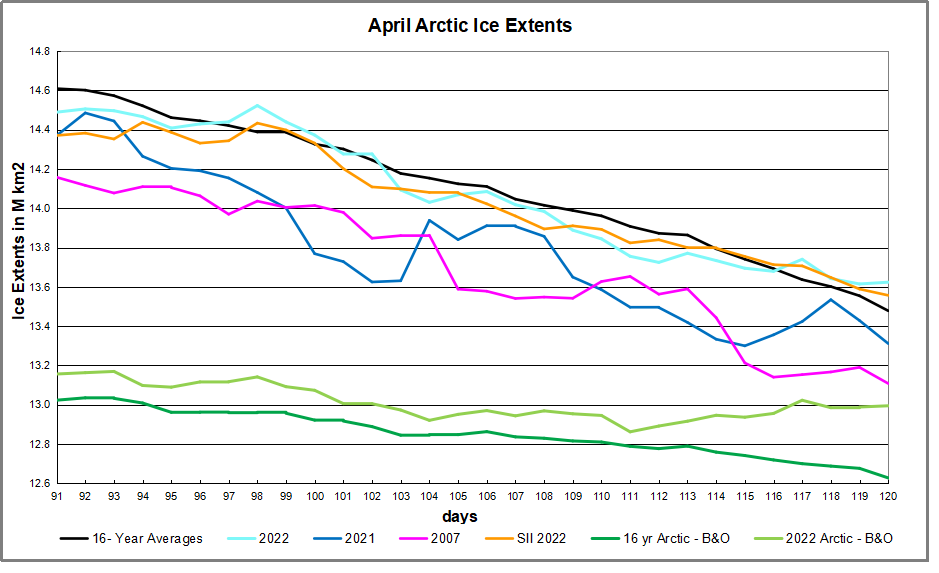
The melting effect on NH total ice extents during this period is presented in the graph below.
The graph above shows ice extent mid-April through May 7 comparing 2022 MASIE reports with the 16-year average, other recent years and with SII. 2022 ice extents have tracked the average, going surplus for the last 10 days. .Both 2021 and 2007 are well below average, on day 127 lower than 2022 by 318k km2 and 443k km2 respectively. The two green lines at the bottom show average and 2022 extents when Bering and Okhotsk ice are excluded. On this basis 2022 Arctic ice was nearly 400k km2 in surplus on May 7, and prior to yesterday, the horizontal line shows little loss of ice extent elsewhere than in the Pacific.
Region
2022127
Day 127 Average
2022-Ave.
2007127
2022-2007
(0) Northern_Hemisphere
13272388
13096082
176306
12954671
317717
(1) Beaufort_Sea
1053640
1059642
-6001
1056022
-2382
(2) Chukchi_Sea
959821
949409
10412
955497
4324
(3) East_Siberian_Sea
1087137
1085912
1225
1081248
5889
(4) Laptev_Sea
897845
892770
5075
870216
27628
(5) Kara_Sea
928813
897443
31370
883059
45754
(6) Barents_Sea
642899
476820
166079
430155
212745
(7) Greenland_Sea
732835
616488
116347
639861
92974
(8) Baffin_Bay_Gulf_of_St._Lawrence
1185073
1140285
44787
1076913
108159
(9) Canadian_Archipelago
854685
845807
8879
845091
9594
(10) Hudson_Bay
1216867
1212411
4456
1192270
24597
(11) Central_Arctic
3248013
3223344
24669
3241053
6960
(12) Bering_Sea
275935
401584
-125649
398914
-122980
(13) Baltic_Sea
14465
13264
1201
10416
4050
(14) Sea_of_Okhotsk
172221
278245
-106023
269684
-97463
The only deficits to average are in Bering and Okhotsk, more than offset by surpluses everywhere else, especially in Barents and Greenland seas, along with Kara and Baffin Bay. At this point, overall NH sea ice is 88% of last March maximum (15.1M kim2). All regions are well above 90% of their maxes, except for Barents (81%), Baffin Bay (66%), Bering (33%) and Okhotsk (20%).
April 1st Footnote:
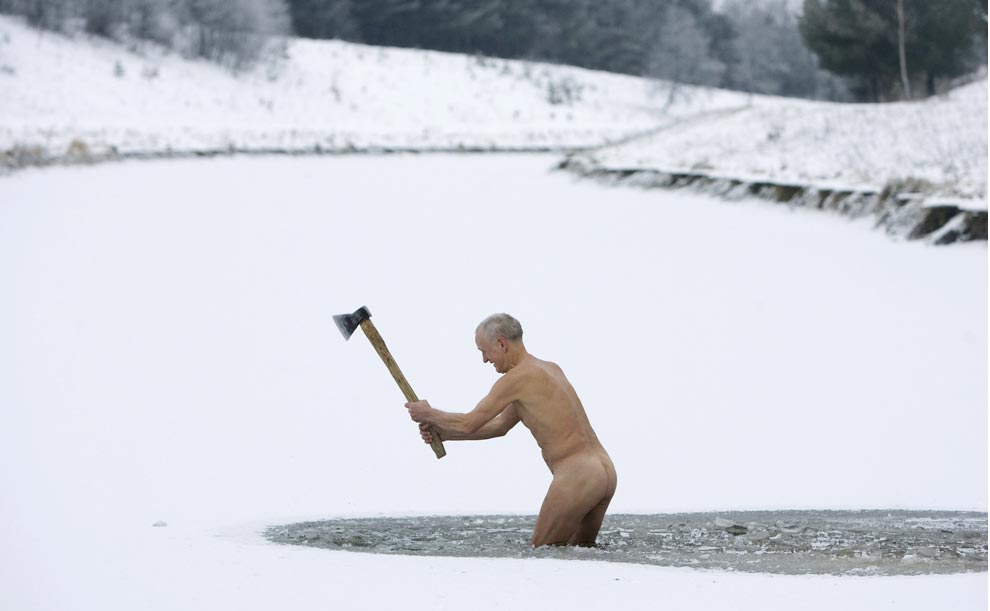
It has been a long hard winter, requiring overtime efforts by Norwegian icebreakers like this one:
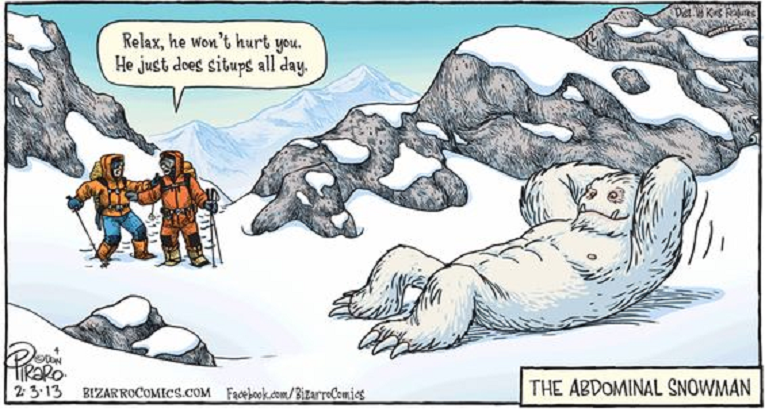
In addition, cold Spring temperatures led to unusual sightings of Northern creatures:
Arctic ice extent changes for the last two weeks are shown in the MASIE animation above. Note that the Pacific basins of Bering and Okhotsk (upper left) melted dramatically. Meanwhile on the Atlantic side ice persisted, actually growing in Barents and Greenland seas.
The strangeness concerns weirdness in Google Earth Pro treatment of kmz files from MASIE. Previous I have used these to produce animations like the one below for the month of March.
Today when attempting to do the same for April, this is what was shown.
That is a screen capture since Google Earth could not render an image. I hope it is just a temporary technical difficulty. But I can’t help but imagine this depicting some kind of military map with a two-pronged attack by red forces with a single resisting force in red and blue. Is it more virtuous canceling of all things Russian at the expense of scientific inquiry? (The mask with colors was only imposed on the Northern Hemisphere)
The melting effect on NH total ice extents during April is presented in the graph below.
The graph above shows ice extent through April comparing 2022 MASIE reports with the 16-year average, other recent years and with SII. On average ice extents lost 1.1M km2 during April. 2022 ice extents started slightly lower, then tracked average, ending slightly above average. Both 2021 and 2007 ended below average, by 200k km2 and 400k km2 respectively. The two green lines at the bottom show average and 2022 extents when Bering and Okhotsk ice are excluded. On this basis 2022 Arctic was nearly 400k km2 in surplus at end of April.
Region
2022120
Day 120 Average
2022-Ave.
2007120
2022-2007
(0) Northern_Hemisphere
13623874
13507670
116204
13108068
515806
(1) Beaufort_Sea
1070776
1067739
3036
1059189
11587
(2) Chukchi_Sea
963424
955654
7770
949246
14178
(3) East_Siberian_Sea
1087137
1085485
1652
1080176
6961
(4) Laptev_Sea
897845
889961
7884
875661
22184
(5) Kara_Sea
932842
911757
21084
864664
68178
(6) Barents_Sea
654813
547685
107129
396544
258270
(7) Greenland_Sea
777073
640123
136950
644438
132635
(8) Baffin_Bay_Gulf_of_St._Lawrence
1243689
1205315
38374
1147115
96574
(9) Canadian_Archipelago
854685
848564
6121
838032
16653
(10) Hudson_Bay
1240262
1238267
1995
1222074
18188
(11) Central_Arctic
3247307
3229654
17652
3241034
6272
(12) Bering_Sea
334929
482018
-147089
475489
-140560
(13) Baltic_Sea
22696
20622
2074
14684
8012
(14) Sea_of_Okhotsk
294259
381697
-87438
295743
-1484
The only deficits to average are in Bering and Okhotsk, more than offset by surpluses everywhere else, especially in Barents and Greenland seas. 2007 extents were lower by 516k km2 (half a Wadham)
April 1st Footnote:
It has been a long hard winter, requiring overtime efforts by Norwegian icebreakers like this one:
In addition, cold Spring temperatures led to unusual sightings of Northern creatures:
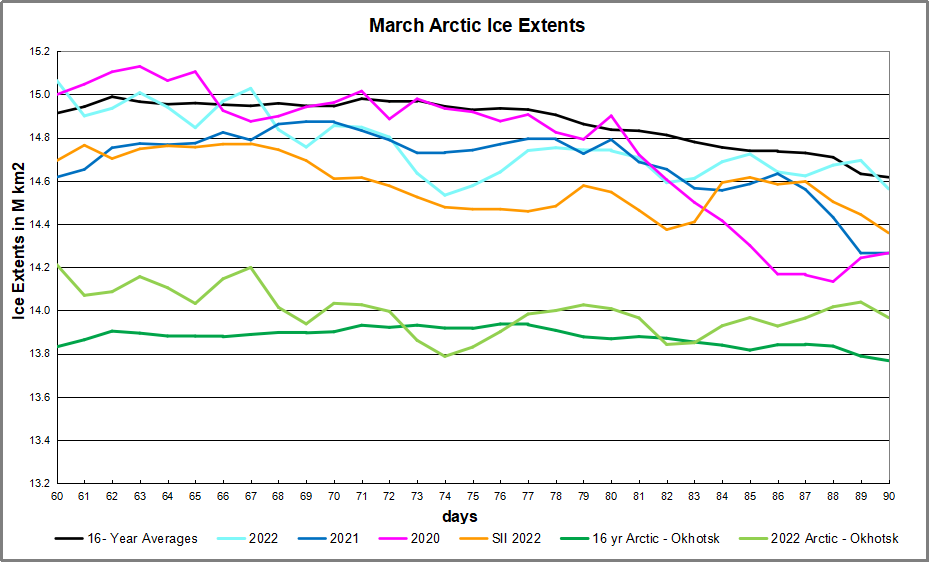
Previous posts showed 2022 Arctic Ice broke the 15M km2 ceiling in February, staying above that level the first week of March, then followed by typical melting in March. As the chart below shows, mid March the overall ice extent was ~400k km2 below the 16 year average, before returning to the mean day 89 and tracking the average since then.
Note the much higher ice extents in 2022 compared to 2021 or 2007. The green lines show that the above normal ice this year is despite low extents in Sea of Okhotsk. The averages in dark green (excluding Okhotsk) are below 2022 in light green (excluding Okhotsk) by nearly 200k km2. IOW everywhere in the Arctic except Okhotsk ice extents are well above average. Remember also that Okhotsk basin is outside the Arctic circle, has no Polar bears, and is among the first to melt out every spring.
The table below shows ice extents in the seas comprising the Arctic, comparing 2022 day 102 with the same day average over the last 16 years and with 2021.
Region
2022102
Day 102 Average
2022-Ave.
2021102
2022-2021
(0) Northern_Hemisphere
14276734
14220846
55888
13625046
651688
(1) Beaufort_Sea
1070776
1069263
1513
1070689
87
(2) Chukchi_Sea
966006
963080
2926
966006
0
(3) East_Siberian_Sea
1087137
1085847
1290
1087137
0
(4) Laptev_Sea
897845
895064
2781
897827
18
(5) Kara_Sea
935023
922556
12467
900979
34045
(6) Barents_Sea
708728
615602
93126
349338
359390
(7) Greenland_Sea
646204
655532
-9329
671290
-25086
(8) Baffin_Bay_Gulf_of_St._Lawrence
1281551
1286670
-5119
1132374
149177
(9) Canadian_Archipelago
854685
852712
1973
854597
88
(10) Hudson_Bay
1260903
1246035
14868
1249891
11012
(11) Central_Arctic
3238576
3230459
8117
3167541
71035
(12) Bering_Sea
765331
658850
106481
545689
219642
(13) Baltic_Sea
51751
47121
4630
21897
29854
(14) Sea_of_Okhotsk
506073
685897
-179824
704441
-198368
The table shows that 2022 ice extent is slightly above average and exceeding 2021 by 652k km2 at this date. Surpluses are sizeable in Bering and Barents, more than offsetting the major Okhotsk deficit. All other regions are showing as typically frozen basins.
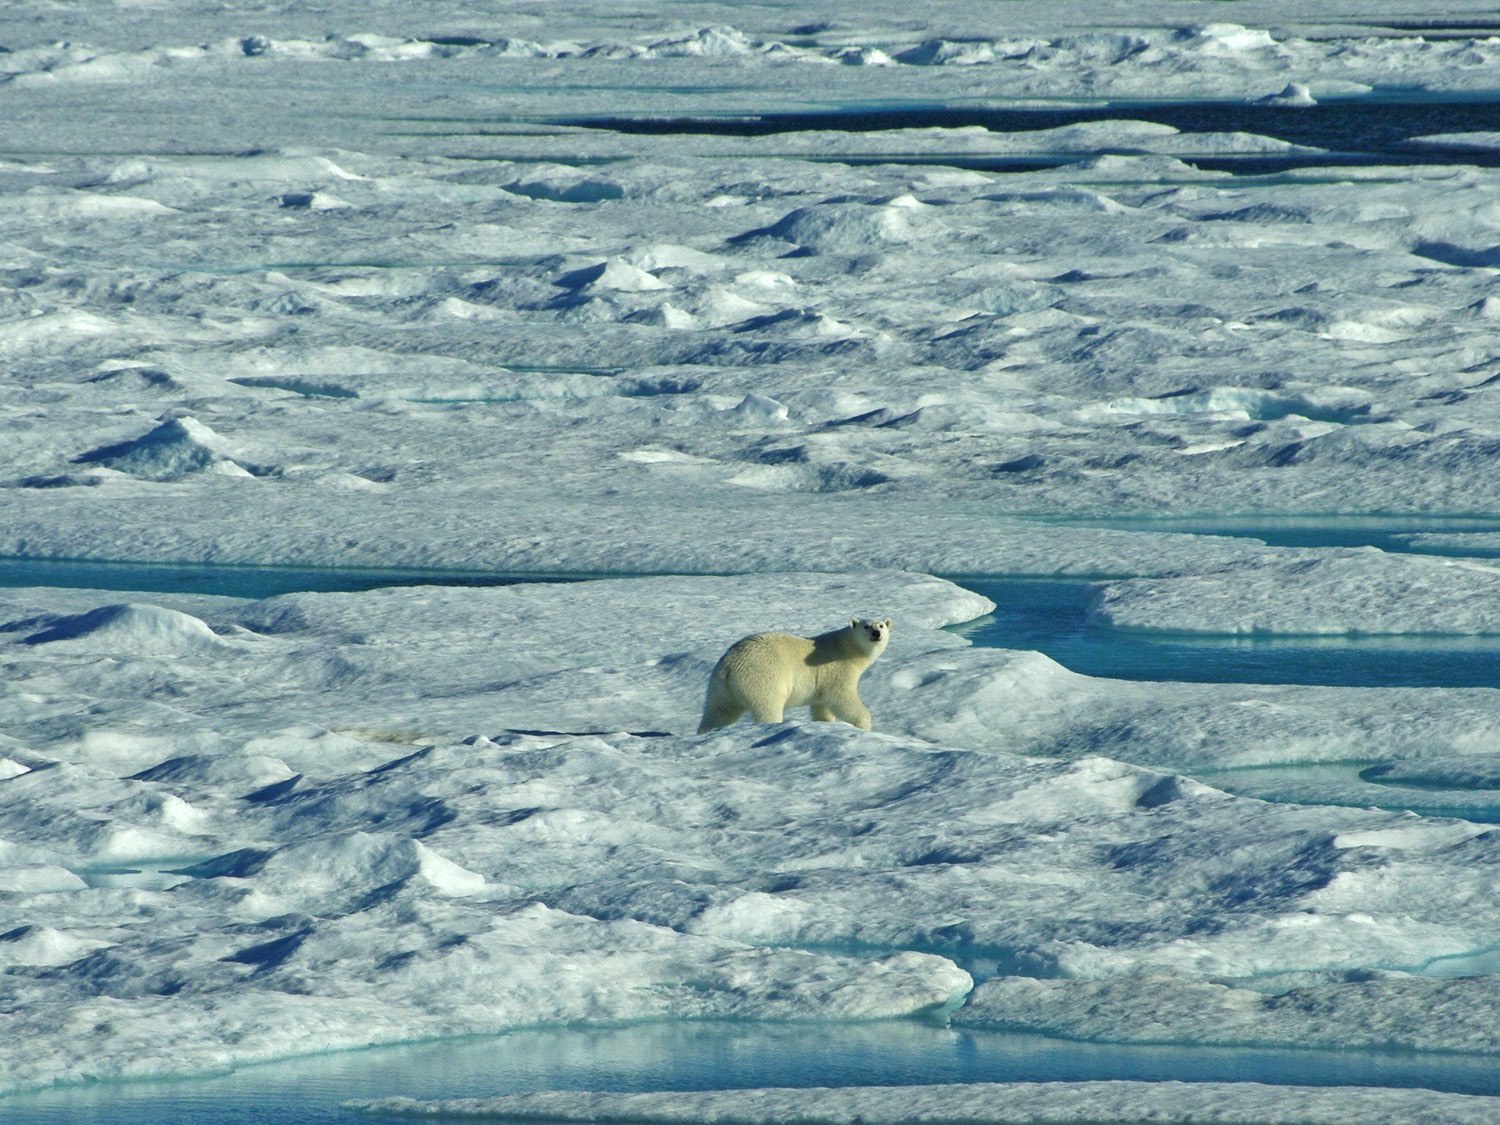
Polar Bear on Ice in Baffin Bay Between Baffin Island and Greenland
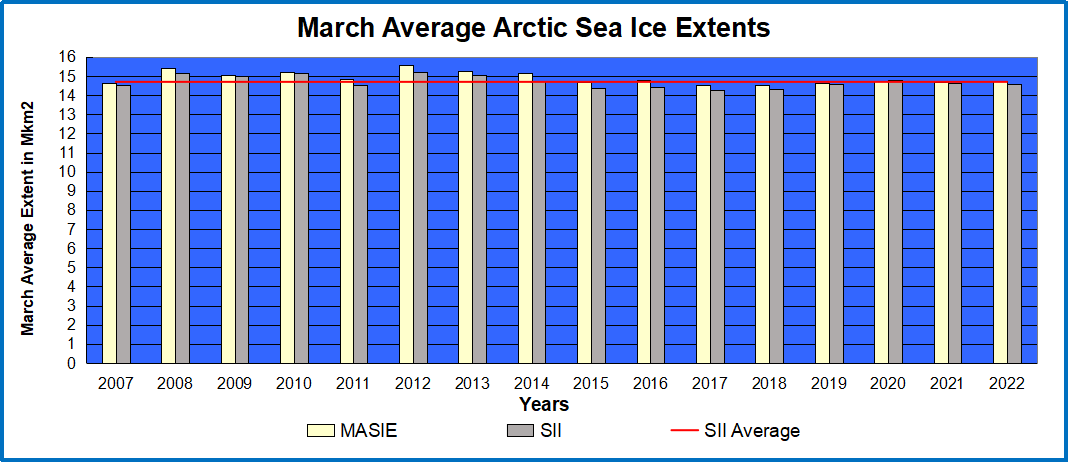
Previous posts showed 2022 Arctic Ice broke the 15M km2 ceiling in February, followed by a typical small melt in March. Climatology refers to the March monthly average ice extent as indicative of the annual maximum Arctic ice extent. The graph above shows that the March monthly average has varied little since 2007, typically around the SII average of 14.7 M km2. Of course there are regional differences as described later on.
The animation shows ice extent fluctuations during March 2022. Bering Sea (lower left) gained ice over the month, while ice in Okhotsk (higher left) retreated. At the top Kara and Barents seas lost and then gained ice. Baffin Bay lower right lost ice during March. The main changes were Baffin losing ~360k km2 of extent and Okhotsk losing ~260k km2.
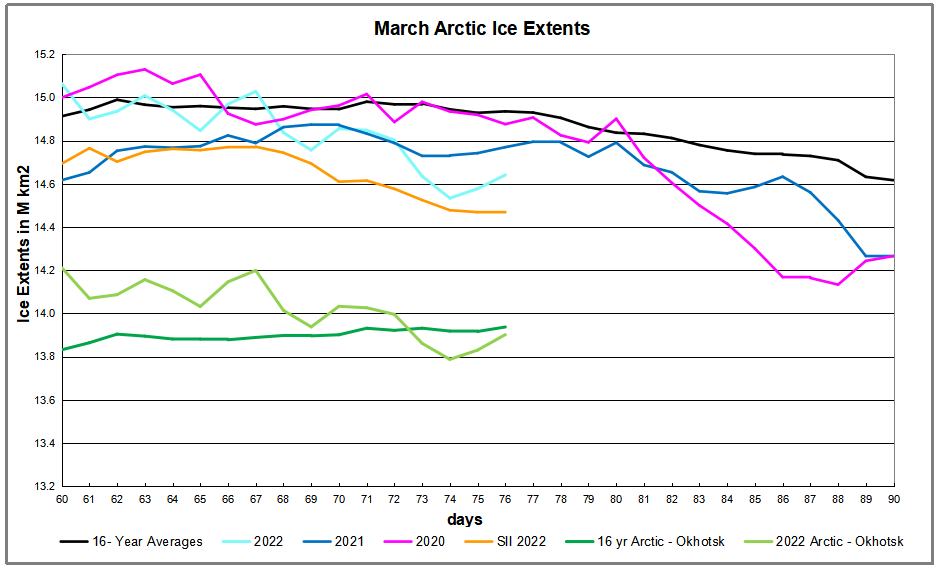
The effect on NH total ice extents is presented in the graph below.
The graph above shows ice extent through March comparing 2022 MASIE reports with the 16-year average, other recent years and with SII. Hovering around 15M km2 the first week, 2022 ice extents dropped sharply mid month, then stabilized and at March end matched the average. Both 2020 and 2021 ended nearly 400k km2 below average. The two green lines at the bottom show average and 2022 extents when Okhotsk ice is excluded. On this basis 2022 Arctic was nearly 400k km2 in surplus, then declined mid month before ending nearly 200k km2 in surplus to average, except for the ice shortage in Okhotsk.
Region
2022090
Day 90 Average
2022-Ave.
2021090
2022-2021
(0) Northern_Hemisphere
14563095
14616765
-53670
14266634
296461
(1) Beaufort_Sea
1070776
1070116
660
1070689
87
(2) Chukchi_Sea
966006
963906
2100
966006
0
(3) East_Siberian_Sea
1087137
1086102
1035
1087137
0
(4) Laptev_Sea
897845
896958
887
897827
18
(5) Kara_Sea
935023
918083
16941
935023
0
(6) Barents_Sea
748326
645014
103311
602392
145934
(7) Greenland_Sea
616239
652388
-36148
620574
-4334
(8) Baffin_Bay_Gulf_of_St._Lawrence
1441014
1400528
40486
1243739
197275
(9) Canadian_Archipelago
854685
852982
1703
854597
88
(10) Hudson_Bay
1260903
1254217
6687
1260903
0
(11) Central_Arctic
3245216
3232275
12941
3192844
52373
(12) Bering_Sea
785874
720525
65348
549939
235935
(13) Baltic_Sea
52068
63446
-11377
33543
18525
(14) Sea_of_Okhotsk
596190
849221
-253031
942085
-345895
The table shows that the large deficit in Okhotsk is only partially offset by surpluses in Bering and Barents Seas. All other regions show typical extents at end of March
April 1st Footnote:
It has been a long hard winter, requiring overtime efforts by Norwegian icebreakers like this one:
In addition, cold March temperatures led to unusual sightings of Northern creatures:
A post last month noted that Arctic ice extent in February unusually exceeded 15M km2 (15 Wadhams). This was despite slower than usual recovery of ice in Sea of Okhotsk. That early 2022 peak ice extent has passed and will now stand as 2022 annual maximum. One wonders why the large ice deficit in that basin. The graph below shows the anomaly.
The 2022 cyan line started March above 15M km2, then declined to day 76 (March 17), ~300k km2 lower than the 16 yr. average. The dark green line shows Arctic ice extent average after Okhotsk is excluded, while the light green is 2022 Arctic extent without Okhotsk. The table below shows that Okhotsk deficit to average on day 76 is 260k km2, almost the entire Arctic deficit.
Region
2022076
Day 76 Average
2022-Ave.
2021076
2022-2021
(0) Northern_Hemisphere
14641084
14935497
-294413
14769906
-128822
(1) Beaufort_Sea
1070776
1070247
529
1070689
87
(2) Chukchi_Sea
966006
965877
129
966006
0
(3) East_Siberian_Sea
1087137
1087107
30
1087120
17
(4) Laptev_Sea
897845
897837
8
897827
18
(5) Kara_Sea
905846
923576
-17730
935006
-29160
(6) Barents_Sea
554036
648194
-94158
849221
-295185
(7) Greenland_Sea
572046
618979
-46934
601423
-29377
(8) Baffin_Bay_Gulf_of_St._Lawrence
1784542
1534462
250080
1288815
495727
(9) Canadian_Archipelago
854685
853020
1665
854597
88
(10) Hudson_Bay
1260691
1258149
2542
1260471
220
(11) Central_Arctic
3153037
3223013
-69976
3222708
-69671
(12) Bering_Sea
729277
755358
-26081
547775
181502
(13) Baltic_Sea
59785
81419
-21634
62626
-2841
(14) Sea_of_Okhotsk
739183
998164
-258981
1117615
-378432
Most places are close to average, with a large surplus in Baffin Bay offsetting small deficits elsewhere. The exception is Okhotsk making up most of the total deficit to average, and even a larger deficit to last year
IOW, had Okhotsk extent been average on day 60 (1.08M km2) instead of 852k km2, the surplus would have been even higher. So why was ice missing in Okhotsk this year?
Firstly, the animation above shows that Okhotsk (and also Bering) sea ice is quite variable year over year. The MASIE record for day 60 shows Okhotsk at 880k km2 in 2006, up to 1230k km2 in 2012, down to 770k km2 in 2015, up to 1080k km2 in 2018, down to 850k km2 in 2022. Notice Okhotsk 2022 is quite similar to 2015, while Bering is about average this year. What causes these fluctuations on annual, decadal and longer time scales?
The answer illustrates the complexity of natural factors interacting to produce climatic patterns we observe and measure. In Okhotsk in particular, and in the Arctic generally, changes in ice extents are a function of the 3 Ws: Water, Wind and Weather. More specifically, water changes in temperature (SST) and salinity (SSS); wind changes with changes in sea level pressures (SLP); and stormy weather varies between cyclonic and anticyclonic regimes. Below is discussion of these natural mechanisms.
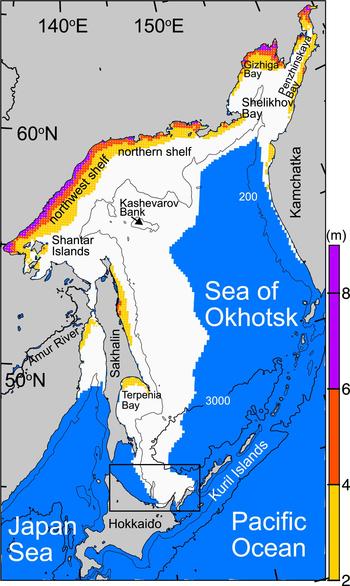
The Sea of Okhotsk is what oceanographers call a marginal sea: a region of a larger ocean basin that is partly enclosed by islands and peninsulas hugging a continental coast. With the Kamchatka Peninsula, the Kuril Islands, and Sakhalin Island partly sheltering the sea from the Pacific Ocean, and with prevailing, frigid northwesterly winds blowing out from Siberia, the sea is a winter ice factory and a year-round cloud factory.
The region is the lowest latitude (45 degrees at the southern end) where sea ice regularly forms. Ice cover varies from 50 to 90 percent each winter depending on the weather. Ice often persists for nearly six months, typically from October to March. Aside from the cold winds from the Russian interior, the prodigious flow of fresh water from the Amur River freshens the sea, making the surface less saline and more likely to freeze than other seas and bays.
Map of the Sea of Okhotsk with bottom topography. The 200- and 3000-m isobars are indicated by thin and thick solid lines, respectively. A box denotes the enlarged portion in Figure 5. White shading indicates sea-ice area (ice concentration ⩾30%) in February averaged for 2003–11; blue shading indicates open ocean area. Ice concentration from AMSR-E is used. Color shadings indicate cumulative ice production in coastal polynyas during winter (December–March) averaged from the 2002/03 to 2009/10 seasons (modified from Nihashi and others, 2012, 2017). The amount is indicated by the bar scale. Source: Cambridge Core
Basics of Weather and Ice Dynamics
Wind directions are named by which point on the compass the prevailing wind hits you in the face. Thus, a southerly wind comes from the south toward the north, typically bringing warmer air north, and displacing colder northern air.
Winds arise from differences in surface pressures. Above every square inch on the surface of the Earth is 14.7 pounds of air. That means air exerts 14.7 pounds per square inch (psi) of pressure at Earth’s surface. High in the atmosphere, air pressure decreases.
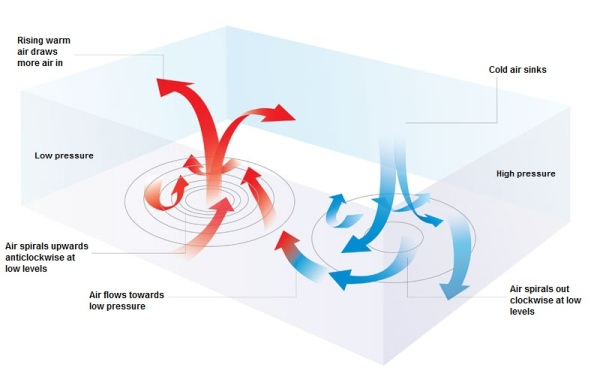
Pressure varies from day to day at the Earth’s surface – the bottom of the atmosphere. This is, in part, because the Earth is not equally heated by the Sun. Areas where the air is warmed often have lower pressure because the warm air rises. These areas are called low pressure systems. Places where the air pressure is high, are called high pressure systems.
A low pressure system has lower pressure at its center than the areas around it. Winds blow towards the low pressure, and the air rises in the atmosphere where they meet. As the air rises, the water vapor within it condenses, forming clouds and often precipitation. Because of Earth’s spin and the Coriolis effect, winds of a low pressure system swirl counterclockwise north of the equator and clockwise south of the equator. This is called cyclonic flow. On weather maps, a low pressure system is labeled with red L.
A high pressure system has higher pressure at its center than the areas around it. Winds blow away from high pressure. Swirling in the opposite direction from a low pressure system, the winds of a high pressure system rotate clockwise north of the equator and counterclockwise south of the equator. This is called anticyclonic flow. Air from higher in the atmosphere sinks down to fill the space left as air is blown outward. On a weather map, you may notice a blue H, denoting the location of a high pressure system.
High and low pressure indicated by lines of equal pressure called isobars.
When the suns shines on land the air is warmed and rises. And because the earth is rotating, an upward spiral forms. Additionally, over wetlands and the oceans there is evaporation, which also rises, H2O being lighter than N2 or O2. When the water is warmer, the rising air intensifies and resulting in a lower pressure than surrounding areas. Arctic cyclones disrupt drift ice, creating more open water, and impede freezing. Arctic anticyclones (HP cells) facilitate cooling and freezing.
The vertical direction of wind motion is typically very small (except in thunderstorm updrafts) compared to the horizontal component, but is very important for determining the day to day weather. Rising air will cool, often to saturation, and can lead to clouds and precipitation. Sinking air warms causing evaporation of clouds and thus fair weather.
The closer the isobars are drawn together the quicker the air pressure changes. This change in air pressure is called the “pressure gradient”. Pressure gradient is just the difference in pressure between high- and low-pressure areas.
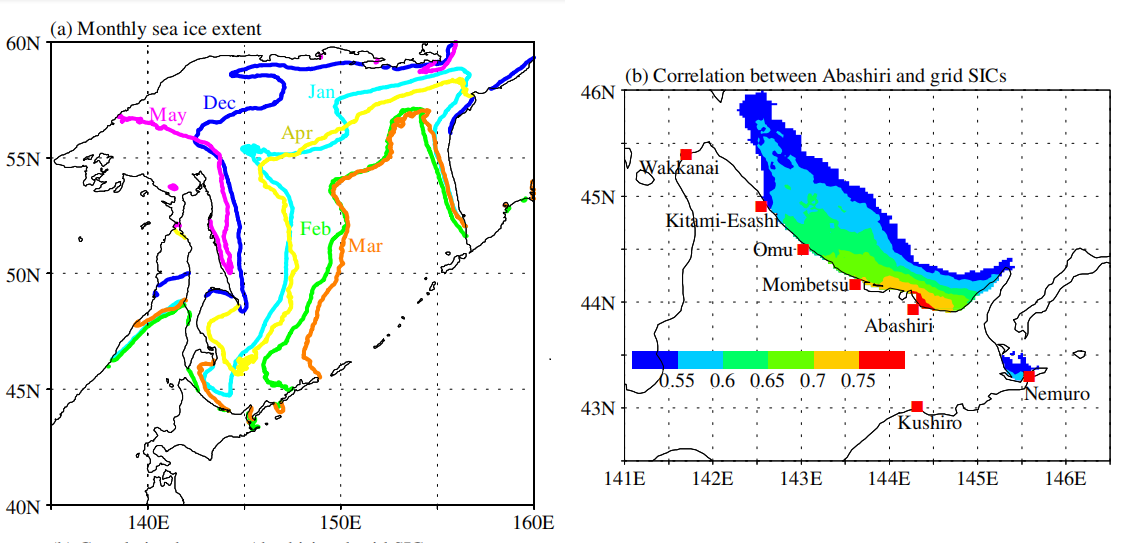
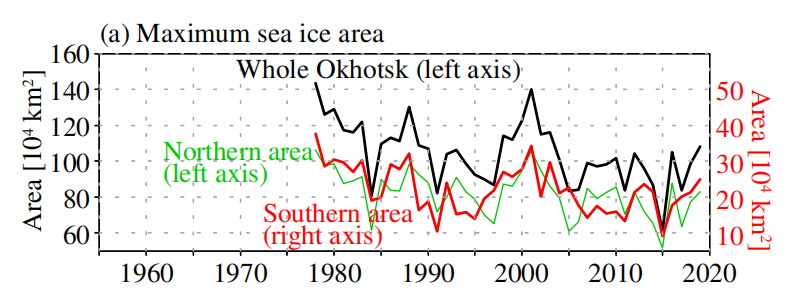
Long-term sea ice observation data at the Japan Meteorological Agency observatories along the Okhotsk coast of Hokkaido were analyzed. The observations at the Abashiri Local Meteorological Observatory largely explained the variations at other sites along much of the Okhotsk coast on a time scale longer than a few days. Interannually, variations of the maximum sea ice areas in the whole and southern Sea of Okhotsk were largely reflected in the yearly accumulated sea ice concentration (SIC) and sea ice duration variations at the observatories.
NPI time series The bars represent five-month mean ( November – March ) NPI values. The green line represents five-year running means of five-month mean NPI values. Positive (negative) NPI values indicate that the Aleutian Low is weaker (stronger) than its normal. For comparison with the PDO index, the period of the graph is adjusted to that of the PDO index.
A comparison with several indices for the North Pacific climate variability suggested that the North Pacific Index (NPI) is a robust indicatorof the recent (after the 1980s) sea ice variations in the Sea of Okhotsk on a decadal time scale. Specifically:
♦ variations in the first sea ice appearance date at the observatories resulted from variations in the Aleutian Low with meridional wind anomalies over the Sea of Okhotsk and the air temperature around Japan in January;
♦ variations in the final disappearance date resulted from the Aleutian Low variations, and,
♦ the resulting sea ice cover variations in the Sea of Okhotsk except for the Siberian coast affected the air temperatures in April. These factors influenced the sea ice duration.
A strong linkage was found between variations in the local sea ice (along the Hokkaido coast) and large-scale fields, which will help improve our understanding of the sea ice extent and retreat variability over the Sea of Okhotsk and its linkage to the North Pacific climate variability.
Fig. 1 (a) Monthly sea ice extent (contours of grid SIC = 0.3) averaged over 1977–2019. (b) Locations of JMA observatories and distribution of dailybasis correlation coefficients between the Abashiri and grid SICs. (N = 700–800 approximately).
Fig. 2 (a) Yearly maximum sea ice areas in the Sea of Okhotsk from the grid SIC data for the whole (black; left axis), northern (>50°N; green; left axis), and southern (<50°N; red; right axis) areas.
Among several climate indices, the NPI is a robust indicator of recent (after the 1980s) sea ice variations in the Sea of Okhotsk. We also examined the differences between the start and end date variations, which determine the durations. Variations in the start date at the Okhotsk coast sites resulted from the variations in the Aleutian Low strength, the air temperature around Japan in January, and partly the SST along the Soya warm current in December. Variations in the end date resulted from the Aleutian Low variations; the sea ice cover variations affected the air temperatures over the Sea of Okhotsk in April, in contrast to the sea ice cover variations in January resulting from the air temperature variations.
Sea Ice Tourism from Hokkaido, Japan
Taking a boat trip from Hokkaido Island to see Okhotsk drift ice is a big tourist attraction, as seen in the short video below. Al Gore had them worried back then, but hopefully not now.
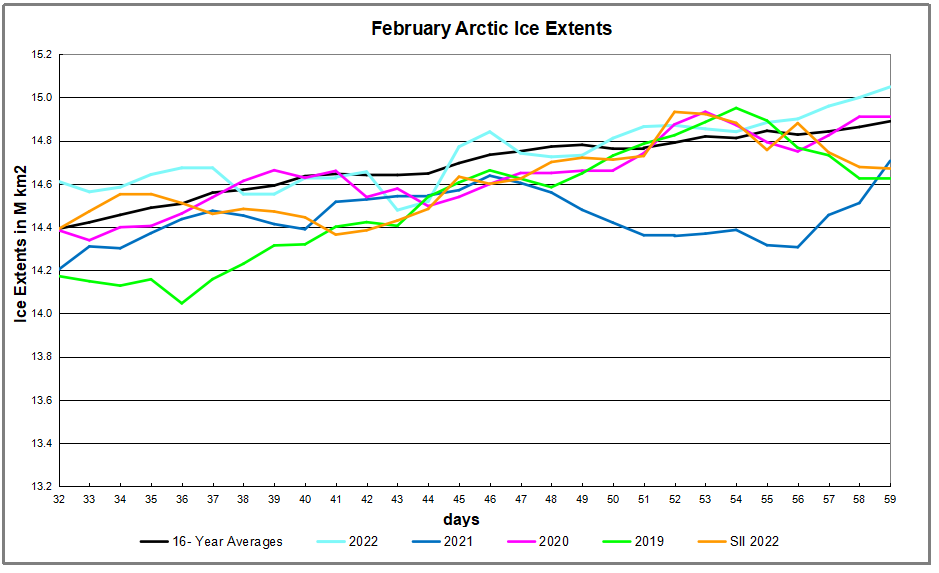
As reported previously, Arctic ice extents are solid in most seas, but continue to fluctuate at the margins. Notably in 2022, ice extents broke the 15M km2 threshold on Feb. 28, whereas the 16-year average falls short of that even in March. It also exceeds the 2021 annual March maximum by 175k km2.
Note the much higher extent this year: 160k km2 greater than the average, and 342k km2 more than 2021. Somehow SII (Sea Ice Index) lost 200k km2 in the last 3 days.
The table below shows ice extents in the seas comprising the Arctic, comparing 2022 day 059 with the same day average over the last 16 years and with 2021.
Region
2022059
Day 59 Average
2022-Ave.
2021059
2022-2021
(0) Northern_Hemisphere
15048826
14889681
159145
14706367
342459
(1) Beaufort_Sea
1070776
1070283
493
1070689
87
(2) Chukchi_Sea
966006
965332
674
966006
0
(3) East_Siberian_Sea
1087137
1087104
34
1087120
17
(4) Laptev_Sea
897827
897836
-10
897827
0
(5) Kara_Sea
927636
926141
1495
935006
-7370
(6) Barents_Sea
742200
624652
117548
743724
-1524
(7) Greenland_Sea
623943
610430
13513
607006
16937
(8) Baffin_Bay_Gulf_of_St._Lawrence
1807904
1499912
307991
1286025
521879
(9) Canadian_Archipelago
854685
853241
1444
854597
88
(10) Hudson_Bay
1260903
1260384
519
1260471
432
(11) Central_Arctic
3247959
3211583
36376
3191259
56699
(12) Bering_Sea
649668
664978
-15310
605478
44189
(13) Baltic_Sea
62334
100387
-38053
100347
-38013
(14) Sea_of_Okhotsk
824154
1074030
-249876
1080692
-256538
The table shows that 2022 ice extent exceeds 2021 by 342k km2 at this date. Surpluses are sizeable in Baffin and Barents, more than offsetting an Okhotsk deficit.
Polar Bear on Ice in Baffin Bay Between Baffin Island and Greenland
The next two weeks will be interesting. The average year in the last sixteen gained about 100k km2 from now to mid March. But the variability ranged from 2015 losing 300K while some other years gained 400k km2. And since 2016, only 2020 broke the 15M km2 ceiling. What will the ice do this year?
In January, most of the Arctic ocean basins are frozen over, and so the growth of ice extent slows down. According to SII (Sea Ice Index) January on average adds 1.326M km2, and this year it was 1.235M. (background is at Arctic Ice New Year 2022). Still February started with a surplus of ~200k km2 over the 16 year average. The few basins that can grow ice this time of year tend to fluctuate and alternate waxing and waning, which appears as a see saw pattern in these images.
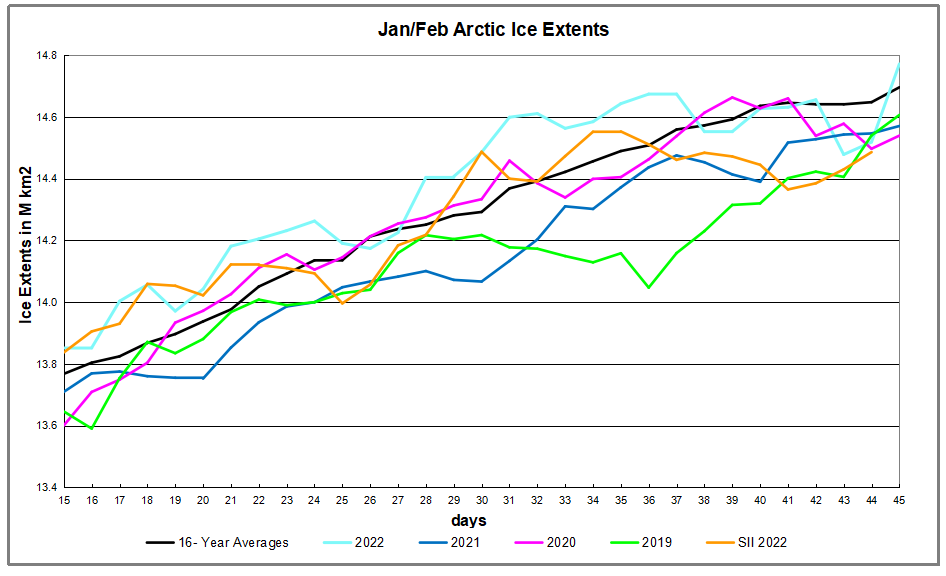
Two weeks into February 2022 Arctic ice extents waffled with little growth, resulting in a drop down to match the mean ice extent mid month. The graph below shows the ice recovery since mid-January for 2022, the 16-year average and several recent years.
The graph shows end of January 2022 a 200k km2 surplus to average, then little accumulation in February 2022 until a leap upward yesterday. SII dropped below MASIE this month and did not yet report its estimate of ice extent on day 45
February Ice Growth Despite See Saws in Atlantic and Pacific
As noted above, this time of year the Arctic adds ice on the fringes since the central basins are already frozen over. The animation above shows Barents and Greenland Seas on upper right (Atlantic side) retreating and growing with little change the last two weeks. Baffin Bay lower right waffled some but added 200k km2 and reached 117% of maximum last March.
Meanwhile the most dramatic see saw appears on the left (Pacific side) Both Bering below and Okhotsk above wax and wane over this period. Okhotsk waffles up and down ending sightly lower in the end, only 60% of its last max. Bering is seen losing, then growing to add 100k km2 by the end, reaching 132% of last March maximum.
The table below presents ice extents in the Arctic regions for day 45 (Feb. 14) compared to the 16 year average and 2021.
Region
2022045
Day 45 Average
2022-Ave.
2021045
2022-2021
(0) Northern_Hemisphere
14771764
14696037
75727
14570648
201117
(1) Beaufort_Sea
1070776
1070247
529
1070689
87
(2) Chukchi_Sea
966006
965730
276
966006
0
(3) East_Siberian_Sea
1087137
1087131
6
1087120
17
(4) Laptev_Sea
897827
897837
-10
897827
0
(5) Kara_Sea
871231
909595
-38364
934988
-63757
(6) Barents_Sea
670586
585796
84790
837700
-167114
(7) Greenland_Sea
711157
617734
93423
637304
73853
(8) Baffin_Bay_Gulf_of_St._Lawrence
1521206
1454881
66326
1103099
418107
(9) Canadian_Archipelago
854685
853210
1475
854597
88
(10) Hudson_Bay
1260903
1260538
365
1260471
432
(11) Central_Arctic
3222483
3210904
11580
3204694
17790
(12) Bering_Sea
841781
692225
149557
545267
296515
(13) Baltic_Sea
64799
96258
-31459
116339
-51540
(14) Sea_of_Okhotsk
706456
930957
-224501
1030304
-323848
The table shows that Okhotsk deficit to average is offset by surpluses in Bering, Barents, Greenland and Baffin Bay.
The polar bears have a Valentine Day’s wish for Arctic Ice.
And Arctic Ice loves them back, returning every year so the bears can roam and hunt for seals.
Footnote:
Seesaw accurately describes Arctic ice in another sense: The ice we see now is not the same ice we saw previously. It is better to think of the Arctic as an ice blender than as an ice cap, explained in the post The Great Arctic Ice Exchange.
Previous posts reported how Arctic ice was growing faster than average as well as last year. Remarkably, several regions have already exceeded their maximum ice extents last March, and overall, Arctic ice is 98% of 2021 maximum with six weeks of freezing season remaining.
The animation shows ice growing the second half of January, notably reaching 1.32M km2 in Baffin Bay, right center, exceeding 2021 max. Greenland Sea, center top, added 144k km2 to reach 710k km2, also greater than last year’s max. And at bottom left Bering Sea reached 741k km2, 116% of last years max.
This year began with a surplus and ended January still 230k km2 higher. The gap over 2021 is 465k km2, nearly half a Wadham. SII dipped and then rose to match MASIE before a drop yesterday.
Region
2022031
Day 31 Average
2022-Ave.
2021031
2022-2021
(0) Northern_Hemisphere
14599079
14368396
230683
14133494
465586
(1) Beaufort_Sea
1070776
1070282
494
1070689
87
(2) Chukchi_Sea
966006
965968
38
966006
0
(3) East_Siberian_Sea
1087137
1087049
89
1087120
17
(4) Laptev_Sea
897827
897821
6
897827
0
(5) Kara_Sea
934844
917081
17763
934952
-108
(6) Barents_Sea
695583
572672
122910
690363
5220
(7) Greenland_Sea
724418
594443
129976
621098
103321
(8) Baffin_Bay_Gulf_of_St._Lawrence
1322799
1336538
-13738
1008582
314217
(9) Canadian_Archipelago
854685
853253
1433
854597
88
(10) Hudson_Bay
1260903
1260753
151
1260471
432
(11) Central_Arctic
3226420
3210376
16045
3203312
23108
(12) Bering_Sea
741202
650072
91130
545486
195717
(13) Baltic_Sea
62895
64264
-1369
52787
10108
(14) Sea_of_Okhotsk
720277
826161
-105884
900121
-179843
The table shows that surpluses in Barents, Greenland and Bering seas more than offset a deficit to average in Okhotsk. In the latter case, ice has finally begun to build up toward a normal extent for this period. With an overall extent of 14.6M km2, prospects are good for maxing higher than 15M km2 by mid March.
The animation focuses on the two Pacific basins since most of the ice action is seen there. The seesaw refers to a frequent observation that Bering and Okhotsk Seas often alternate growing and receding ice extents during both melting and freezing seasons. This month Bering on the right is seen adding ice steadily from 387k km2 to 664k km2, now at 104% of its last March maximum. Meanwhile Okhotsk on the left starts at 466k km2, waffles back and forth, growing to 554k km2 before retreating to match the beginning.
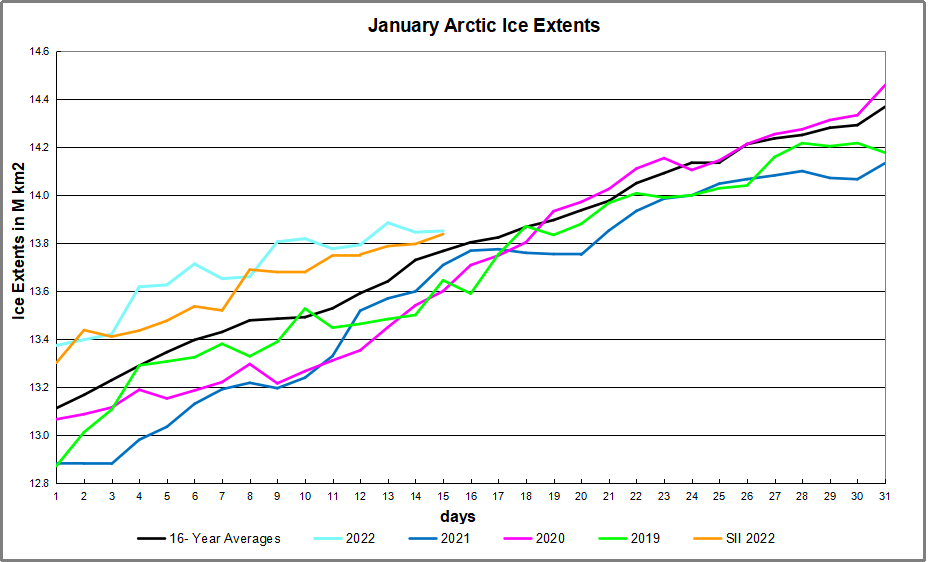
The graph below shows daily ice extents for January 2022 compared to 16 year averages, and some years of note.
The black line shows during January on average (2006 to 2021 inc.) Arctic ice extents increased ~1.3M km2 from ~13.1M km2 up to ~13.4M km2. The 2022 cyan MASIE line started the year 261k km2 above average and on day 15 retained a surplus of 84k km2. The Sea Ice Index in orange (SII from NOAA) started with the same deficit, then lagged behind in the first two weeks, before ending yesterday the same as MASIE. 2021 and 2020 started below average but made up most of the difference by mid month.
Why is this important? All the claims of global climate emergency depend on dangerously higher temperatures, lower sea ice, and rising sea levels. The lack of additional warming is documented in a post UAH Confirms Global Warming Gone End of 2021.
The table below shows the distribution of Sea Ice on day 015 across the Arctic Regions, on average, this year and 2021.
Region
2022015
Day 15 Average
2022-Ave.
2021015
2022-2021
(0) Northern_Hemisphere
13851226
13767662
83564
13709295
141931
(1) Beaufort_Sea
1070776
1070247
529
1070689
87
(2) Chukchi_Sea
966006
965889
117
966006
0
(3) East_Siberian_Sea
1087137
1087131
6
1087120
17
(4) Laptev_Sea
897827
897837
-10
897827
0
(5) Kara_Sea
935023
908782
26242
860326
74697
(6) Barents_Sea
710507
509307
201200
479880
230628
(7) Greenland_Sea
584670
600334
-15664
649983
-65313
(8) Baffin_Bay_Gulf_of_St._Lawrence
1084523
1158194
-73671
1060873
23650
(9) Canadian_Archipelago
854685
853209
1476
854597
88
(10) Hudson_Bay
1260903
1254880
6024
1260471
432
(11) Central_Arctic
3199791
3209964
-10173
3183652
16140
(12) Bering_Sea
664148
535155
128993
503676
160473
(13) Baltic_Sea
44692
42101
2591
31534
13157
(14) Sea_of_Okhotsk
466605
629910
-163305
765767
-299162
The overall surplus to average is 84k km2, (0.6%). Note large surpluses of ice in Barents and Bering Seas. The main deficit to average is in Sea of Okhotsk, as noted at the top.
Illustration by Eleanor Lutz shows Earth’s seasonal climate changes. If played in full screen, the four corners present views from top, bottom and sides. It is a visual representation of scientific datasets measuring Arctic ice extents.
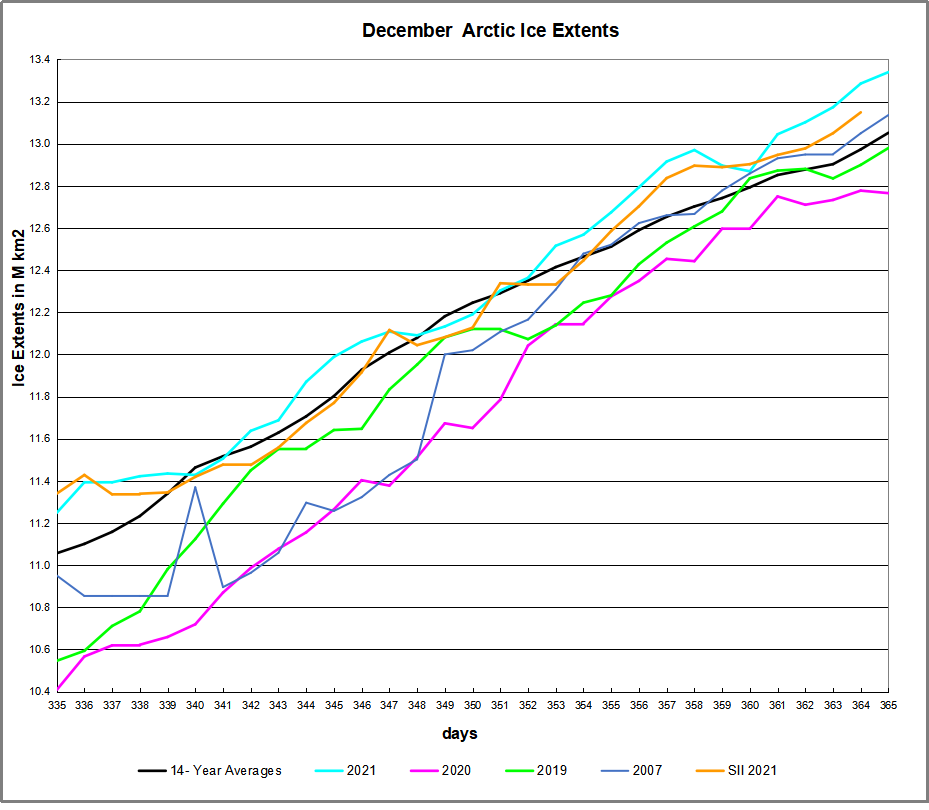
Remarkable Arctic ice recovery continued in December as seen in the animation below:
The month of December 2021 shows Hudson Bay (lower right) starting with only some shore ice and ending virtually ice covered, adding in that basin 925K km2, nearly a full Wadham. Just above Hudson, you can see the Gulf of St. Lawrence icing over, and Baffin Bay adding ice as well, adding 257k km2 to the total.
At the extreme left Okhotsk Sea also starts with shore ice and grows 435k km2, reaching down to Japan. At the top Kara freezes over and Barents and Greenland Seas add ice to their margins. The graph below shows the December ice recovery
Note the average year adds 2M km2 and 2021 exceeded that by ~200k km2, maintaining its surplus position. Other years starting far behind drew closer to average by the end. SII has not yet reported its estimate of day 365.
The table below shows year-end ice extents in the various Arctic basins compared to the 14-year averages and some recent years.
Region
2021365
Day 365 Average
2021-Ave.
2020365
2021-2020
(0) Northern_Hemisphere
13340119
13052148
287971
12765491
574628
(1) Beaufort_Sea
1070776
1070324
452
1070689
87
(2) Chukchi_Sea
966006
964420
1586
966006
0
(3) East_Siberian_Sea
1087137
1087132
5
1087120
17
(4) Laptev_Sea
897827
897841
-14
897827
0
(5) Kara_Sea
932872
883615
49256
879232
53640
(6) Barents_Sea
653611
423352
230260
371122
282489
(7) Greenland_Sea
620509
579341
41168
592839
27671
(8) Baffin_Bay_Gulf_of_St._Lawrence
873269
1003682
-130413
867509
5760
(9) Canadian_Archipelago
854685
853276
1409
854597
88
(10) Hudson_Bay
1245910
1236600
9311
1257919
-12009
(11) Central_Arctic
3221247
3203619
17628
3159881
61366
(12) Bering_Sea
358002
408726
-50724
249522
108481
(13) Baltic_Sea
61428
30674
30755
7986
53443
(14) Sea_of_Okhotsk
478257
382234
96023
479972
-1715
This year’s ice extent is almost 300k km2 or 2% above average. Only Baffin Bay and Bering Sea are in deficit to average, more than offset by surpluses elsewhere, especially in Kara, Barents and Okhotsk seas.
Comparing Arctic Ice at End of Years
At the bottom is a discussion of statistics on year-end Arctic Sea Ice extents. The values are averages of the last five days of each year. End of December is a neutral point in the melting-freezing cycle, midway between September minimum and March maximum extents.
Background from Previous Post Updated to Year-End 2021
Some years ago reading a thread on global warming at WUWT, I was struck by one person’s comment: “I’m an actuary with limited knowledge of climate metrics, but it seems to me if you want to understand temperature changes, you should analyze the changes, not the temperatures.” That rang bells for me, and I applied that insight in a series of Temperature Trend Analysis studies of surface station temperature records. Those posts are available under this heading. Climate Compilation Part I Temperatures
This post seeks to understand Arctic Sea Ice fluctuations using a similar approach: Focusing on the rates of extent changes rather than the usual study of the ice extents themselves. Fortunately, Sea Ice Index (SII) from NOAA provides a suitable dataset for this project. As many know, SII relies on satellite passive microwave sensors to produce charts of Arctic Ice extents going back to 1979. The current Version 3 has become more closely aligned with MASIE, the modern form of Naval ice charting in support of Arctic navigation. The SII User Guide is here.
There are statistical analyses available, and the one of interest (table below) is called Sea Ice Index Rates of Change (here). As indicated by the title, this spreadsheet consists not of monthly extents, but changes of extents from the previous month. Specifically, a monthly value is calculated by subtracting the average of the last five days of the previous month from this month’s average of final five days. So the value presents the amount of ice gained or lost during the present month.
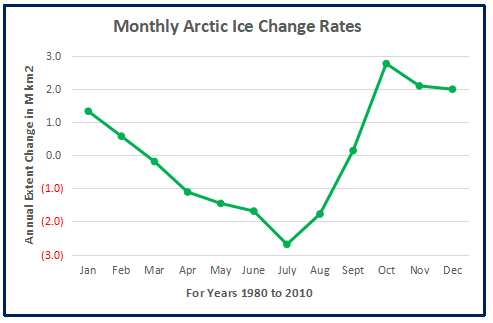
These monthly rates of change have been compiled into a baseline for the period 1980 to 2010, which shows the fluctuations of Arctic ice extents over the course of a calendar year. Below is a graph of those averages of monthly changes during the baseline period. Those familiar with Arctic Ice studies will not be surprised at the sine wave form. December end is a relatively neutral point in the cycle, midway between the September Minimum and March Maximum.
The graph makes evident the six spring/summer months of melting and the six autumn/winter months of freezing. Note that June-August produce the bulk of losses, while October-December show the bulk of gains. Also the peak and valley months of March and September show very little change in extent from beginning to end.
The table of monthly data reveals the variability of ice extents over the last 4 decades.
The values in January show changes from the end of the previous December, and by summing twelve consecutive months we can calculate an annual rate of change for the years 1979 to 2021.
As many know, there has been a decline of Arctic ice extent over these 40 years, averaging 70k km2 per year. But year over year, the changes shift constantly between gains and losses.
Moreover, it seems random as to which months are determinative for a given year. For example, much ado was printed about June and July 2021 melting faster than expected resulting in higher losses of ice extents. But then the final 3 months of 2021 more than made up for those summer losses
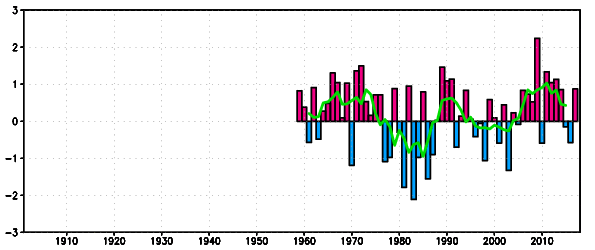
As it happens in this dataset, October has the highest rate of adding ice. The table below shows the variety of monthly rates in the record as anomalies from the 1980-2010 baseline. In this exhibit a red cell is a negative anomaly (less than baseline for that month) and blue is positive (higher than baseline).
Note that the +/ – rate anomalies are distributed all across the grid, sequences of different months in different years, with gains and losses offsetting one another. Yes, June 2021 lost more ice than the baseline, but about the same as 2017, and not as much as 2012. The gains in Oct.-Dec. 2021 were ~1M km2 above baseline, but were exceeded by the same months in 2019 and 2020. The bottom line presents the average anomalies for each month over the period 1979-2021. Note the rates of gains and losses mostly offset, and the average of all months in the bottom right cell is virtually zero.
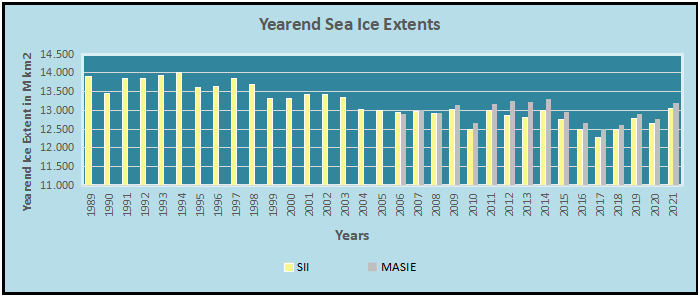
A final observation: The graph below shows the Yearend Arctic Ice Extents for the last 32 years.
Year-end Arctic ice extents (last 5 days of December) show three distinct regimes: 1988-1998, 1998-2010, 2010-2021. The average year-end extent 1989-2010 is 13.4M km2. In the last decade, 2011 was 13.0M km2, and six years later, 2017 was 12.3M km2. 2021 rose back to 13.06 So for all the the fluctuations, the net is zero, or a gain from 2010. Talk of an Arctic ice death spiral is fanciful.
These data show a noisy, highly variable natural phenomenon. Clearly, unpredictable factors are in play, principally water structure and circulation, atmospheric circulation regimes, and also incursions and storms. And in the longer view, today’s extents are not unusual.
Illustration by Eleanor Lutz shows Earth’s seasonal climate changes. If played in full screen, the four corners present views from top, bottom and sides. It is a visual representation of scientific datasets measuring Arctic ice extents.


 The table below shows the distribution of Sea Ice on day 015 across the Arctic Regions, on average, this year and 2021.