Arctic Ice Takes Revenge

Vessels Kapitan Dranitsyn and Admiral Makarov ‘marooned’ in east for the rest of winter after getting trapped off Chukotka.
Russian Convoy Takes Advantage of Reduced Arctic Ice Extent
In the first such crossing since Soviet times, the convoy had earlier delivered supplies for the world’s first floating heat and power plant to be assembled in Chukotka, Russia’s most easternmost region, after a successful journey from Arkhangelsk to Pevek lasting from 14 December to 7 January.
The ease of the sailing was seen as a sign that climate warming in the Arctic can open up shipping lanes even in midwinter. From the Siberian Times, Blow to Northern Sea Route as voyages of two icebreakers are… broken by ice
Reports of Arctic Ice Demise Prove Premature
But, despite significant temperature rises across the northern latitudes in recent years, the vessels became quickly stuck in thick, compressed ice on their return journey.
Initially there were hopes that the icebreakers could force their way out and continue their voyage within a week, and aerial reconnaissance was deployed in a search routes from the ice clog.

They are currently trapped by sudden thick ice around Chukotka’s northernmost cape Shelagsky, some 24 nautical miles from Pevek, in some of Russia’s most exposed waters.
Ruslan Nazarov, chief of Chukotka’s emergencies service, said: ‘The ice around Cape Shelagsky is at 10 points. The ice fields are more than one metre thick. The ice compression is strong and hummocks are higher than 2.5 metres.

Embarrassing But Not Life-threatening
The situation is not critical, Nazarov said, stressing that the regional ministry of emergencies and Chukotka government keep a close eye on it. ‘All the ships have enough fuel, food and all other necessities.’
A spokesman for Rosmorport has announced the icebreakers will delay a return until probably May or early June. ‘The vessels will remain for the winter because of the very heavy severe ice conditions,’ he said.
All the vessel got out of the ice, and three of them – Captain Dranitsyn and the two cargo ships – returned to Pevek. The Admiral Makarov moved further east to continue working for Rosmorport in clearing sea routes.
Officials said the icebreakers could have gone further through the ice but there was ‘a very high risk of significant damage’ to the supply ships, and it was decided to postpone the return to Archangelsk.
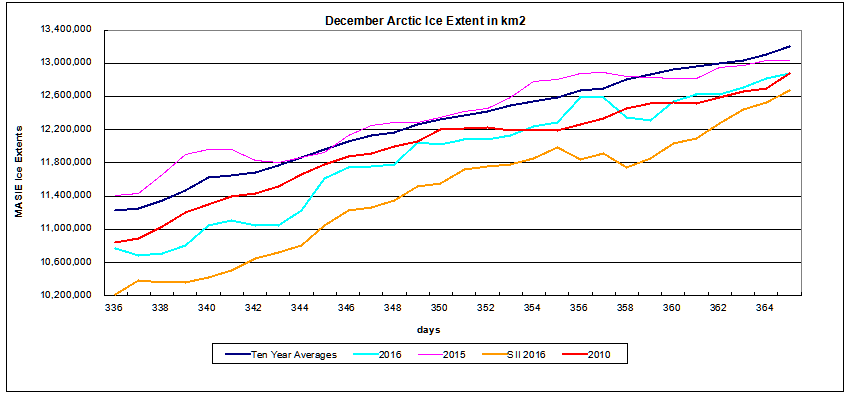
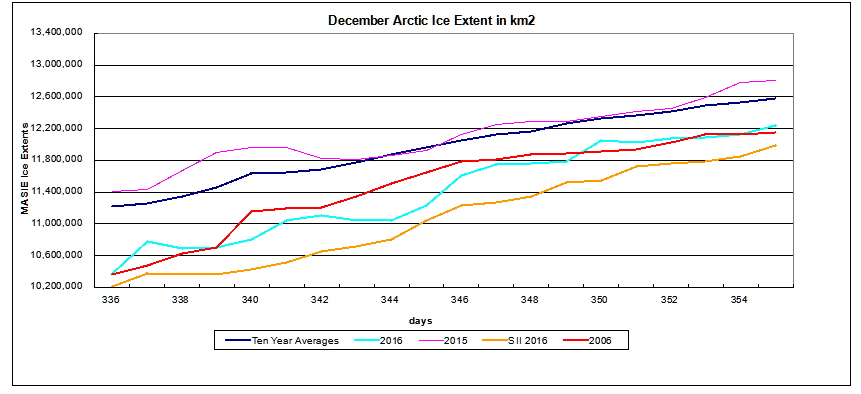
Arctic Ice Picks Up the Pace Everywhere
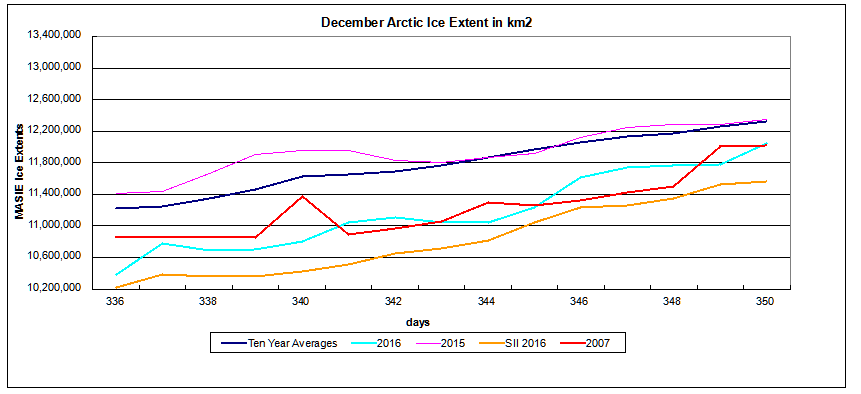
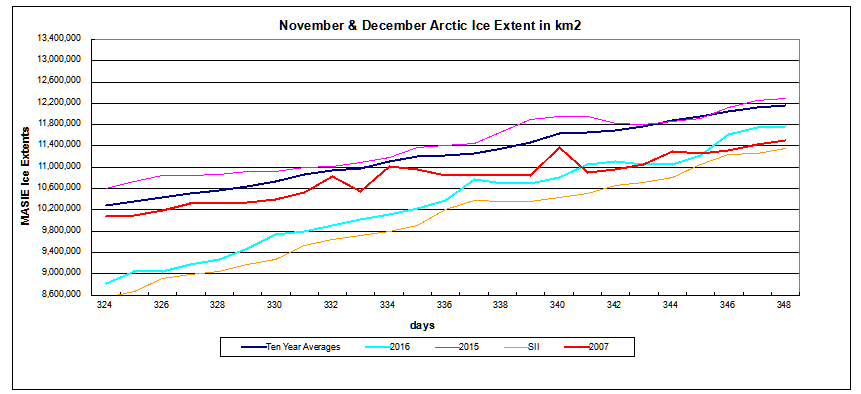
After a slow recovery in October and December, ice extent has picked considerably in recent weeks.
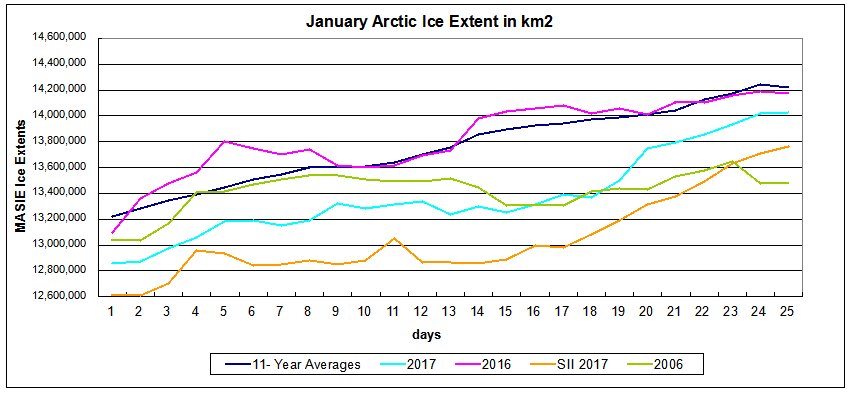
The graph shows how 2017 has surged to approach 2016 and the 11-year average, while exceeding 2006 (the decadal low year) by almost 500k km2. Sea Ice Index (SII satellite product) lags behind by more than 300k km2, as it has throughout January.
The table shows ice extents across the seas within the Arctic area.
| Region | 2017025 | Day 025 Average |
2017 -Ave. |
2006025 | 2016-2006 |
| (0) Northern_Hemisphere | 14023232 | 14217519 | -194287 | 13473190 | 550042 |
| (1) Beaufort_Sea | 1070445 | 1070111 | 334 | 1069711 | 734 |
| (2) Chukchi_Sea | 966006 | 966001 | 5 | 966006 | 0 |
| (3) East_Siberian_Sea | 1087137 | 1087131 | 6 | 1087103 | 35 |
| (4) Laptev_Sea | 897845 | 897835 | 10 | 897773 | 71 |
| (5) Kara_Sea | 914838 | 918784 | -3946 | 897490 | 17348 |
| (6) Barents_Sea | 390190 | 547198 | -157007 | 310539 | 79651 |
| (7) Greenland_Sea | 646404 | 589533 | 56871 | 516605 | 129799 |
| (8) Baffin_Bay_Gulf_of_St._Lawrence | 1328099 | 1275341 | 52758 | 1087283 | 240815 |
| (9) Canadian_Archipelago | 853214 | 852982 | 232 | 852715 | 499 |
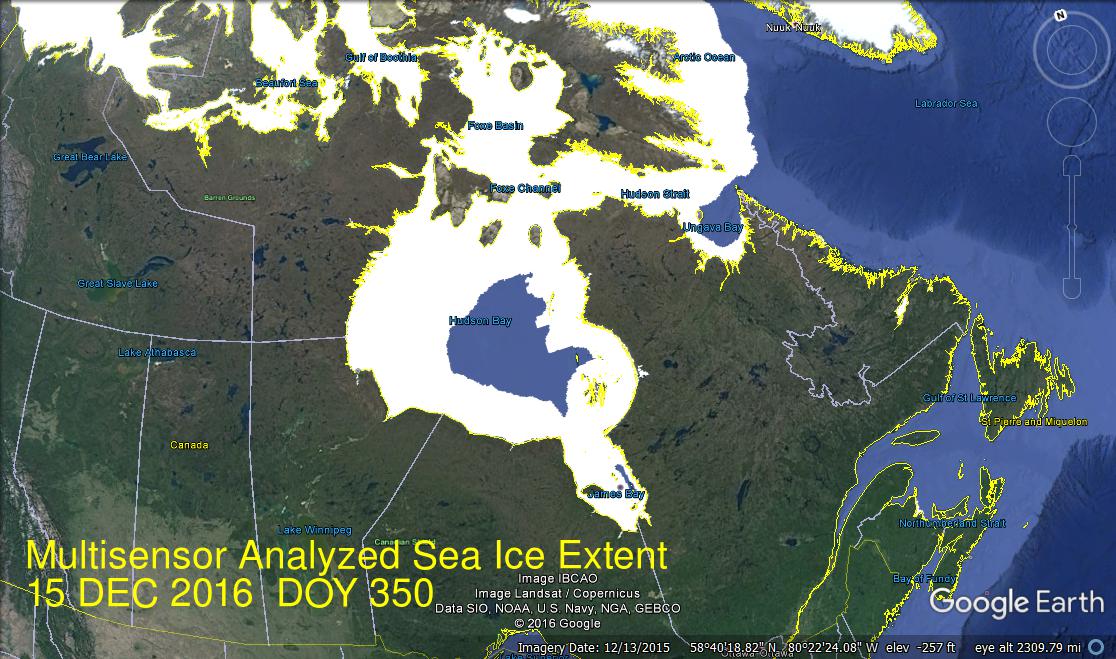
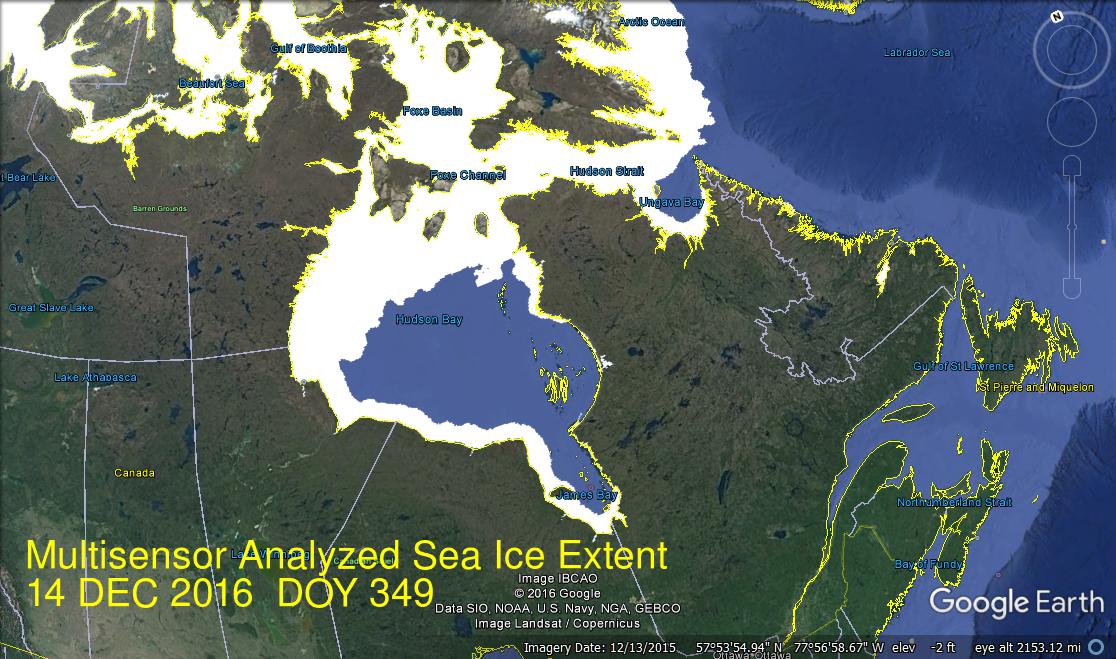
| (10) Hudson_Bay | 1260887 | 1260842 | 45 | 1260779 | 108 |
| (11) Central_Arctic | 3138059 | 3210975 | -72916 | 3109874 | 28185 |
| (12) Bering_Sea | 488459 | 689158 | -200699 | 817517 | -329058 |
| (13) Baltic_Sea | 32910 | 78733 | -45822 | 53850 | -20939 |
| (14) Sea_of_Okhotsk | 908522 | 712635 | 195887 | 470477 | 438045 |
| (15) Yellow_Sea | 20850 | 26566 | -5716 | 11722 | 9128 |
| (16) Cook_Inlet | 7952 | 11204 | -3252 | 8941 | -989 |
On the Russsian side, Chukchi through Laptev are all at maximums, as evidenced in the reports from the Siberian Times. Kara is also now average and well ahead of 2006. Barents continues to be in deficit to average, but in surplus to 2006. On the Canadian side, all seas are above average, with Greenland and Baffin well into surpluses.
The main difference between 2017 and the average is Bering Sea down by 200k km2. Bering Sea is the only place with less 2017 ice than 2006. On the other hand, Okhotsk is 200k km2 above average and 400k km2 above 2006.
Summary
Just when they thought it was safe to go back in the winter water, the ice returns. As Siberian Times concluded:
But the saga shows that despite all the talk of climate change and warming in the Arctic, thick ice can prevent convoys from crossing the Northern Sea Route in deep winter.